Spectral Clustering of Protein Sequences Using Sequence-Profile Scores Rajkumar Sasidharan1, Mark Gerstein1, Alberto Paccanaro2* 1
Rajkumar Sasidharan Molecular Biophysics and Biochemistry Department, 266 Whitney Avenue, Yale University, New Haven, CT 06520 USA. Email:
[email protected] Tel: +1 203 432 8972 1
Mark Gerstein Molecular Biophysics and Biochemistry Department, 266 Whitney Avenue, Yale University, New Haven CT 06511, USA. Email:
[email protected] Tel: +1 203 432 6105 2*
Alberto Paccanaro (corresponding author) Department of Computer Science, Royal Holloway University of London, Egham TW20 0EX, UK. Email:
[email protected] Tel: +44 1784 414239
Abstract Clustering protein sequences using sequence information is an important problem in genomics. Typically, clustering methods use sequence-sequence distances between pairs of proteins. In this paper we present a new method, based on spectral clustering, that uses a distance measure obtained from a sequence-profile method. We use the SCOP database, considered a gold-standard for the classification of protein structures based on structural and functional features, to assess the results. Here we show that this new method outperforms both global and local methods which use sequence-sequence distances.
1. Introduction An important problem in today’s genomics is that of grouping together evolutionary related proteins when only sequence information is available. Genome sequencing projects have led to a huge increase in the number of known protein sequences. Grouping together sequences with common evolutionary origin provides a high-level view of sequence space. It facilitates identification of general features which may be associated with given biological functions. If some of the sequences are of unknown biological function their placement in a particular neighbourhood may give a clue to their function. From a biological perspective it is desirable to group together as many evolutionarily related sequences as possible, while not contaminating the clusters with false positives. Clearly a very conservative cut-off for defining relatedness would exclude the latter possibility but it would most likely mean that many sequences remain singletons, because the distance to the nearest neighbourhood is deemed to be too far for membership to that community. In addition to a meaningful grouping of sequences, we require a fast algorithm for computing the distances. However the measure of distance (or similarity) may not capture all functional relationships, as some
sequences with common evolutionary origin can have very weak sequence similarity; recognizing these distant relationships is difficult. In the next section we first describe BLAST E-value between two sequences, the distance measure most commonly used in protein clustering applications (Altschul et al., 1990). We then briefly review a spectral clustering algorithm which we have recently introduced for clustering protein sequences (Paccanaro et al, 2006); the method uses BLAST E-values and has given excellent results. In section 3 we describe a distance measure obtained using a popular sequence-profile method (PSIBLAST E-value), and we explain why it should be a much better (i.e. less noisy) measure of evolutionary relatedness. We then present here a modification of our spectral clustering method, which uses PSI-BLAST E-values rather than BLAST E-values as distances between sequences. We show that on a set of difficult problems results are greatly improved with respect to the original formulation of our method. 2. Spectral clustering of protein sequences using BLAST E-values BLAST is the most frequently used program in molecular biology to calculate sequence similarities by searching protein and nucleic acid sequence databases. BLAST is a heuristic that generates local alignments by breaking the query and database sequences into fragments or words and seeking matches between fragments. BLAST E-values try to quantify how likely it is that two sequences are evolutionarily related. This is done by first aligning the sequences, and then assessing the probability that the alignment did not occur by chance. The BLAST program searches for high scoring segment pairs (HSPs). These are continuous un-gapped segments where the query sequence matches a sequence in the database over a number of residues. The HSP is scored using a substitution matrix that scores similar amino acids high and differing amino acids negatively. Let us call S the raw score given by adding these values over the HSP for two given sequences, of length m and n respectively. The expected number of HSPs with score at least S (this is the maximum of a large number of i.i.d. random variables and therefore is described by the extreme value distribution) is: E K m n e S . This is the E-value for the score S (where and K and are parameters describing scale of search space and scoring system). Now, the number of HSPs with score greater than or equal to S is described by the Poisson distribution. So, the probability of finding c HSPs with score greater than S is given by: e E E c / c ! This means the probability of finding at least one HSP with score S is P 1 e E . This is the P value which is also reported by BLAST -- E-values are used to characterize BLAST scores because they are easier to handle than the P values. The datasets we used in our experiments were obtained from SCOP (Murzin et al. 1995, Lo Conte et al., 2002). SCOP is an expert, manually curated database where protein domains are grouped together on the basis of their 3-dimensional structure and function. It is organized in a hierarchical manner at four main levels, viz., class, fold, superfamily and family. Proteins in the same superfamily are believed to be evolutionary related. What is important is that some of these relationships may not be apparent from sequence consideration alone and proteins in a superfamily might have very low sequence identities. Therefore, at superfamily level, SCOP provides a “gold standard” for testing algorithms that cluster proteins based on their evolutionary and functional relatedness. Considering the grouping provided by SCOP superfamilies as the “ground truth”, it is possible to use the F-measure, which combines Precision and Recall with equal weights, to evaluate the quality of the clustering obtained (Everitt, 1993). To introduce our spectral method for clustering protein sequences, we consider an undirected graph in which each node in the graph corresponds to a protein sequence and the edges correspond to the similarity between the two sequences it connects. The problem is to identify tightly coupled clusters, and cut intercluster edges. Following the formulation in Meila et al. (2001), we consider an undirected graph G = (V,E) with vertices vi V , for i = 1, …, n, and edges ei , j E with non-negative weights si , j (the similarity between vertices vi and v j ). The edge weights are assumed to be symmetric, that is, si , j s j ,i . Similarities are collected
into a symmetric n×n matrix S with elements si , j . We shall use d to denote the vector of degrees of the
nodes, that is: d (d1 d n ) , where di si , j . D will denote the diagonal matrix of degrees: j
D diag (d)
.
Spectral methods use the leading eigenvectors of a matrix derived from the similarity information. There are various ways in which this can be done. A method which has been proposed recently (Ng et al., 2001), and was shown to give good results in a variety of difficult problems is the following: 1. From the affinity matrix S construct a symmetric normalised matrix L D 1/ 2 S D 1/ 2 . 2. Find a matrix U of eigenvectors: U [u1 , u 2 , , u k ] , corresponding to the K largest eigenvalues of L.
3. Build a matrix Y by re-normalising each of U’s rows to have unit length: Yi , j U i , j /( j U i2, j )1/ 2 4. Treating the rows of Y as points in k , cluster them into K clusters using K-Means 5. Assign node i to cluster k if and only if row i of the matrix Y was assigned to cluster k.
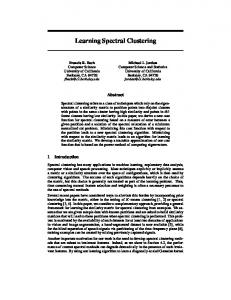
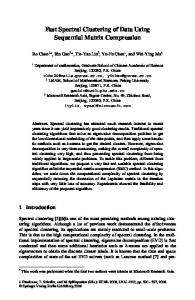
Recently, we have proposed a spectral method which uses the above algorithm to cluster protein sequences. In order to cluster a set of proteins, we began by computing the BLAST E-values for each pair of sequences in the set, and collected them into a matrix P. In general P will not be symmetrical, since there are no guarantees that the E-value obtained when aligning protein a with b will the same which is obtained when s s aligning protein b with a. We transformed P into a symmetrical matrix, S, by assigning to each i , j and j ,i p p the higher of the two values i , j and j ,i . This amounts to a conservative interpretation of the E-values. In order to integrate some background knowledge into our method, we analysed the statistics of the BLAST E-values for the same and different superfamilies. To do this we randomly extracted superfamilies from SCOP until we had collected about 1000 proteins. We used these sequences to create two sets of distances, one of intra-class distances (which contained 15544 elements), and one of inter-class distances (with 981670 elements). We then used this data to train a simple logistic regression model to discriminate between the two classes. We can interpret the posterior probabilities returned by the model as probabilities of evolutionary relatedness. Such probabilities are then fed as affinities into the spectral clustering algorithm described above. Note that the training of the logistic regression model needs to be done only once. Also we point out that those proteins which were used during this phase were not used later for testing the performance of the clustering algorithm. In order to choose the total number of clusters K we analyze the eigenspectrum of L. Particularly, we compute the eigengaps which are the ratios of successive eigenvalues. We then apply a threshold on the eigengaps to select the number of clusters: K min{i : i / i 1 } , where is predefined. While this mode of selecting K is not perfect, we however found this method adequate for the protein datasets that we considered. Figure 1 shows the results obtained by our spectral clustering algorithm on a dataset of proteins from 6 different superfamilies and we compare them with the results obtained with three other popular methods from the literature: GeneRAGE (our implementation) (Enright et al., 2000), Hierarchical Clustering and TribeMCL (Enright et al. 2002). The spectral clustering method clearly outperforms the other three. First of all, it detects a number of clusters which is close to the correct number of super-families, since it detects 8 clusters; at the same time, our implementation of GeneRAGE detects 152 clusters, the hierarchical clustering detects 205 clusters, and TribeMCL 50 (with the inflation parameter set to 1.58). Only the 30 most populated clusters are shown in the figure. The better quality of the clustering is quantified by the Fmeasure: for the spectral clustering it is equal to 0.8132; our implementation of GeneRAGE has a score of 0.4739, the hierarchical clustering 0.2609 and TribeMCL 0.3173.
GeneRAGE
TribeMCL
Hierarchical Clustering
Spectral Clustering
Figure 1. Clustering results on the 507 dataset with our implementation of GeneRAGE (Top Left), Hierarchical Clustering (Top Right), TribeMCL (Bottom Left), and our Spectral Clustering algorithm (Bottom Right). The figures show only the top 30 most populated clusters returned by each algorithm and 8 for the spectral clustering, since it returned only 8 clusters. Each row in the figure corresponds to a different cluster. Short (green) bars represent the assignment of each protein sequence to a cluster. Each protein has one of these bars in only one of the rows (clusters); the presence of the bar means that the protein is assigned to that cluster. Boundaries between superfamilies are shown by vertical thick (red) lines; boundaries between families within each super-family are shown by dotted (blue) lines. The dataset has 6 superfamilies, orderly from left to right: Globin-like (88), EF-hand (83), Cupredoxins (78), (Trans)glycosidases (83), Thioredoxin-like (81), Membrane all-alpha (94).
Looking at Figure 1 we can see that GeneRAGE and the Hierarchical clustering algorithms are sometimes able to detect families, but they are inferior to our spectral clustering algorithm in terms of being able to group separate families into superfamilies. We have obtained similar results on every subset of SCOP on which we tried our algorithm. On average, the value of the F-measure given by our method is 84% better than hierarchical clustering, 72% better than TribeMCL and 34% better than our implementation of GeneRAGE. 3. Spectral clustering of protein sequences using PSI-BLAST E-values As we stated in the introduction, the BLAST E-value is a very noisy measure of evolutionary relatedness. Clearly, a distance measure that is less noisy would give better results. Here we introduce a new clustering method that uses as distance between sequences the E-values obtained from PSI-BLAST -- a sequenceprofile method for detecting weak similarities between related protein sequences (Altschul et al., 1997).
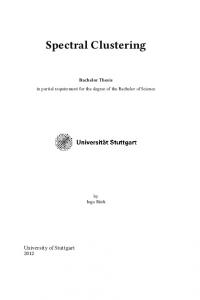
Motif or profile based sequence search methods like PSI-BLAST are much more sensitive than pairwise comparison methods like BLAST at detecting evolutionarily distant relationships. PSI-BLAST automatically combines statistically significant alignments produced by BLAST into a position-specific scoring matrix and searches the database using this matrix to detect weak but biologically relevant sequence similarities. Unlike BLAST, the score for aligning a letter with a pattern position is given by the matrix itself rather than using a substitution matrix. For proteins, a query of length L and a substitution matrix of dimension 20x20 are replaced by a position-specific matrix of dimension Lx20. Position-specific score matrices result in improved estimation of the probabilities with which amino acids occur at various pattern positions and also the relatively precise definition of functionally important motif boundaries. The matrix that PSI-BLAST generates has precisely equal length to that of the query sequence although like BLAST it seeks local alignments for sequence-sequence comparisons. The statistics shown earlier for optimal local alignments of two sequences implemented in BLAST also applies to alignments involving a profile and a sequence. Thus we can use PSI-BLAST E-values the same way we used BLAST E-values as a distance measure. We have reason to believe that PSI-BLAST E-values are less noisy measure of evolutionary relatedness, since they capture sequence divergence much better than pairwise methods by representing a family of related sequences as a profile. PSI-BLAST constructs a profile (or position specific scoring matrix, PSSM) automatically from a multiple alignment of the highest scoring hits in an initial BLAST search. The PSSM is generated by calculating position-specific scores for each position in the alignment. Highly conserved positions receive high scores and weakly conserved positions receive scores near zero. The profile is used to perform further BLAST searches and the result of each iteration is used to refine the profile. This iterative searching strategy results in increased sensitivity as the sequence features in the form of motifs that define a family is captured. Thus, a profile generated from a sequence represents the essence of a family much better than a simple pairwise comparison. To demonstrate that this is the case we show here the plot of E-values for BLAST and PSI-BLAST for the dataset of 507 proteins that we saw earlier --- we chose to stop at the fourth iteration when creating PSIBLAST profiles.
Figure 2. A pictorial representation of the distance matrices between the 507 protein sequences of figure 1. Each matrix has size 507x507 and position (i,j) contains the distance between sequences i and j. Orderly, in the columns and rows we have: Globin-like (88), EF-hand (83), Cupredoxins (78), (Trans)glycosidases (83), Thioredoxin-like (81), Membrane all-alpha (94). In the diagram each cell is represented by a square, whose colour relates to its value: the smaller the value, the lighter the colour. Thick red lines separate superfamilies. (Left) the matrix of the BLAST E-values. (Right) the matrix of the PSI-BLAST E–values after 4 iterations.
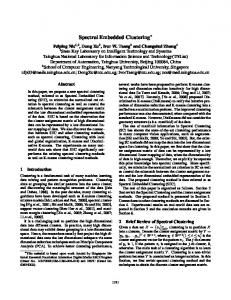
We have modified our spectral method in order to use PSI-BLAST E-values and we have compared the results obtained with the ones obtained when using BLAST E-values. Figure 3 shows the results obtained on a dataset of 535 proteins, belonging to 8 superfamilies. Both methods returned 15 clusters. However, the
value of the F-measure was 0.855 for the method that used PSI-BLAST E-values and 0.782 for the earlier method that used BLAST E-values. The better quality of the clusters can also be appreciated visually in the figure. Notice how the superfamilies Concanavalin A-like lectins/glucanases (2nd column) and Ubiquitinlike (last column) that have 21 and 6 families, respectively, in them and a lot of the members are too divergent to be picked up by even PSI-BLAST and thus appear as individual proteins or very small clusters.
Figure 3. Clustering results on the 535 dataset with our original Spectral Clustering algorithm (Left) that uses BLAST E-values, and our new Spectral Clustering algorithm (Right) that uses PSI-BLAST E-values (4 iterations). The figures shows the results of both algorithms for k=15. The dataset has 8 superfamilies, orderly from left to right: Ferritin-like (46), Concanavalin A-like lectins/glucanases (102), Trypsin-like serine proteases (90), Lipocalins (58), FAD/NAD(P)-binding domain (84), PLPdependent transferases (67), Lyzozyme-like (39), and Ubiquitin-like (49).
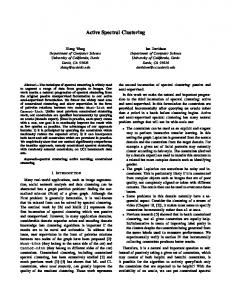
Finally, we performed a second set of experiments on four different datasets which were generated from SCOP by adding random superfamilies to a dataset until it contained at least 500 proteins. To ensure a fair selection of superfamilies, these were chosen by selecting a random protein domain from SCOP and then including all members of the corresponding superfamily in the dataset. The number of superfamilies in the datasets thus obtained varied between 13 and 23. On each of these datasets we tried our new spectral method that uses PSI-BLAST E-values, our original spectral method using BLAST E-values, the Hierarchical Clustering, TribeMCL, and our implementation of GeneRAGE. Figure 4 summarizes the results by showing the F-measure obtained on each of the 4 datasets for each of the five methods. Both spectral methods outperformed the other three methods. However, we see that using PSI-BLAST E-values we consistently obtain better results than using BLAST E-values.
0.8 0.7 0.6 0.5 0.4 0.3 0.2 0.1 0
1
2
3
4
Figure 4. F-measure of the cluster quality on the 4 randomly drawn subsets from SCOP. For each dataset the bars represent the performance respectively, from left to right: our new spectral method using PSI-BLAST E-values with 4 iterations (dark blue); our original spectral method using BLAST E-values (light blue); Hierarchical Clustering (green); TribeMCL with inflation parameter set to 1.60 (orange); our implementation of GeneRAGE (dark red).
4. Conclusion Groups of protein sequences, associated with a given function, may be highly conserved in terms of sequence similarity. Other sequence superfamilies may be more diverse and there may exist weak sequence similarities with other members having the same broad functional role. Capturing and analyzing these relationships in protein space is a difficult problem. We have shown that our spectral clustering in combination with a distance measure obtained from a sequence-profile method like PSI-BLAST provides better clustering than using a distance measure obtained from pairwise methods like BLAST or other local methods --- in our experiments, the F-measure (which provides a quantitative measure on cluster quality) was consistently better. So far we have not addressed the problem of multi-domain sequences. Also we need to see how our spectral method scales to datasets that are much larger in size.
5. References S.F. Altschul, T.L. Madden, A.A. Schaffer, J. Zhang, Z. Zhang, W. Miller, D.J. Lipman. Gapped BLAST and PSIBLAST: a new generation of protein database search programs. Nucleic Acids Res. 1997 Sep 1;25(17):3389-402. S.F. Altschul, W. Gish, W. Miller, E.W. Myers, D.J. Lipman. Basic local alignment search tool. J Mol Biol. 1990 Oct 5;215(3):403-10. A. J. Enright, C. A. Ouzounis GeneRAGE: a robust algorithm for sequence clustering and domain detection. Bioinformatics 2000 May;16(5):451-7. A. J. Enright, S. Van Dongen and C. A. Ouzounis. An efficient algorithm for large-scale detection of protein families. Nucleic Acids Res 2002 30(7):1575-1584. B.S. Everitt Cluster Analysis (3rd ed.) London: Edward Arnold, 1993.
L. Lo Conte, S.E. Brenner, T.J.P. Hubbard, C. Chothia, A. Murzin A. SCOP database in 2002: refinements accommodate structural genomics. Nucl. Acid Res. 2002 30(1), 264-267. M. Meila, J. Shi A random walks view of spectral segmentation. Proc. International Workshop on AI and Statistics, AISTATS, 2001. A.G. Murzin, S. E. Brenner, T. Hubbard, C. Chothia SCOP: a structural classification of proteins database for the investigation of sequences and structures J Mol Biol 1995 Apr 7;247(4):536-40. A. Ng, M. Jordan and Y. Weiss On Spectral Clustering: analysis and an algorithm NIPS 14, Advances in Neural Information Processing Systems 14, 2001, T. G. Dietterich and S. Becker and Z. Ghahramani eds., A. Paccanaro, J. A. Casbon, M. A. S. Saqi Spectral clustering of protein sequences Nucleic Acids Research, 2006, Vol. 34, No. 5, 1571–1580.