Using Spectral Clustering for Finding Students’ Using Spectral Clustering for Finding Students’ Patterns of Behavior in Social Networks Patterns of Behavior in Social Networks Gamila Obadi, Pavla Dr´ aˇzdilov´a, Jan Martinoviˇc, Kateˇrina Slaninov´ a and V´ aˇsel Gamila Obadi, Pavla Dr´ aˇzdilov´ aa,clav Jan Sn´ Martinoviˇ c, Kateˇrina Slaninov´a, and V´ aclav Sn´ aˇsel
ˇ - Technical University of Ostrava, FEECS, VSB ˇ Department of Computer Science, VSB - Technical University of Ostrava, FEECS, Department of Computer Science Czech Republic Czech Republic 17. listopadu 15,Ostrava, 708 33 Ostrava-Poruba,
[email protected],
[email protected]
Abstract. The high dimensionality of the data generated by social networks has been a big challenge for researchers. In order to solve the problems associated with this phenomenon, a number of methods and techniques were developed. Spectral clustering is a data mining method used in many applications; in this paper we used this method to find students’ behavioral patterns performed in an elearning system. In addition, a software was introduced to allow the user (tutor or researcher) to define the data dimensions and input values to obtain appropriate graphs with behavioral pattens that meet his/her needs. Behavioral patterns were compared with students’ study performance and evaluation with relation to their possible usage in collaborative learning.
1
Introduction
Social networks have been attracting millions of users, where each user is represented by a huge number of variables. This popularity leads to very high dimensional data, often with sparse data sets. Researchers, dealing with such high-dimensional data collections, face many challenges due to the difficulties with visualization of these data sets and the vast increase in their computing time or memory complexity. Dimension reduction is the process of reducing the number of variables describing the data set. This process is possible, because many of the variables are correlated with each other and many of them have a variation smaller than the measurement noise and thus will be irrelevant. Researchers approach these high dimensional data sets either by finding a subset of the original variables or by mapping the multidimensional space into a space of fewer dimensions. In this work the authors are interested in finding the patterns of behavior of elearning students and the relationship between them and students academic performance. To solve the problem of higher dimensionality, spectral clustering was used. Besides, a software was developed to allow the user (researcher or elearning tutor) to define the data dimensions and input values for graph generation that meet his/her needs.
J. Pokorn´ y, V. Sn´ aˇsel, K. Richta (Eds.): Dateso 2010, pp. 118–130, ISBN 978-80-7378-116-3.
Using Spectral Clustering for Finding Students’ Patterns of Behavior . . .
2
119
Finding Patterns in Social Networks
Data mining is the process of extracting patterns from data. Patterns can be defined as structures that make statements only about restricted regions of the space spanned by the variables of the data [17]. These structures might represent Web pages that are all about the same topic or people that socialize together. The discovery of pattern structures in complex networks is an essential and challenging task in many disciplines, including business, social science, engineering, and biology. Therefore researchers have a great interest in this subject and have been approached it differently through data mining methods, social network analysis, etc. This diversity is not limited to the techniques used to implement this task, but it is also applied to its applications. The authors of [18] provided an overview about the usage of frequent pattern mining techniques for discovering different types of patterns in a Web logs. While in [22] the authors applied different clustering algorithm to detect crimes patterns, and some data mining tools were used in [1] to solve the intrusion detection problem. Social Network Analysis (SNA) is another common method for patterns discovery and has been used in previous studies. The authors in [21] used some SNA metrics to study the interaction patterns of students in Elearning online communities. Discovering patterns from email datasets is one of the topics researches are interested in as well. In [8] the authors described a multi-stage spam filter based on trust and reputation for detecting the spam behavior of the call in Voice over Internet Protocol (VoIP). Pattern discovery is also used in the investigation and control of an infectious disease epidemic. A study was conducted to explore the movements of cattle and sheep during the initial phase of the 2001 Foot and mouth disease (FMD) outbreak in UK to describe and visualize the network of these movements using social network analysis techniques [25]. Educational data mining (EDM) is a discipline witch concentrates on developing methods for exploring the data that come from an educational context, and use these methods to improve the quality of learning. To achieve this objective a number of studies have been conducted where researchers applied different data mining techniques to discover the factors that affect the academic performance of students. The authors in [4] studied the navigational behavior of the students to identify the patterns of high performance, in [10] were used decision trees to Predict Students Drop Out and in [3] authors investigated the Cheating behavior in Online Student Assessment. Romero and Ventura classified educational data mining methods into two categories - Statistics and visualization, and Web mining (Clustering, classification, outliers detection, Association rule mining and sequential pattern mining, Text mining) [28]. Clustering is a useful method to investigate students’ patterns of behavior, a number of different clustering algorithms have been used to detect online students’ patterns such as the TwoStep algorithm [4], the model-based clustering [16], the K-means algorithm [26, 27], etc. In this study, the authors aim to apply spectral clustering to investigate the correlation between the similarity in students behavior and their grades. Even though spectral clustering has been applied to solve many problems in signal processing, bioinformatics and infor-
120
G. Obadi, P. Dr´ aˇzdilov´ a, J. Martinoviˇc, K. Slaninov´ a, V. Sn´ aˇsel
mation retrieval, in the field of educational data mining this method has not exploited widely yet.
3
Spectral Clustering
Clustering is the process of organizing objects into collections whose members are similar in some sense. A cluster is therefore a collection of objects which are similar to each other and are dissimilar to the objects belonging to other clusters. The task of finding clusters has been the focus of research in machine learning, information retrieval, social network analysis, etc. Spectral clustering algorithms cluster a set of data points using the similarity matrix that is derived from the data. It uses the second eigenvector of a graph’s Laplacian to define a semi-optimal cut of a weighted undirected graph in which nodes correspond to objects and edges represent the distance (similarity) between the objects. The idea of finding partitions of graphs by using the eigenvectors of their Laplacians can be traced back to 1970s to Fiedler [14], Donath [12]. Fiedler associated the second-smallest eigenvalue of the Laplacian of a graph with its connectivity and suggested partitioning by splitting vertices according to their value in the corresponding eigenvector. Thus, this eigenvalue is called Fiedler value and the corresponding vector is called the Fiedler vector. According to Fiedler, the graphs’s Laplacian has the following spectral properties: All eigenvalues are non-negative. If the graph is divided into g components, there are g zero eigenvalues. Eigenvector components act like coordinates to represent nodes in space. The Fiedler vector has both positive and negative components, their sum must be zero. – If the network is connected, but there are two groups of nodes weakly linked to each other, they can be identified from Fiedler vector. Where the positive components are assigned to one group and the negative components are assigned to the other. – – – –
Spectral clustering has been studied and applied to solve many problems. In [19] Kannan et al. developed a natural bicriteria measure for assessing the quality of clustering. Cheng et al. in [7] showed how to use spectral algorithm studied in [19]. A practical implementation of the clustering algorithm is presented in [6]. In [11] Ding et al. proposed a new graph partition method based on the min-max clustering principle: the similarity between two subgraphs (cut set) is minimized, while the similarity within each subgraph (summation of similarity between all pairs of nodes within a subgraph) is maximized. Shi and Malik [30] treated image segmentation as a graph partitioning problem and proposed a global criterion, the normalized cut, for segmenting this graph. They showed that an efficient computational technique based on a generalized eigenvalue problem can be used to optimize this criterion. A recursive algorithm was used in [9], Dasgupta et al. analyzed the second eigenvector technique of spectral partitioning on the planted
Using Spectral Clustering for Finding Students’ Patterns of Behavior . . .
121
partition random graph model, by constructing a recursive algorithm. Spectral clustering was used in [5] for extracting communities from the Enron graph. 3.1
Algorithm for Graph Partitioning Using Fiedler Vector
1. Find all connected components in graph. 2. Create Laplacian matrix of component L = D − P 0 . P 0 = P − I, where P is the adjacency matrix P with weights, I is unity matrix and D is the diagonal matrix with dii = j p0ij . 3. Find the eigenvector corresponding to second smallest eigenvalue of L. 4. Divide the component based on the sorted eigenvector. 5. Recurse on the obtained components (back to the step 2).
4
Social Network Analysis
Social network analysis concentrates on the importance of the relationships between the nodes. It maps and measures formal and informal relationships to understand what facilitates or obstructs the knowledge flows that connect the interacting objects, e.g., who knows whom, and who shares what information and knowledge with whom and by which communication media. The results of social network analysis might be used to: – Identify the individuals or groups who play central roles. – Distinguish bottlenecks (central nodes that provide the only connection between different parts of a network), as well as isolated individuals and groups. – Strengthen the efficiency and effectiveness of existing, formal communication channels. – Improve innovation and learning. – Refine strategies. Centrality is an important concept in social network analysis. Borgatti and Everett [2] developed a unified framework for the measurement of centrality. All measures of centrality assess a node’s involvement in the walk structure of a network. Measures vary along four key dimensions: type of nodal involvement assessed, type of walk considered, property of walk assessed, and choice of summary measure. Degree centrality can be used for identifying central roles of the object. Actors who have more ties to other actors may be in advantageous positions. Degree centrality is measured as the number of edges that involve a given node [15]. A node with high degree centrality maintains contacts with numerous other network nodes. Such nodes can be seen as popular nodes with large numbers of links to others. A central node occupies a structural position that may act as a way for information exchange. In contrast, peripheral nodes maintain few or no relations and thus are located at the margins of the network. Degree centrality for a given node pi is calculated as:
122
G. Obadi, P. Dr´ aˇzdilov´ a, J. Martinoviˇc, K. Slaninov´ a, V. Sn´ aˇsel
C D (pi ) =
N X
a(pi , pk )
(1)
k=1
where N is the number of nodes in the network, a(pi , pk ) = 1 if a edge exists between pi and pk and i 6= k else a(pi , pk ) = 0.
Katz [20] recognized that an individual’s centrality depends not only on how many others it is connected to (it’s degree), but also on their centrality. He measured centrality of a node by the total number of paths linking it to other nodes in a network, exponentially weighted by the length of the path.
Closeness centrality measures the reciprocal of the mean geodesic distance d(pi , pk ), which is the shortest path between a node pi and all other reachable nodes [15]. Closeness centrality can be regarded as a measure of how long it will take information to spread from a given node to other nodes in the network [23]. Closeness centrality for a given node is calculated as:
C C (pi ) = PN
N −1
k=1
d(pi , pk )
(2)
where N is the number of nodes in the network and i 6= k.
In [24] authors combined existing methods on calculating exact values and approximate values of closeness centrality and presented new algorithms to rank the top-k vertices with the highest closeness centrality. Betweenness centrality measures the extent to which a node lies on the paths linking other nodes [15]. Betweenness centrality can be regarded as a measure of the extent to which a node has control over information flowing between others [23]. A node with a high betweenness centrality has a capacity to facilitate interactions between the nodes that it links. It can be regarded as how well a node can facilitate communication to other nodes in the network. Betweenness centrality is calculated as:
C B (pi ) =
j−1 N X X gjk (pi ) j=1 k
gjk
(3)
where gjk is the total number of geodesic paths linking pj and pk , and gjk (pi ) is the number of those geodesic paths that include pi . Freeman’s centrality metrics are based on analysis of a complete and bounded network which is sometimes referred to as a sociocentric network. These metrics become difficult to evaluate in networks with a large node population, because they require complete knowledge of the network topology.
Using Spectral Clustering for Finding Students’ Patterns of Behavior . . .
5 5.1
123
Case Study: Finding Students’ Patterns of Behavior in LMS Moodle Data Set
A case study is conducted in order to find and visualize the patterns of behavior in a large and sparse social network. The analyzed data collections are stored in the Learning Management System (LMS) Moodle logs used to support eLearning education at Silesian University, Czech Republic. The logs consist of records of all events performed by Moodle’s users such as communication in forums and chats, reading study materials or blogs, taking tests or quizzes etc. The users of this system (students, tutors, and administrators) are members of a community which aims to provide the appropriate services and guidance to its members, to make them achieve their objectives successfully. The authors are interested in studying students’ activities in the Moodle system and in discovering the latent social network created from groups of students with similar patterns of behavior. Data anonymisation was implemented during the data preprocessing phase, and the study was only limited to investigating the events performed by students. Let us define a set of students s ∈ S, set of courses c ∈ C and term Event as a combination of Event prefix p ∈ P (e.g. course view, resource view, blog view, quiz attempt) and a course c. An event then represents an action performed by student s ∈ S in certain course c in LMS. On the basis of this definition, we have obtained Set of Events ei ∈ E, which is represent by pairs ei = (pj , ck ), j ∈ {1, . . . |P |}, k ∈ {1, . . . |C|} ordered by TimeStamp. After that we obtain set of activities aj ∈ A. Activity is a sequence of events aj = h e1 , e2 , . . . , en i, performed by certain student s in a certain course c during the optimal time period. In our previous experiments we found the 30 minutes time period to be the most effective time interval. The findings showed that in shorter time periods (5 minutes) students were performing only non-study activities, and in longer periods there was not a significant activity difference (that means activities were very similar). For detailed information see our previous work [13]. Similar conclusion was presented by Zorrilla et al. in [31]. Two matrices were obtained to represent the data: the Student matrix T (|S| × |A|), where row (t1 , t2 , . . . , t|A| ) represents a subset of activities performed by the student in the Moodle system, and the Matrix of similarity P (|S| × |S|), which is derived from matrix T , and defines students’ relationships using their similar activities. The similarity between two students (vectors) was defined by the Cosine measure [29]. Pn tik tjk (4) pi,j = pP k=1qP n n 2 2 k=1 tik k=1 tjk Matrices T and P are very large and sparse because of the large number of activities performed by students. Therefore the visualization of the latent ties between students with similar behavior was very hard and unfeasible. One of
124
G. Obadi, P. Dr´ aˇzdilov´ a, J. Martinoviˇc, K. Slaninov´ a, V. Sn´ aˇsel
our goals was the reduction of that high number of activities using specification of smaller groups with characteristic activities. Spectral clustering was used to divide the collection of students into a number of smaller groups. The spectral clustering method was then extended by further analysis of the obtained clusters. For each cluster a level was set to obtain smaller sets of objects in cluster. The most frequent activities in each cluster can describe the cluster with more details. We are interested in typical activities for each cluster. Activities, which are in all clusters, and activities which are less frequent can be omitted. Merging the reduced activity sets in each cluster defines set of typical activities for all objects in the selected group. 5.2
Experiment
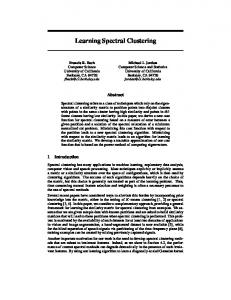
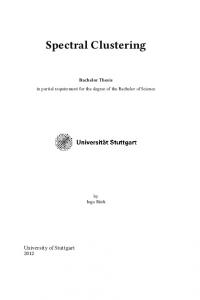
The main objective of this experiment is to investigate the relationship between the similarity in students’ behavior and their grades. For this purpose has been developed specialized software, which allows the user (researcher or tutor) to define the values of input data that meets his/her needs. Input data definition is based on data collection filtering and setting of parameter time period. The user can select groups of students by Course, Event Prefix (which represents a set of Events e), Step (time period) and level of similarity. To test the behavior of students accessing the resources which are assigned for the different courses, a course called MicroEconomy with 307 students and a level of similarity = 0.5 was analyzed. The following figures illustrate the results of the experiment. Figure 1 represents the graph before clustering, and Figure 2 illustrates the different clusters obtained (colored nodes represent different grades; yellow is A, green yellow is B, green is C, blue is D, red is E, black is F and gray is without the grade).
Fig. 1. Graph of Students’ Activities when Accessing the Course Resources
Obviously, the graphs show that these clusters consist of students with different distribution of grades.
Using Spectral Clustering for Finding Students’ Patterns of Behavior . . .
125
Fig. 2. Graph of Student’s Clusters when Accessing the Course Resources
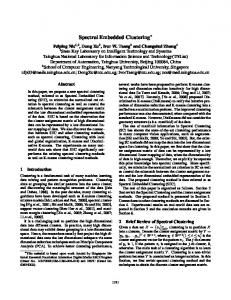
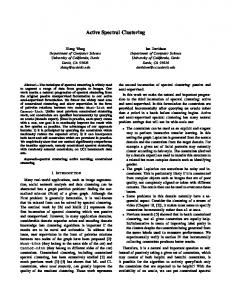
The same procedure was applied to the same course to explore students’ behavioral patterns in the forum and again a number of clusters were detected with different grades in each one of them, see (Fig 3 and Fig 4).
Fig. 3. Graph of Students’ Activities in the Forum
126
G. Obadi, P. Dr´ aˇzdilov´ a, J. Martinoviˇc, K. Slaninov´ a, V. Sn´ aˇsel
Fig. 4. Graph of Students’ Clusters in the Forum
The results of this experiment showed that the similarity in students behavior does not have significant effect on their final grades. It is caused by several limitations, more detailed description is presented in conclusion. Another test was applied to study the correlation between students’ position in the network (using different types of centrality) and their academic performance. Findings from this experiment can be helpful for course tutors. The tutor can recommend to students suitable study behavior, or contact to the student with appropriate study behavior.
Fig. 5. Histogram of the Degree Centrality for One Course and Clustering Level 40
Using Spectral Clustering for Finding Students’ Patterns of Behavior . . .
127
The findings of the study showed that both students with high academic performance and students with educational difficulties were isolated, while students with average academic performance were highly connected, see (Fig 5). This group of students participates actively in the course forum, but maybe they discuss the issues that are less important to their academic progress. This is one of the limitations of the data extracted from Moodle log files. The log files record only request transactions but they do not record the type of content on each page (especially topics discussed in forum).
Fig. 6. Histogram of the Betweenness Centrality for One Course and Clustering Level 40
Fig. 7. Histogram of the Closeness Centrality for One Course and Clustering Level 40
6
Conclusion
In this study was presented an application of spectral clustering method to find the patterns of behavior of groups of students enrolled in the elearning system. For easier generation of the graphs described students’ behavioral patterns in
128
G. Obadi, P. Dr´ aˇzdilov´ a, J. Martinoviˇc, K. Slaninov´ a, V. Sn´ aˇsel
elearning system, with requires setting of number of input variables for clustering method or setting of the dimensions (selection of the appropriate course or students’ activities in the course provided in elearning system), was developed specialized software. Moreover, authors attempted to find relations between the behavioral study patterns and the students’ study performance in the selected course. The findings of the experiment did not show any relation between the similarity in students’ behavior and their grades as well as relation between students’ positions in generated network and their academic performance. We found significant clusters of similar behavior, but with different distribution of grades. Students with average values of grades were at the center of the network. During the implementation of this study we encountered a number of limitations. The first limitation was the small size and homogeneity of the data set, the second was that all events were given the same importance - the experiment showed that clustering could be better if we assigned different weights to the events according to their significance to the course. Nevertheless, developed software can be successfully used as a supporting tool for tutors leading groups of students in elearning systems, to discover significant behavioral patterns of their students. These information can be useful especially in large groups of students were are applied methods of collaborative learning. In our future work, we intend to apply a thorough analysis on larger data collections to explore significant patterns of behavior, and to find other factors that might affect students’ grades.
7
Acknowledgement
We acknowledge the support of project SP/2010196 Machine Intelligence.
References 1. D. Barbar, J. Couto, S. Jajodia, L. Popyack, and N. Wu. Adam: Detecting intrusions by data mining. In In Proceedings of the IEEE Workshop on Information Assurance and Security, pages 11–16, 2001. 2. S. Borgatti and M. Everett. A graph-theoretic perspective on centrality. Social Networks, 28(4):466–484, October 2006. 3. G. N. Burlak, J.-A. Hernandez, A. Ochoa, and J. Munoz. The use of data mining to determine cheating in online student assessment. In CERMA ’06: Proceedings of the Electronics, Robotics and Automotive Mechanics Conference, pages 161–166, Washington, DC, USA, 2006. IEEE Computer Society. 4. J. M. Carbo, E. Mor, and J. Minguillon. User navigational behavior in e- learning virtual environments. In WI ’05: Proceedings of the 2005 IEEE/WIC/ACM International Conference on Web Intelligence, pages 243–249, Washington, DC, USA, 2005. IEEE Computer Society. 5. A. Chapanond, M. S. Krishnamoorthy, and B. Yener. Graph theoretic and spectral analysis of enron email data. Comput. Math. Organ. Theory, 11(3):265–281, 2005. 6. D. Cheng, R. Kannan, S. Vempala, and G. Wang. On a recursive spectral algorithm for clustering from pairwise similarities. Technical report, 2003. 7. D. Cheng, R. Kannan, S. Vempala, and G. Wang. A divide-and-merge methodology for clustering. ACM Trans. Database Syst., 31(4):1499–1525, December 2006.
Using Spectral Clustering for Finding Students’ Patterns of Behavior . . .
129
8. R. Dantu and P. Kolan. Detecting spam in voip networks. In SRUTI’05: Proceedings of the Steps to Reducing Unwanted Traffic on the Internet on Steps to Reducing Unwanted Traffic on the Internet Workshop, pages 5–5, Berkeley, CA, USA, 2005. USENIX Association. 9. A. Dasgupta, J. Hopcroft, R. Kannan, and P. Mitra. Spectral clustering by recursive partitioning. In ESA’06: Proceedings of the 14th conference on Annual European Symposium, pages 256–267. Springer-Verlag, 2006. 10. G. Dekker, M. Pechenizkiy, and J. Vleeshouwersu. Predicting students drop out: A case study. In In Proceedings of Educational Data Mining 2009, pages 41–50, 2009. 11. C. H. Q. Ding, X. He, H. Zha, M. Gu, and H. D. Simon. A min-max cut algorithm for graph partitioning and data clustering. In ICDM ’01: Proceedings of the 2001 IEEE International Conference on Data Mining, pages 107–114, Washington, DC, USA, 2001. IEEE Computer Society. 12. W. E. Donath and A. J. Hoffman. Lower bounds for the partitioning of graphs. IBM J. Res. Dev., 17(5):420–425, 1973. 13. P. Dr´ azdilov´ a, K. Slaninov´ a, J. Martinovic, G. Obadi, and V. Sn´ asel. Creation of students’ activities from learning management system and their analysis. In CASoN, pages 155–160, 2009. 14. M. Fiedler. Algebraic connectivity of graphs. Czechoslovak Mathematical Journal, 23:298–305, 1973. 15. L. C. Freeman. Centrality in social networks: Conceptual clarification. Social Networks, 1(3):215–239, 1979. 16. E. Gaudioso, M. Montero, L. Talavera, and F. H. del Olmo. Supporting teachers in collaborative student modeling: A framework and an implementation. Expert Systems with Applications, 36(2, Part 1):2260 – 2265, 2009. 17. D. J. Hand, P. Smyth, and H. Mannila. Principles of data mining. MIT Press, Cambridge, MA, USA, 2001. 18. R. Iv´ ancsy and I. Vajk. Frequent pattern mining in web log data. Acta Polytechnica Hungarica, 3(1), 2006. 19. R. Kannan, S. Vempala, and A. Vetta. On clusterings: Good, bad and spectral. J. ACM, 51(3):497–515, May 2004. 20. L. Katz. A new status index derived from sociometric analysis. Psychometrika, 18:39–43, 1953. 21. A. Laghos and P. Zaphiris. Sociology of student-centred e-learning communities: A network analysis. In IADIS international conference, Dublin, Ireland, July 2006. e-Society. 22. S. V. Nath. Crime pattern detection using data mining. In WI-IATW ’06: Proceedings of the 2006 IEEE/WIC/ACM international conference on Web Intelligence and Intelligent Agent Technology, pages 41–44, Washington, DC, USA, 2006. IEEE Computer Society. 23. M. Newman. A measure of betweenness centrality based on random walks. Social Networks, 27(1):39–54, January 2005. 24. K. Okamoto, W. Chen, and X.-Y. Li. Ranking of closeness centrality for largescale social networks. In FAW ’08: Proceedings of the 2nd annual international workshop on Frontiers in Algorithmics, pages 186–195, Berlin, Heidelberg, 2008. Springer-Verlag. 25. A. Ortiz-Pelaez, D. Pfeiffer, R. Soares-Magalhes, and F. Guitian. Use of social network analysis to characterize the pattern of animal movements in the initial phases of the 2001 foot and mouth disease (fmd) epidemic in the uk. Preventive Veterinary Medicine, 76(1-2):40 – 55, 2006.
130
G. Obadi, P. Dr´ aˇzdilov´ a, J. Martinoviˇc, K. Slaninov´ a, V. Sn´ aˇsel
26. D. Perera, J. Kay, I. Koprinska, K. Yacef, and O. R. Za¨ıane. Clustering and sequential pattern mining of online collaborative learning data. IEEE Trans. on Knowl. and Data Eng., 21(6):759–772, 2009. 27. S. Preidys and L. Sakalauskas. Analysis of students study activities in virtual learning environments using data mining methods. Technological and economic development of economy, 16(1):94–108, 2010. 28. C. Romero and S. Ventura. Educational data mining: A survey from 1995 to 2005. Expert Systems with Applications, 33(1):135 – 146, 2007. 29. G. Salton and C. Buckley. Term-weighting approaches in automatic text retrieval. Information Processing and Management, 24(5):513–523, 1988. 30. J. Shi and J. Malik. Normalized cuts and image segmentation. IEEE Transactions on Pattern Analysis and Machine Intelligence, 22:888–905, 1997. 31. M. Zorrilla, E. Menasalvas, D. Marn, E. Mora, and J. Segovia. Computer Aided Systems Theory EUROCAST 2005, volume 3643/2005 of Lecture Notes in Computer Science, chapter Web Usage Mining Project for Improving Web-Based Learning Sites. Springer Berlin / Heidelberg, 2005.