ABSTRACT. A novel speech segregation method using a microphone ar- ray with multiple directivities is proposed and applied to speech recognition under ...
➠
➡ SPEECH ENHANCEMENT BASED ON MULTIPLE DIRECTIVITY PATTERNS USING A MICROPHONE ARRAY Toshiyuki Sekiya and Tetsunori Kobayashi Department of Computer Science, Waseda University 3-4-1 Okubo, Shinjuku-ku, Tokyo 169-8555, Japan {sekiya,koba}@tk.elec.waseda.ac.jp ABSTRACT A novel speech segregation method using a microphone array with multiple directivities is proposed and applied to speech recognition under existence of disturbance speech. Conventional microphone array techniques use only single directivity of their own. It is very difficult for this kind of array technique to remove the influence of the disturbance. In our method, redundant simultaneous equations of the amplitudes of sound sources are generated by using these multiple directivities. The solution of these equations gives good estimates of disturbances. The spectral subtraction is applied with these estimates of disturbances, and the perfect enhancement of target speech is performed. The experimental results of double talk recognition with 20 K vocabulary show that the proposed enhancement technique is effective to achieve 45 % error reduction. 1. INTRODUCTION In this paper, we propose a speech segregation method using a microphone array with multiple directivities, whose number exceeds the sound sources. Hands-free speech recognition has a wide range of applications, such as dictation systems of meeting, group conversation systems such as humanoid robots and car-navigation systems. Hands-free speech recognition in a real environment requires high performance when several people talk simultaneously. Techniques of speech enhancement and noise suppression are indispensable. Many efforts have been made to solve this problem [1][2][3][4]. A microphone array is a very effective method to realize speech enhancement and noise suppression, for example the Delay and Sum (DS) array [3] and the Directionally Constrained Minimization of Power (DCMP) adaptive array [4]. However these techniques have several problems. As for the beam-forming (DS array), to achieve noise suppression in low frequency bands, a large number of microphones are required. As for the null-steering (DCMP array), when there is an error in sound source localization, the performance is
0-7803-8484-9/04/$20.00 ©2004 IEEE
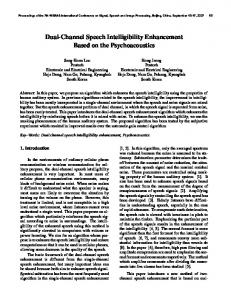
seriously hindered. The changes in the environment, particularly the transform function also seriously damage the performance. In our method proposed here, the array produces multiple directivity patterns, whose number exceeds the sound sources. The multiple outputs of the array are analyzed by short time Fourier transformation (STFT) with rather long window. Using these short time spectra, the redundant simultaneous equations of the amplitudes of sound sources are obtained. By solving them, the target speech and the disturbance can be separated. The long window adopted here contributes to simplify the equations because it enables to ignore the correlation between target and disturbance, but affect time resolution. Target speech obtained here cannot be used for speech recognition directly because of their bad time resolution. So we use the estimated disturbance to enhance the target speech. Select one output from the array and apply STFT with short window. The spectra obtained here are applied spectral subtraction (SS) using estimated disturbance in the former stage. The enhanced speech involves some distortion, such as musical noise, but the disturbance can be almost completely removed. In the following section, the algorithm of the proposed method is described in detail. In section 3, the conditions and results of the continuous speech recognition are described. We give the conclusions in section 4. 2. PROPOSED METHOD 2.1. Formulation of the sound field Figure. 1 shows the diagram of the proposed method. We assume the environment where D sound sources exist and the sound field is observed by M microphones. We define the input vector x(k, t) as STFT of the input signal. x(k, t) = [x1 (k, t), · · · , xM (k, t)]T xm (k, t) denotes the STFT coefficient at microphone m, discrete frequency k, and frame t. Using the transform func-
I - 877
ICASSP 2004
➡
➡ Target
f1 f2
Disturbance
fP
y1 y2 yP
2
FFT
y1
FFT
Source spec Estimation
S Noise
FFT
Microphone Filtering Array
Recovered Signal
+
2
Sˆt arget ( f )
−
Spectral Subtraction
Phase φ ( f )
Fig. 1. Diagram of the proposed method. tion, x(k, t) is written as follows [5]. x(k, t) =
spectrum in short-time because the short-time spectrum has much correlation between each sound source. We divide the observed signal into several blocks. The length of the block is longer than that of the frame. The power spectrum is calculated frame by frame and averaged in a block. If the correlation between each sound source is lowered by the averaging, the average power spectrum is given as
A(k)s(k, t) + n(k, t)
where, A(k) = s(k, t) = n(k, t) =
[a1 (k), · · · , aD (k)]T [s1 (k, t), · · · , sD (k, t)]T [n1 (k, t), · · · , nM (k, t)]T
�|y1 |2 �
ad (k) denotes the transform function from d-th source to the microphones at discrete frequency k. sd (k, t) denotes the spectrum of d-th source. nm (k, t) denotes the spectrum of the back-ground noise and the reverberation at microphone m. [·]T denotes the transposition. From this, to simplify the expression, we omit the symbol k and t.
�·� denotes the averaging in a block. When P directivity patterns are given to the input vector, Eq. 1 is obtained. Y = F · s¯ + ε
Y
= =
[·]∗ denotes the complex conjugate. Fij represents the dot product between f i and aj . Ki denotes the component of the back-ground noise and the reverberation. To make the problem simple, let us assume that two sound sources exist in the sound field. The power spectrum of y1 is calculated as |y1 |2
=
|F11 |2 |s1 |2 + |F12 |2 |s2 |2 + (F11 s1 ) · (F12 s2 )∗ + (F11 s1 )∗ · (F12 s2 ) + ε1
[ �|y1 |2 �, �|y2 |2 �, · · · , �|yP |2 � ]T [ �|s1 |2 �, �|s2 |2 �, . . . , �|sD |2 � ]T [ ε1 , ε2 , . . . , εP ]T
|F11 |2 ⎜ .. F =⎝ . |FP 1 |2
f ∗1 · x
f ∗1 · a1 s1 + · · · + f ∗1 · aD sD + K1 F11 s1 + · · · + F1D sD + K1
=
s¯ = ε = ⎛
We describe the estimation of the source spectrum using the number of directivity patterns more than the sound sources. When a directivity pattern f 1 is given to the input vector x, the output y1 is written as follows. =
(1)
where,
2.2. Estimation of source spectrum
y1
= |F11 |2 �|s1 |2 � + |F12 |2 �|s2 |2 � + ε1
|F12 |2 .. .
|FP 2 |2
··· .. . ···
⎞ |F1D |2 ⎟ .. ⎠ . 2 |FP D |
Y denotes the average of the output spectrum given by P directivity patterns. s¯ denotes the average source power spectrum in the block. ε denotes the error. F denotes the gain matrix given by the directivity patterns and the transform function. Each component of F represents the contribution rate of each source spectrum contained in the output vector Y like as shown Fig. 2. As a matter of fact, Y contains the error factor because of the back-ground noise, the reverberation and the error of the transform function itself. The source power spectrum is estimated by minimizing the squared error εT ε using the number of directivity patterns more than the sound sources.
εi represents the error caused by the back-ground noise and the reverberation. It is difficult to estimate the source power
I - 878
⇒ ∇s εT ε = 0 min εT ε s s¯ = (F T F )−1 F T Y
(2)
➡
➡
Gain
Table 1. Conditions of the microphone array and the experiment.
f2
f1
array form
F22
F11
F21
θ1
F12
θ2
element sampling position evaluation data mode vector
θ
Fig. 2. Contribution rate of each source spectrum. (θ1 , θ2 denote directions of arrival. f1 , f2 denote directivity patterns. F denotes the contribution rate of the source spectrum.)
linear and consistent spacing 8 elements spaced 3cm apart non-directional condenser microphone 32 kHz, 16 bit shown at Fig. 3 100 sentences from 20 male speakers from the ASJ-JNAS corpus [6] 65536 point measured with TSP [7] impulse length 1024 samples Loudspeakers 3.5m
2.3. Signal Reconstruction
d
θ
7.3m
3.6m
After the estimation of the source spectrum by Eq. 2, the disturbance spectra is removed by the SS. This processing is carried out frame by frame in the block. ⎧ � � 1 jφ 2 �2 � 2 ⎪ ⎪ ⎨ |y1 | − α · �|s2 | �2 · e , if |y1 | − α · �|s2 |2 � > 0 sˆ1 = ⎪ ⎪ ⎩ 0, otherwise
Multi media studio Height:2.8m 7.6m
Fig. 3. Configuration of the loudspeakers and the microphone array ( d = 100, 150 cm, θ = 45, 70 deg) 3.2. Speech Processing
y1 represents the short-time spectra of the signal that the target source is emphasized or the signal that the noise source is suppressed. �|s2 |2 � represents the long-term disturbance spectra. α is an amplitude of the subtraction process. φ is an appropriate phase function. For example, we can use the phase of y1 . 3. EXPERIMENT 3.1. Conditions We recorded the speech data to enable continuous speech recognition. First, a loudspeaker was arranged in front of a microphone array. We recorded the single speech. The distance between the loudspeaker and the microphone array was d ( d = 100, 150 cm ). Next, two loudspeakers were arranged according to the distance of d and the angle of θ ( θ = 45, 70 deg ). The loudspeaker arranged in front of the microphone array was the target source. Another loudspeaker was the noise source and was moved to vary experimental conditions. We recorded the evaluation data totally in four different arrangements. The details of the microphone array and the experimental conditions are shown in Table 1. In the experiment, two different speeches were played simultaneously. The utterance length and volume were almost the same. The SNR was almost 0 dB.
The directivity patterns used in the proposed method were two DS array and two DCMP array. We totally used four different directivity patterns. The estimation of the source spectrum and the SS processing were conducted under the conditions shown in Table 2. For the comparison, we carried out only the DS array and only the DCMP array. 3.3. Speech Recognition We carried out the continuous speech recognition. The acoustic features and the analysis conditions are shown in Table 3. The acoustic models are trained with 20 K sentences spoken by about 100 male speakers from ASJ-JNAS corpus. The training data is recorded with close-talk microphones. The language models are the trigram language models using lexicon of 20 K vocabulary size. 3.4. MLLR adaptation In the proposed method, the disturbance is removed by the SS. However the recovered target speech contain some characteristic of the disturbance because of the residual disturbance spectrum or over reduction of disturbance. The discontinuity of the spectrum by the SS processing causes the musical noise. The recovered target speech contains the spectrum distortion even though humans can hear it without feeling a sense of incongruity. The recognition performance degrades because of the spectrum distortion. To improve the performance, we adopt the MLLR-based acoustic
I - 879
➡
➠ 9
;
?
A
B
>
C
D
F
H
I
>
?
A
B
>
C
�
Table 2. Analysis parameters. frame length 32 ms frame shift 8 ms window Hamming window block length 96 ms ( 9 frames ) block shift 16 ms subtraction factor ( α ) 0.3
�
8
7
3
56
4
3
�
2
3
�
�
Table 3. Parameters of the acoustic features. pre-emphasis 0.97 frame length 25 ms frame shift 10 ms window Hamming window acoustic feature 12th MFCC+∆MFCC+∆ power
�
�
�
�
�
�
�
�
�
�
�
�
�
�
�
�
�
�
�
�
�
�
�
"
$
$
'
�
(
�
�
�
+
$
'
�
(
"
�
/
�
/
�
+
1
-
model adaptation with the recovered speech which contain the characteristic of the proposed method. We attempt to enable the speech recognition to be robust to the spectrum distortion. As for the adaptation data, we select phonetically balanced sentences from ASJ-JNAS corpus. The adaptation data have been recorded under the same conditions as the evaluation data.
Fig. 4. Results of continuous speech recognition. (Each thick bar represents the average recognition performance in four experimental conditions. Line on the bar represents the maximum and minimum performance.)
number exceeds the sound sources. Experimental results showed the effectiveness of the proposed method. The error reduction was 45 % compared to the conventional array processing. Furthermore, the recognition performance was improved by the MLLR adaptation with the recovered speech.
3.5. Results Figure. 4 shows the results of continuous speech recognition. Word accuracy was over 94 % where the close-talk microphone was used. In the case of one speaker, the performance was high enough even when the distant microphone was used. When it came to double talk recognition, the performance seriously deteriorated. Word accuracy was about 7 %. The DS array and the DCMP array improved performance. As for the DS array, the recognition performance was only 25 %. The DCMP array, which steered null toward the noise direction, showed higher performance than the DS array. However the recognition performance was still not sufficient. On the contrary, the proposed method improved the performance significantly. The recognition rate was over 70 % in word accuracy. This is 61 % and 45 % error reduction compared to the DS array and the DCMP array respectively. We could confirm the superiority of the proposed method against the conventional array processing. Furthermore the MLLR adaptation with the recovered speech improved the performance and reduced errors by 28 %. The performance of almost 80 % in word accuracy was achieved. 4. CONCLUSION We have proposed the speech segregation method using a microphone array with multiple directivity patterns, whose
5. REFERENCES [1] S. F. Boll, “Suppression of acoustic noise in speech using spectral subtraction”, IEEE Trans. ASSP, ASSP-33, Vol. 27, pp.113-120, 1979. [2] M. Aoki et al., “Sound source segregation based on estimating incident angle of each frequency component of input signals acquired by multiple microphones”, J.Acoustic . Soc. vol.22, No.2, 2001.3. [3] J.L. Flanagan et al., “Computer-steered microphone arrays for sound transduction in large rooms”, J. Acoust. Soc. Am. 78 (5), pp. 1508-1518, 1985. [4] K. Takao et al., “An adaptive antenna array under directional constraint”, IEEE Trans. Antennas & Propag. vol.AP-24, No.5, pp.662-669, Sept.1976. [5] F. Asano et al., “Sound source localization and separation in near field” IEICE Trans. vol. E83-A, No.11, pp.2286-2294. [6] K. Itou et al., “The design of the newspaper-based Japanese large vocabulary continuous speech recognition corpus”, Proc. ICSLP98, pp.3261-3264, Nov. 1998. [7] Y. Suzuki et al., “An optimum computer-generated pulse signal suitable for the measurement of very long impulse responses”, J.Acoustic. Soc. Am. vol.97 (2), pp.1119-1123, 1995.
I - 880