Speeding-Up Mutation Testing via Data Compression and State Infection Qianqian Zhu
Annibale Panichella
Andy Zaidman
Delft University of Technology Email:
[email protected]
University of Luxembourg Email:
[email protected]
Delft University of Technology Email:
[email protected]
Abstract—Mutation testing is widely considered as a high-end test criterion due to the vast number of mutants it generates. Although many efforts have been made to reduce the computational cost of mutation testing, its scalability issue remains in practice. In this paper, we introduce a novel method to speed up mutation testing based on state infection information. In addition to filtering out uninfected test executions, we further select a subset of mutants and a subset of test cases to run leveraging data-compression techniques. In particular, we adopt Formal Concept Analysis (FCA) to group similar mutants together and then select test cases to cover these mutants. To evaluate our method, we conducted an experimental study on six open source Java projects. We used EvoSuite to automatically generate test cases and to collect mutation data. The initial results show that our method can reduce the execution time by 83.93% with only 0.257% loss in precision.
I. I NTRODUCTION Mutation testing is a fault-based testing technique that has been very actively investigated by researchers since the 1970s. Mutation testing introduces small syntactic changes into the program to generate faulty versions (mutants) according to well-defined rules (mutation operators) [1]. Then the quality of a test suite can be qualified as the percentage of mutants it distinguishes from the original program (mutation score). The benefits of mutation testing have been shown in many empirical studies, e.g. [2], [3]. Despite its well-known advantages, mutation testing is currently not widely applied. This is due to the computational cost incurred from executing each mutation against the test suite to obtain the mutation score and the number of mutants increasing dramatically with the size of the program. To address these limitations, several methods have been proposed in literature, such as mutant sampling [4] and selective mutation [5]. Differently from the aforementioned methods that are independent of the program under test, other procedures have been developed to further optimise the mutation execution procedure given the program under test. State-of-the-art techniques falling into this category filter unnecessary executions based on the dynamic information at run-time, e.g., line coverage [6] and state infection [7]. In this paper, we further optimise mutation execution using data compression techniques based on state infection. In addition to filtering out unnecessary test executions, we “compress” mutation execution by selecting a subset of mutants and a subset of test cases to estimate the mutation score with
minimal loss of precision. We coined our method “ComMT”, which is short for Compressed Mutation Testing. II. R ELATED W ORK The most well-known techniques for reduction of the computational cost are mutant sampling [4], selective mutation [5], weak mutation [8] and mutant schema [9]. However, these methods are independent of the program under test. More recently researchers are targeting to further improve the mutation execution process by gathering information from the program at run-time. A widely adopted strategy in this category is to execute the test suite on the original program before mutation execution to avoid unnecessary executions. Coveragebased optimisation filters out the test executions when a test case does not cover the mutated statement; this optimisation has been used in existing mutation testing tools, such as JAVALANCHE [6], Major [10] and PIT/PiTest [11]. Also of interest is infection-based optimisation, which only executes a test case on a mutant when the test infects the execution state of the mutant, filtering out weakly live mutants. Just et al. [7] improved the original infection-based method by combining propagation information: a test must be executed on a mutant if the execution state of the mutated expression propagates to a top-level expression; meanwhile, they partitioned mutants based on their intermediate results for each test case. Also, Ma and Kim [12] applied a similar idea to cluster mutants for each test case by comparing the values of innermost expressions. Unfortunately, infection-based optimisation has not been publicly integrated into existing mutation tools. Mutant clustering is another approach considering the program under test. It aims to reduce the number of mutants based on the similarity of mutants instead of random sampling. It is introduced by Hussain [13] who applied clustering algorithms (e.g. K-means) to assemble similar mutants. However, their methods require the execution of all mutants against all the test cases, which cannot reduce the runtime overhead during the mutation execution. Later, Ji et al. [14] measured the similarity of the mutants using domain analysis. They can divide mutants directly based on static control flow analysis. But they only manually analysed the clustering accuracy without indication of the runtime overhead caused by domain analysis. Also, the approach of eliminating redundant mutants has gained much attention to achieve efficient and scalable mutation analysis. Amongst these studies are mutation subsumption
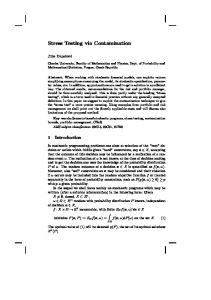
Fig. 1. Mutation data compression
(e.g. [15]–[17]), which models the subsumption relationships between mutants in order to reduce the number of mutants for mutation testing. Besides, test prioritisation and reduction are also used to speed up mutation testing, e.g. Zhang et al. [18]. The key idea behind their method is to minimise the execution cost to determine the sets of killed and non-killed mutants. Our method is a combination of infection-based optimisation and mutant clustering. We group mutants based on their state infection outcomes which are different from Hussain [13]. To find the groupings of mutants, we only require one execution of the test suite on the original program. Furthermore, compared to Just et al. [7] and Ma and Kim [12]’s work, we partition mutants for all test cases instead of targeting each test case. Thus, we can further reduce the number of test cases with test selection techniques. Meanwhile, our method can also be combined with other cost reduction techniques which require no knowledge of the program under test, such as selective mutation and mutant schema. III. M UTATION DATA COMPRESSION In weak mutation testing, a mutant is killed if its execution leads to a state change, i.e., the values of variables and class attributes after the mutated expression differ from the values in the original class. For example, the expression c=a*b and its mutated version c=a/b have different outcomes (i.e., the mutant is weakly killed) if a6=1 and b6=1. Differently from strong mutation, weak mutation scores can be computed with one single execution of each test by instrumenting the mutated locations to keep track of the execution states [19]. Therefore, it is widely used as a light-weight mutation score. ComM T uses weak mutation (or infection state) and data compression techniques to decide which mutants and which tests to consider for strong mutation. The overall methodology of ComMT consists of five stages as illustrated in Figure 1: • Instrumentation. We generate mutants for the program under analysis relying on the internal mutation engine in EvoSuite [19]. Then, we instrument the original program to keep track of the mutation locations. • Test execution. Once instrumented, the test suite is executed once to collect data of the infected mutants. In other words, in this stage we record the mutants that are weakly killed by the tests. • Infection analysis. The results of the previous stage are stored in the mutant-by-test infection matrix. Let P be the program under analysis and let T be the test suites; let
M be the set of mutants for the programs P generated by preselected mutation operators. A mutant-by-test infection matrix is a m × n matrix where m is the number of mutants, n is the number of test cases in T , and a generic entry xi,j is a binary value indicating whether the i-th mutant is weakly killed (i.e., xi,j = 1) or not (i.e., xi,j = 0) by the j-th test ∈ T . • Formal Concept Analysis (FCA). FCA is applied on the mutant-by-test infection matrix in order to extract the hidden relationships (formal concepts) among mutants and tests according to the infection data. • Data compression. The extracted concepts are then used to compress the mutant-by-test infection matrix. The resulting matrix has a lower number of rows and columns compared to the original one: the rows denote groups of mutants belonging to the same formal concepts; similarly, tests are grouped by concepts to form the columns. Such a compressed matrix is used then to select mutants and tests for the strong mutation analysis. The details of FCA and the data compression procedure are described in detail in the next sub-sections. A. FCA grouping Starting from the mutant-by-test infection matrix, we analyse the conceptual structures among mutants and tests using FCA. FCA is a data analysis method which has been shown to be a powerful mathematical technique to convey and summarise large amounts of information [20]. It takes as input the formal context which is a structure C = (O, A, I) where O is the set of objects, A is the set of attributes while I ⊆ O × A is a binary relation between O and A. Then, FCA produces the concept lattice, which is a collection of formal concepts in the data ordered by sub-concept relations, i.e., from superconcepts to sub-concepts. Each formal concept is composed by (i) a group of objects sharing the same attributes, and (ii) all attributes that apply to the objects in the concept [20]. In our context, the objects in O are the mutants, the attributes in A are the test cases, and I is our mutant-bytest infection matrix. Then, FCA derives formal concepts that represent groups of mutants that are weakly killed by the same subset of tests. In other words, the output of FCA can be viewed as two-way clustering since mutants and tests are grouped in concepts such that all mutants in the same concept c are weakly killed by all tests in c. To provide a more practical description, let us consider the mutant-by-test infection matrix with six mutants and four tests reported in Figure 2. The mutant-by-test infection matrix can be viewed as a formal context for FCA with O = {m1 , m2 , m3 , m4 , m5 , m6 }, A = {t1 , t2 , t3 , t4 } and I corresponding to the matrix entries. For this example, FCA returns the concept lattice depicted in the right side of Figure 2. We can observe that FCA derives one formal concept with mutants {m5 , m6 } and tests {t1 , t2 } meanings that the two mutants can be weakly killed by the two tests. While m5 and m6 are not necessary overlapping (i.e. functionally identical), we argue that if t1 (or t2 ) kills m5 then it likely
TABLE I S UBJECT PROGRAMS Project
Full name
jsecurity summa db-everywhere noen
Jsecurity summa DB-Everywhere dynamic analysis & test JTailPlus CalorieCount
jtailgui caloriecount
Fig. 2. A toy program and its concept lattice
kills m6 as well in strong mutation. Therefore, for this concept we can select only one mutant (e.g., m5 ) and/or one test (e.g., t1 ) to represent the whole concept. Among all concepts in the formal lattice, we select for data compression only those that are directly connected to the exit point in the lattice hierarchy that we refer to as maximal groupings. In our example in Figure 2, there are three maximal groupings, which are {m5 , m6 |t1 , t2 }, {m4 |t3 }, and {m3 |t4 }. The other concepts in the lattice (e.g., {m2 , m5 , m6 |t1 } in Figure 2) are already included in the maximal grouping by sub-concept relation which is graphically represented by the hierarchy in the lattice. Then, the maximal groupings are used to compress the mutant-by-test infection matrix by condensing the rows of mutants from the same maximal group into one single row that represents the whole concept. A similar compression can be performed on the columns of the mutantby-test infection matrix according to how tests are grouped in maximal groupings. Using this compressed matrix we can reduce the number of mutants and tests to run for strong mutation analysis.
Overall
LOC # Classes
# Test # Killed # Mutants cases mutants
13,135 69,339 7,125 18,867
197 512 97 382
313 470 84 767
2,384 8,201 302 5,222
2,036 3,895 168 4,069
2020 61,544
43 596
147 4,699
1246 49,925
776 26,122
172,030
1,827
6,480
67,280
37,066
then the test is very likely to weakly kill the rest. Thus, we consider one maximal grouping as basic element to be covered in the set cover problem. Our set cover-based selection is as follows: at each stage, we choose the test that weakly kills the largest number of uncovered maximal groupings. 3) Sorting by maximal groupings: Instead of selecting a minimal subset of test cases that weakly kill all possible mutants, we sort the test cases by the number of maximal groupings it belongs to. The key idea behind this strategy is: test cases belonging to more maximal groupings means they can weakly cover more mutants, thereby, they are more likely to strongly kill more mutants. In particular, we select the test cases with the largest number of maximal groupings at each stage until all the possible mutants are covered. IV. E XPERIMENTAL STUDY To evaluate the effectiveness of our method, we conduct an initial experimental study on a set of open source programs. In the following sections, we describe our experimental setup.
B. Test case selection
A. Research questions
After obtaining the maximal groupings from the concept lattice, we first compress the mutant-by-test infection matrix by condensing the rows, i.e., we select one mutant from each maximal grouping. Then to further perform the compression on the columns, we propose three approaches for test case selection: 1) FCA-based selection: In each formal concept c, we have a set of mutants which share a set of attributes, i.e., test cases. Tests in c weakly kill all mutants in the same concept c, from which follows our assumption that tests in the same concepts also exhibit similar behaviour. Thus, we select one test from each formal concept to further condense the columns of the original matrix. More specifically, this strategy is a rigid way to bi-cluster the mutant-by-test infection matrix based on maximal groupings of the concept lattice. 2) Set cover using greedy algorithm: After selecting one mutant from each maximal grouping, instead of condensing the columns through FCA-based selection, we try to find a sufficient subset of test cases that weakly kill all possible mutants. This becomes the set cover problem. Considering that the set cover problem is a well-known NP-hard problem, we adopt a greedy algorithm for polynomial time approximation of this problem. Based on our assumptions in Section III-A, if one test can weakly kill one mutant in a maximal grouping,
We first explored whether FCA is suitable for compressing the infection matrix. This leads to: RQ1: Can FCA find maximal groupings in the infection matrix? After generating the maximal groupings, we set out to investigate the similarity of mutants in each maximal grouping, especially their outcomes in terms of strong mutation. RQ2 addresses exactly this: RQ2: How frequently do mutants in a maximal grouping generated by FCA have same outcome in strong mutation? To further compress the mutation data, in RQ3 we examine test case selection based on FCA grouping to cover the selected mutants: RQ3: Does test case selection based on FCA grouping yield a smaller number of tests on average? Our method’s aim is to reduce execution time while maintaining the precision of mutation testing. This leads to RQ4: RQ4: What is the trade-off between the mutation score and the execution time using ComMT? B. Experimental setup We evaluated ComMT using six open source projects which come from SF110 [21]. Table I shows the basic information of subject programs used in our experimental study.
Fig. 3. Overall workflow of experimental study
To carry out the experiment, we used EvoSuite to automatically generate tests and mutants for each subject program. Although EvoSuite supports different criteria (e.g., branch coverage), in this study we used the strong-mutation criterion. With this setting, EvoSuite creates mutants for the class under test using its own mutation engine. Such mutants become coverage targets to reach (kill) in the test case generation process. For the search, we set the budget to 30 seconds for each class in the subject program under test. At the end, EvoSuite provides the generated test suite with assertions and the list of mutants that are strongly killed by each test in the suite. In addition to strong mutation data, we used the instrumentation framework in EvoSuite to collect the infection data for each mutant such to have the weak mutation data as well. Finally, we collected the average execution time of tests from EvoSuite; this is used to estimate the execution time of mutation testing. The overall workflow of the test data generation and data collection from EvoSuite can be seen in Figure 3. After obtaining the infection matrix, we applied ConExp [22] for FCA processing. To answer RQ1 we use ConExp to build the concept lattices from the infection matrix and then extract the maximal groupings. We then calculate the number of mutants in each maximal grouping and we summarise the size of the maximal groupings across all projects to determine whether FCA is suitable for compressing the infection matrix. To answer RQ2, we calculated the approximation of killed mutants to evaluate the similarity of mutants in strong mutation. Firstly, we randomly select one mutant from each maximal grouping and use the outcome of this mutant in strong mutation (whether the mutant is strongly killed or not) to represent the whole group. To minimise the random error, we carry out the process of the mutant selection 100 times for each project, and compare the error rate, i.e. the ratio of mistakenly predicated mutants in strong mutation, as shown in Equation 1. For this experiment, we used all test cases. error rate =
#estimated killed mutants − #actual killed mutants #actual killed mutants (1)
To answer RQ3, we compared three strategies of test case selection (as mentioned in Section III-B) based on the results of FCA. For each subset of test cases generated by ComMT, we mainly analysed its size and the number of killed mutants. For FCA-based test case selection, we need to select one test case from each maximal grouping randomly; we treat each maximal grouping equally. Similarly to RQ2, we ran the process of FCA-based test case selection 100 times independently to eliminate the random error. For set coverbased and sorting-based test case selection, we choose one test case based on previously selected information, so we recorded the test case number and killed mutant number at each iteration. To answer RQ4, we mainly studied the relationship between execution time and error rate when adopting the ComMT approach. Here the execution time is estimated by the data collected from EvoSuite. To simulate the actual mutation execution process, test cases are executed depending on the selected sequence. For FCA-based selection, there is no selected sequence, as each maximal grouping is treated equally. So when calculating the execution time for FCA-based selection, we adopted the default sequence in the original test suite. As soon as the mutant is killed by a test case, the rest of the unexecuted tests are no longer run against this mutant. In order to further quantify the optimisation results from ComMT, we compared our method with the other two optimisation configurations mentioned in Section II, i.e., coverage-based and infection-based optimisation. For these two optimisation approaches and our methods, we need to collect the reachability and necessity condition from a single execution of the whole test suite. In addition to one single execution of the whole test suite, ComMT requires extra time for data compression. Here we do not take data compression into consideration as the compression process is fairly quick (within 10 seconds). Therefore, we assume that the pre-processing overhead of these three methods is similar, and we can simply compare their execution time during the mutation execution procedure. V. R ESULTS A. RQ1: FCA grouping Table II summarises the number of maximal groupings and the compression ratio for each project. The compression ratio is defined as the number of mutants divided by the number of groupings. We can see that on average there are 8.48 mutants in each maximal grouping; this means FCA can compress the original size of mutants by 88.2%. Thereby, we can conclude that FCA can find maximal groupings from the infection matrix and also significantly reduce the number of mutants that need to be executed. B. RQ2: Mutant similarity To quantify the similarity of mutants in each maximal grouping, we compared the approximation result of mutant selection to the actual results of strong mutation. We plotted the selection results in Figure 4 using box plots. The error
40
C. RQ3: test case selection The detailed iteration results of the three test selection strategies for jsecurity are shown in Figure 5. The other projects show a similar tendency; details for the other five projects are in [23]. Test case selection based on FCA generates a solution distributed in a small area: its test case number is around a constant value, and the average number of killed mutants is near the actual results of strong mutation. For set cover-based selection, the killed mutant number initially grows quickly as the test case number increases. As soon as the mutants are all covered by the selected test cases, the method stops adding new test cases, thus ending up with a relatively small set of test cases. However, we see that the optimal solution generated by the set cover-based selection can never reach to actual number of killed mutants. This reflects that a minimum set of test cases that weakly kills all the mutants is
un
t
ui
co lo ca
db
Fig. 4. Error rate of mutant selection based on FCA projects
not enough to predict the strong mutation score. The sortingbased selection has the same trend as the set cover-based one: it increases slowly compared to the set cover-based strategy, but it reaches the level of actual killed mutants in the end. Table II compares the final sub-test suites generated by the three strategies in terms of the suite size reduction. The set cover-based selection produces the smallest set of test cases of the three. FCA-based selection can reduce the test size by 44.03% on average. For the sorting-based selection, the subset is the largest, yet still 23.84% reduced compared to the original test suite. Together with the observations from Figure 5, we conclude that test case selection based on FCA grouping yields a smaller number of tests compared to the original test suite. D. RQ4: trade-offs Table III summarises the comparison of three methods in terms of execution time reduction and error rate. To calculate the execution time reduction, we used coverage-based optimisation as a baseline. For the coverage-based optimisation, we see that the execution time ranges from 0.02 to 19.21 minutes. Overall, the infection-based optimisation which uses weak mutation as filtering strategy to select the mutants for strong mutation reduces runtime by 11.37%, while ComMT reaches at least 83.93%, which is a ≥7 time speed-up. Moreover, for ComMT, we compared four test case selection strategies based on selected mutants: no selection, set coverbased, FCA-based and sorting-based selection. We observe that ComMT with mutant compression alone achieves a significant reduction in runtime. By applying test case selection based on FCA groupings, the improvement in execution time reduction is small: at most 5.89%. 1200 1000 #killed mutant
rate of the approximation results can be both positive (overestimation) or negative (underestimation). This is caused by the overall trend: whether the randomly selected mutant from each FCA grouping overestimates the killed mutants for the whole grouping or not. The average error rate is around zero among all the projects; this shows that the mutants in a maximal grouping exhibit similar behaviours in strong mutation on average. Moreover, the mutants in a maximal grouping are the ones whose execution states are infected by the same group of test cases. In terms of weak mutation, these mutants are killed by a same group of test cases; this leads to an interesting finding: mutants which have the same outcome in weak mutation against all the test cases (weakly overlapping) are very likely to have the same outcome in strong mutation. However, the error rate distribution varies greatly between projects: for jtailgui it varies most, ranging from -33.1% to 39.9%. For projects noen and caloriecount, the distribution ranges between respectively -4.9% to 6.6% and -7.9% to 7.2%. We speculate that this difference is due to the size of the original test cases. We group mutants by observation from their weak mutation behaviour against the test cases. What we do in fact is judge whether two mutants are overlapping in terms of weak mutation, which is a typical undecidable problem. Therefore, the confidence of whether mutants are weakly overlapping is determined by how many test cases are involved in the judgement. This reveals a potential limitation of the FCA groupings approach: projects with a relatively small test suite are more likely to have low clustering accuracy.
rie
jta
ilg
en no
re
8.48
he
1,101.33
w
11,213.33
a
23.84
ry
64.82 44.03
-20
m
Overall
0
ve
5.39 14.31 5.59 7.08 7.74 10.76
m
442 573 54 738 161 4,640
-e
2,384 8,201 302 5,222 1246 49,925
su
15.34 17.23 47.62 12.91 24.49 25.45
y
37.23 38.25 60.71 40.54 38.37 49.05
rit
67.09 64.26 73.81 62.19 52.38 69.16
20
cu
jsecurity summa db-everywhere noen jtailgui caloriecount
mean
jse
Project
Test case reduction (%) Mutant compression ratio by FCA Set # # Compression FCA Sorting cover Mutants Groupings ratio
error rate (%)
TABLE II T EST CASE REDUCTION AND MUTANT COMPRESSION
800 600 fca set cover sorting #actual killed mutant
400 200 0 0
100 200 #test case
300
Fig. 5. Comparison of test case selection in each iteration for jsecurity
TABLE III T RADE - OFFS BETWEEN EXECUTION TIME REDUCTION & ERROR RATE (%) Project
Cov. Inf. based based
ComMT No selection
Exec. Red. Red. jsecurity summa db-everywhere noen jtailgui caloriecount Overall
Err.
Set cover Red.
Err.
FCA
Red. Err. Red. Err.
1.39 16.78 87.71 0.13 90.27 -17.42 88.55 1.54 13.57 90.97 0.74 93.58 -14.1 92.18 0.02 3.65 59.29 -0.26 80.81 -18.83 70.43 1.58 6.09 88.52 0.30 91.08 -30.69 89.52 0.31 18.7 87.66 0.07 91.33 -13.11 89.86 19.21 9.39 89.44 0.04 91.83 -21.99 90.5 -
Sorting
the estimated execution time is representative of the actual one. Yet, as we are only comparing estimated execution times and not actual execution times, the relationship between estimated runtime and actual runtime is less critical. Also, we used error rate to measure the approximation by our method.
-2.46 -2.25 -6.22 -7.29 -3.42 -6.89
87.31 90.87 63.95 87.98 87.89 89.06
-0.04 0.69 -0.26 0.14 0.07 -0.38
11.37 83.93 0.257 89.82 -19.36 86.84 -4.76 84.51 0.262
For the three test case selection strategies, we see that the execution time for set cover-based selection is the least, but the loss of precision is the most (−19.36%). FCA-based selection reduces execution time by 86.84%, while the error rate is −4.76%. For sorting-based selection, the execution time is the largest, but its error rate is the lowest, almost equalling the actual results of strong mutation. Comparing sorting-based selection to the situation without test case selection, we can see the error rate is similar, but the execution time is slightly less (0.58%). One thing must be noted: we select test cases based on mutants grouped by FCA. Thus, the error rate of the selected test cases is largely dependent on the selected mutants. When the selected mutants overestimate the killed mutants, i.e., the error rate of the approximation is positive, less test cases (causing negative impact on error rate) might slightly improve the overall error rate. Take project summa for example: without any test case selection, the overall error rate is 0.74%. After applying sorting-based test case selection, the overall error rate changes to 0.69%, an 0.05% improvement. To summarise, ComMT can reduce the execution time by 83.93% using mutant compression alone with only 0.257% precision loss. VI. T HREATS TO VALIDITY Threats to external validity: First, our experimental study only evaluated our method based on automatically generated test cases from EvoSuite, which might not be generalisable to other (manually written) test suites. Second, our results are based on mutants generated by embedded mutation operators of EvoSuite; these results might be different when using other mutation tools. With regard to subject selection, we chose six open source projects from a well-known corpus (SF110) differing in size and domain. Threats to internal validity: The main threat to internal validity for our study is that there might be faults in our implementation of ComMT and the experiments. As we mainly relied on existing software (EvoSuite and ConExp) and this software is considered reliable, we reduce internal threats to a large extent. Moreover, we carefully reviewed and tested all code for our study to eliminate faults in our implementation. Threats to construct validity: The main threat to construct validity is the measurement we used to evaluate out methods. To minimise the threat, we used estimated execution time to assess the cost of our techniques. A possible issue is whether
VII. C ONCLUSION & F UTURE W ORK In this paper, we have presented an approach to speed-up mutation testing using data compression techniques based on state infection information. We have adopted Formal Concept Analysis (FCA) to group the mutants together which have the highest similarity in state infection against all test cases. By analysing the behaviour of mutants grouped by FCA, we found that the mutants in a group show similar behaviours in strong mutation on average. We have further explored the trade-offs between execution time and precision loss by applying FCA to compress mutation testing. The method we have adopted is to select one mutant from each FCA grouping and then select test cases to cover the mutants. The overall results show that our method can reduce the execution time by 83.93%84.51%, with a loss of precision between 0.257%-0.262% on average. This provides one promising solution to reduce the high computational cost of mutation testing. While our current results are encouraging, we envision the following future work: • Generalise to other test suites, e.g. manually written ones. • Investigate other data compression methods, such as Principal Component Analysis (PCA). • Implement our method on top of an existing mutation testing tool. • Examine ways to control the clustering accuracy in the light of small test suites. R EFERENCES [1] J. Offutt, “A mutation carol: Past, present and future,” Information and Software Technology, vol. 53, no. 10, pp. 1098–1107, 2011. [2] A. P. Mathur and W. E. Wong, “An empirical comparison of data flow and mutation-based test adequacy criteria,” Software Testing, Verification and Reliability, vol. 4, no. 1, pp. 9–31, 1994. [3] J. H. Andrews, L. C. Briand, and Y. Labiche, “Is mutation an appropriate tool for testing experiments?” in Proc. ICSE. IEEE, 2005, pp. 402–411. [4] A. T. Acree Jr, “On mutation.” DTIC Document, Tech. Rep., 1980. [5] A. J. Offutt, A. Lee, G. Rothermel, R. H. Untch, and C. Zapf, “An experimental determination of sufficient mutant operators,” ACM Trans. Softw. Eng. Methodol., vol. 5, no. 2, pp. 99–118, 1996. [6] D. Schuler and A. Zeller, “Javalanche: efficient mutation testing for java,” in Proc. ESEC/FSE. ACM, 2009, pp. 297–298. [7] R. Just, M. D. Ernst, and G. Fraser, “Efficient mutation analysis by propagating and partitioning infected execution states,” in Int’l Symp. on Software Testing and Analysis (ISSTA). ACM, 2014, pp. 315–326. [8] W. E. Howden, “Weak mutation testing and completeness of test sets,” IEEE Trans. Software Eng., no. 4, pp. 371–379, 1982. [9] R. H. Untch, “Mutation-based software testing using program schemata,” in Proc. annual Southeast regional conf. ACM, 1992, pp. 285–291. [10] R. Just, F. Schweiggert, and G. M. Kapfhammer, “MAJOR: An efficient and extensible tool for mutation analysis in a java compiler,” in Int’l Conf. Automated Softw. Engineering (ASE). IEEE, 2011, pp. 612–615. [11] “Available mutation operations (PIT),” http://pitest.org/quickstart/ mutators/, [Online; accessed 10-August-2016]. [12] Y.-S. Ma and S.-W. Kim, “Mutation testing cost reduction by clustering overlapped mutants,” J. Systems and Software, vol. 115, pp. 18–30, 2016. [13] S. Hussain, “Mutation clustering,” Ms. Th., Kings College London, Strand, London, 2008.
[14] C. Ji, Z. Chen, B. Xu, and Z. Zhao, “A novel method of mutation clustering based on domain analysis.” in SEKE, 2009, pp. 422–425. [15] R. Just, G. M. Kapfhammer, and F. Schweiggert, “Using non-redundant mutation operators and test suite prioritization to achieve efficient and scalable mutation analysis,” in Software Reliability Engineering (ISSRE), 2012 IEEE 23rd International Symposium on. IEEE, 2012, pp. 11–20. [16] B. Kurtz, P. Ammann, M. E. Delamaro, J. Offutt, and L. Deng, “Mutant subsumption graphs,” in Software testing, verification and validation workshops (ICSTW), 2014 IEEE seventh international conference on. IEEE, 2014, pp. 176–185. [17] P. Ammann, M. E. Delamaro, and J. Offutt, “Establishing theoretical minimal sets of mutants,” in Software Testing, Verification and Validation (ICST), 2014 IEEE Seventh International Conference on. IEEE, 2014, pp. 21–30. [18] L. Zhang, D. Marinov, and S. Khurshid, “Faster mutation testing inspired by test prioritization and reduction,” in Proc. Int’l. Symp. on Software
Testing and Analysis (ISSTA). ACM, 2013, pp. 235–245. [19] G. Fraser and A. Arcuri, “Achieving scalable mutation-based generation of whole test suites,” Empirical Software Engineering, vol. 20, no. 3, pp. 783–812, 2015. [20] R. Wille, “Formal concept analysis as mathematical theory of concepts and concept hierarchies,” in Formal concept analysis. Springer, 2005, pp. 1–33. [21] G. Fraser and A. Arcuri, “A large scale evaluation of automated unit test generation using evosuite,” ACM Trans. Softw. Eng. Methodol., vol. 24, no. 2, p. 8, 2014. [22] S. A. Yevtushenko, “System of data analysis concept explorer,” in Proc. of the national conference on Artificial Intelligence KII, vol. 2000, 2000. [23] Q. Zhu, A. Panichella, and A. Zaidman, “Speeding-up mutation testing via data compression and state infection,” PeerJ Preprints, 12 2016. [Online]. Available: https://doi.org/10.7287/peerj.preprints.2632v1