Static and Dynamic Electrocardiographic Patterns Preceding Torsades de Pointes in the Acquired and Congenital Long QT Syndrome JP Couderc1, J Xia1, X Xu1, S Kaab2, M Hinteeser2, W Zareba1 1
Center for Quantitative Electrocardiography and Cardiac Safety, University of Rochester Medical Center, Rochester, NY, USA; 2 Ludwig Maximilians Universität, Munich, Germany
being monitored using Holter ECG apparatus. We propose to investigate the standard clinical ECG metrics such as RR and QT intervals and complement these measurements with less clinical measurements designed to quantify static and dynamic aspects of the repolarization segment.
Abstract The arrhythmogenic mechanisms involved in the triggering of the polymorphic ventricular tachycardia called torsades de pointes (TdPs) remains to be elucidated. In this work, we investigated the static and dynamic profiles of the repolarization interval from the surface electrocardiogram recorded in healthy individuals and in cardiac patients with TdPs. We implemented this analysis just prior to the arrhythmia onset and we computed the delta values based on baseline periods (1 hour prior to event). We measured QT/QTc prolongation, QT variability, ventricular ectopic beats (VPBs) frequency, T-wave amplitude, T-peak to T-end interval, and T-wave complexcity. The analysis of these parameters in reference to baseline revealed 1) an increased QTc variability, 2) the presence of VPCs, and 3) the profound changes in T-loop morphology in patients developing TdPs.
1.
Methods
2.1.
Study populations
The cohort of patients and individuals included in this study consist of three cardiac patients, two patients with the congenital long QT syndrome (LQTS) and three healthy subjects. The Holter recordings from these cardiac patients are from the database E-OTH-12-06-009 of the THEW [8]. The clinical information is described in Table 1. Healthy individuals (N= 3): the healthy individuals were exposed to sotalol in a study published previously [9]. The Holter ECGs from the three individuals showing the longest QTc prolongation induced by dl-sotalol during the experiment were selected here. TdP patients (N= 5): the patients with TdPs are either congenital LQTS (cLQTS, N=2) or drug-induced LQTS (dLQTS, N=3) patients. All patients had a normal creatinine level. The healthy subjects were given oral dlsotalol (320 mg), while the dLQTS group received dlsotalol intravenously at a rate of 2mg/kg bodyweight. The cLQTS patients experience spontaneous episodes of TdPs.
Introduction
The lack of understanding of the arrhythmogenic mechanisms involved in TdPs is sustained by the rarity of documented clinical cases. Most experts in the field have agreed on qualitative electrocardiographic manifestations preceding the arrhythmias such as: labile QT interval, "pause-dependent" onset of the arrhythmia [1], abnormal T-wave morphology [2], early after depolarizations and ectopic beats[3], and increased ventricular repolarization heterogeneity [4-6]. The independent and combined roles of these electrophysiological factors in the triggering of TdPs remain to be elucidated but several models have been proposed [3;7] in which the role of an increased repolarization heterogeneity is presented as a required predisposing factor. Most of these electrophysiological factors could be reflected on the body-surface ECGs. Consequently, we propose to investigate the repolarization ECG signal based on computerized beat-to-beat quantitative tools in patients whom experienced drug-induced TdPs while
ISSN 0276−6574
2.
2.2.
Holter ECG recordings
All the Holter ECGs used in this study were acquired using the H12 recorder from Mortara Instrument (Milwaukee, MN). The technical specifications of the recordings are: 12 leads (torso), 128 Hz sampling frequency, 5 µV amplitude resolution, and 24-hour duration. The ECG files and annotation information were downloaded from the THEW in ISHNE format [10].
357
Computing in Cardiology 2010;37:357−360.
group of patients with the LQTS has longer QTc interval duration than the other groups (see Table 3). TpTe interval duration is equivalent in all groups. Variability of the QTc interval, T roundness and number of VPCs are higher in the groups of patients developing TdPs (cLQTS and dLQTS).
Table 1. Clinical description of the study populations Pts Age Sex CAD EF Wei LVH (yrs (%ght (kg) ) ) dLQTS 65 F No 63 50 No dLQTS 45 M No 28 76 Yes dLQTS 77 F Yes 35 65 Yes cLQTS 12 M No 41 51 No cLQTS 26 F No -60 No Healthy 35 M No --No Healthy 44 M No --No Healthy 32 M No --No dLQTS: drug-induced LQTS; cLQTS: congenital LQTS; CAD: coronary artery disease; EF: ejection fraction (%); LVH: left ventricular ejection fraction (%);
2.3.
Table 2. Matrix of ECG measurements and associated torsadogenic factors. 1 2 3 4 5 QT/QTc prolongation X X Increased madQT X X X Increased VPBs X X X (couplets, triplets) X X T amp TpTe prolongation X Increased 2/ 1 X 1: repolarization instability; 2: action potential triangularization; 3: repolarization delay; 4: increased heterogeneity of repolarization (apico-basal, inter-ventricular, transmural); 5: early after depolarization); T amp: changes in amplitude of T-wave.
Electrocardiographic parameters
The list of ECG parameters investigated in this study is provided in Table 2 in addition to their links to factors currently considered potential triggers of TdPs. These links are based on mechanistic concepts such as the ones from the TRiAD [7], these concepts include transmural dispersion of repolarization [3], instability (variability and alternans of the repolarization segment) and early after depolarization (EADs) [3], amongst others. All the computerized measurements were realized using the academic version of the COMPAS software (University of Rochester, Rochester, NY). The instability of the repolarization was estimated using the median absolute deviation (MAD) of the beat-to-beat measurements of the QT interval after heart rate correction based on the Fridericia formula. To further control for the effect of RR variation, we divided these MAD values by the MAD of the RR intervals (MADQTc/MADRR). We computed the average ECG measurements in a time interval of 10 minutes prior to the occurrence of TdPs in the LQTS patients (dLQTS and cLQTS) and in 10 minutes intervals prior to the maximum QTc prolongation in healthy individuals. Then, we computed the changes in these parameters between these intervals and baseline periods of 10 minutes starting 70 minutes prior to TdPs in LQTS patients and 130 minutes prior to maximum QTc prolongation in healthy subjects. We opted for earlier baseline in the group of healthy because the drug was given orally.
3.
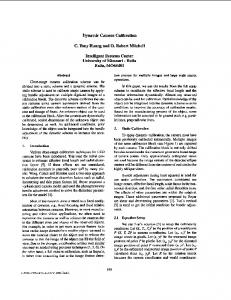
Figure 1: Example of ECG tracings of the onset of a druginduced TdPs in one of the dLQTS patients. Table 3. Average values of ECG parameters prior to the occurrence of TdPs and prior to maximum sotalolinduced QTc prolongation. dLQTS cLQTS Healthy (n=3) (n=2) (n=3) RR (msec) 1038±119 855±75 1038±91 QTc (msec) 555±34 597±75 478±21 TpTe (msec) 118±9 121±47 107±28 MadQTc 0.93±0.64 0.62±0.53 0.23±0.08 T-amp. (mV) -0.36±0.35 0.33±0.19 0.22±0.17 / (n.u.) 0.29±0.18 0.59±0.01 0.18±0.04 2 1 VPCs(n/10min) 60±20 47±66 0±0 dLQTS: patients with drug-induced TdPs. cLQTS: LQTS patients with spontaneous TdPs. Healthy: healthy on sotalol without TdPs.
Results
3.1. Repolarization profiles preceding the occurrence of TdPs The figure 1 provides an example of the occurrence of TdPs in one of the cardiac patients (age 77 yrs old). The 358
repolarization complexity are, in average, over 0.3 before the onset of TdPs in dLQTS and cLQTS. But, the 2/ 1 values in the dLQTS group are in average decreased just prior to TdPs (see upper panel, Figure 3). Importantly, the dynamic profile of heterogeneity versus QTc interval duration is very different between these groups. These results may reflect very different arrhythmogenic mechanisms involved in the triggering of TdPs.
3.2. Repolarization changes preceding the occurrence of TdPs Repolarization changes in reference to baseline periods for the three groups are provided in Table 4. First, the individuals on sotalol show large increase in RR values due to the bradycardic effect of sotalol. The increase of QTc interval is similar between groups (~80 msec) even in the group of patients exposed to sotalol who did not develop any TdPs. TpTe prolongation is not evenly increased between these groups, and lTdPs patients’ results revealed a shortening of TpTe interval prior to the occurrence of the TdPs. dLQTS are associated with TpTe interval prolongation (35±12 msec). Interestingly, the QTc variability (madQTc) is one of the factors presenting an increase in the groups developing TdPs while the variability is not changed neither high at baseline in the group of healthy individuals on sotalol who did not develop TdPs. Figure 2 illustrates the increased instability of repolarization measurements before the access of TdPs i.e. increased frequency of VPCs and increased beat-tobeat variability of other parameters. The amplitude of the T-wave is decreased on sotalol (dLQTS and healthy) but not in the group of cLQTS patients. Interestingly, the roundness of the T-loop is not increased in the two dLQTS patients prior to TdPs (standard deviation 0.26) while it is in cLQTS patients. 2/ 1 values remain unchanged in Healthy. All groups developing TdPs reveal a clear increase in frequency of TdPs (~40 VPCs/10min).
Table 4. Matrix of changes in ECG measurements for the three groups. dLQTS cLQTS Healthy (n=3) (n=2) (n=3) RR 128±75 31±56 216±134 QTc 74±12 78±26 80±9 TpTe 35±12 -49±91 21±15 MadQTc 0.7±0.4 0.9±0.1 0.1±0.1 T-amp. -0.06±0.08 0.06±0.04 -0.01±0.1 -0.07±0.26 0.12±0.19 0.03±0.03 2/ 1 VPCs 56±20 24±33 0±0 Same units than in Table 3.
4.
Discussion
We present an evaluation of the static and dynamic features of the repolarization segment from the surface ECGs of small groups of individuals who do and do not develop TdPs. An increased VPC frequencies and QTc variability were identified within the 10-minute interval prior to the onset of TdPs in both drug-induced and inherited LQTS patients. The QTc interval prolongations were present in all patients developing TdPs. Yet, the drug-induced QTc prolongation was not different between patients who do or do not develop TdPs on dlsotalol. The American Heart Association, the American Critical-Care Nurses and the International Society for Computerized Electrocardiography have highlighted the need for monitoring in-hospital patients with a risk for drug-induced QT prolongation and TdPs [11]. The authors note that QTc interval prolongation alone may not be sufficient to predict the occurrence of TdPs but repolarization heterogeneity of repolarization may also be necessary to produce the arrhythmogenic response. These article statements are consistent with our observations. Furthermore, Drew et al. emphasise that there is a need to better monitoring patients for TdPs and today we lack information about drug-induced TdPs in clinical settings and in any environments where cardiac safety needs to be evaluated (home monitoring). Based on our observations, we believe that the use of continuous monitoring of ECGs for the risk of TdPs should not be limited to report QTc interval duration but should be complemented by ECGbased measures of repolarization heterogeneity.
Figure 2: Monitoring of the repolarization parameters (RR, QTc, TpTe and VPCs). The grey arrows mark the start of the time of sotalol injection while the black arrows locate the onset of the first TdPs. Increased RR variability and repolarization instability are present between the two arrows. The increased complexity of the T-loop just prior to the occurrence of the TdPs is expected since it reflects a increased repolarization heterogeneity. The values of 359
[3]
[4]
[5] [6]
[7]
[8]
[9]
[10] [11]
Figure 3: Scatterplots of T-wave roundness versus QTcF values on beat-to-beat basis just prior to the occurrence of TdPs for the five patients with TdPs (lLQTS and dLQTS, 1 hour prior to event) and for the three individuals on sotalol (-TdP, 2 hours prior to max QTc prolongation on sotalol). Each level of gray plots corresponds to data from a specific patient.
C Antzelevitch, ZQ Sun, ZQ Zhang, GX Yan. Cellular and ionic mechanisms underlying erythromycin-induced long QT intervals and torsade de pointes. J Am Coll Cardiol 1996; 28, 7, 1836-1848. C Antzelevitch, S Sicouri, Clinical relevance of cardiac arrhythmias generated by afterdepolarizations. Role of M cells in the generation of U waves, triggered activity and torsade de pointes. J Am Coll Cardiol 1994; 23, 1, 259-277. DM Roden. A practical approach to torsade de pointes. Clin Cardiol 1997; 20, 3, 285-290. RR Shah, LM Hondeghem. Refining detection of druginduced proarrhythmia: QT interval and TRIaD. Heart Rhythm 2005; 2, 7,758-772. LM Hondeghem, TRIad: foundation for proarrhythmia (triangulation, reverse use dependence and instability). Novartis. Found. Symp 2005; 266, 235-244. JP Couderc. The Telemetric and Holter ECG Warehouse Initiative (THEW): a Data Repository for the Design, Implementation and Validation of ECG-related Technologies. Conf. Proc. IEEE Eng Med. Biol. Soc 2010; 978-1-4244-4124, 6252-6255. N Sarapa, J Morganroth, JP Couderc, S F Francom, B Darpo, JC Fleishaker, JD McEnroe, WT Chen, W Zareba, A J Moss. Electrocardiographic identification of drug-induced QT prolongation: assessment by different recording and measurement methods. Ann. Noninvasive. Electrocardiol. 2004; 9, 1, 48-57. F Badilin., The ISHNE Holter standard output format, Ann. Noninvasive. Electrocardiol. 1998; 3, 3, 263-266. BJ Drew, MJ Ackerman, M Funk, WB Gibler, P Kligfield, V Menon, G J Philippides, DM Roden, W Zareba. "Prevention of torsade de pointes in hospital settings: a scientific statement from the American Heart Association and the American College of Cardiology Foundation. Circulation 2010: 121, 8, 1047-1060.
Address for correspondence. Jean-Philippe Couderc Center for Quantitative Electrocardiography and Cardiac Safety 601 Elmwood Ave., Box 653, Rochester NY
[email protected].
Acknowledgements This work was supported by the National Heart, Lung, and Blood Institute of the U.S. Department of Healthy and Human Services grant # U24HL096556.
References [1] EH Locati, P Maison-Blanche, P Dejode, B Cauchemez, P Coumel. Spontaneous sequences of onset of torsade de pointes in patients with acquired prolonged repolarization: quantitative analysis of Holter recordings. J Am Coll Cardiol 1995; 25, 7, 1564-1575. [2] I Topilski, O Rogowski, R Rosso, D Justo, Y Copperman, M Glikson, B Belhassen, M Hochenberg, S Viskin. The morphology of the QT interval predicts torsade de pointes during acquired bradyarrhythmias. J Am Coll Cardiol 2007; 49, 3, 320-328.
360