Static Load Balancing of Hierarchical MPEG2 Video Streams Over VBR and ABR Services Ahmed Mehaoua1 and Raouf Boutaba2 1
University of Cambridge, Centre for Communications Systems Research 10 Downing Street Cambridge CB2 3DS - United Kingdom Email:
[email protected] 2
University of Toronto, Department of Electrical and Computer Engineering 10 King’s College Road Toronto, Ontario, M5S 1A4 – Canada – Email:
[email protected]
Abstract If compressed video services such as video on-demand (VOD) and TV broadcasting will be widely provided over ATM networks, the question arises as to which class of service and which congestion control scheme are suitable for the delivery of such inherently bursty traffic. In this paper we study through intensive simulation the capabilities of VBRrt and ABR associated with rate based congestion control for the transport of a unidirectional 2-layers VBR MPEG2 encoded video application. We compare the effectiveness of ABR binary feedback and ABR explicit rate control modes in case of carrying the enhancement video layer with various load-balancing configurations. To ensure a minimal display quality at the destination, we propose to convey the base layer with a guaranteed VBR-rt connection. To carry out the comparison, we use real MPEG2 video traces and data partitioning with static splitting between the two connections. For most practical cases, we have considered the variation of the switches buffer occupancy, the end-toend cell transfer delay (CTD), and the Cell Delay Variation (CDV) for various network configurations. We show that for one-way video applications, the mean end-to-end delay is below the recommended one second but at the cost of a larger buffer size at the destination due to excessive jitter and resynchronization requirements.
Keywords : ABR, MPEG, scalable coding, Delay, Jitter, EPRCA, EFCI.
1. Introduction An important set of emerging multimedia applications, such as live video-casts or television news, lie between the two extremes of interactive bi-directional and pre-recorded unidirectional video. In these applications, many users may be willing to tolerate a playback delay of several seconds and graceful picture quality degradation in exchange for smaller bandwidth and cost price requirements. The question arises as to which class of service and associated congestion control schemes are suitable for such flexible and adaptive video services. Broadband-ISDN provides multiple classes of service to potentially convey video applications: Constant Bit Rate (CBR), Variable Bit Rate (VBR), Available Bit Rate (ABR), and Unspecified Bit Rate (UBR) [1].
In 1995, the ATM Forum has specified that MPEG2 encoded Video-On-Demand (VOD) may be carried by Constant Bit Rate (CBR) using AAL5 [2]. This requires the use of a local buffer at the source for smoothing but ease the admission control process. Besides, it’s commonly accepted that for video encoded applications, the use of CBR coding can result in perceptible picture quality variation and bandwidth waste [3]. Therefore, ATM Forum’s SAA and TM sub-working groups are currently addressing the transport of unrestricted (i.e. open loop) VBR MPEG2 video over either VBR-rt or ATM Block Transfer with Delayed Transmission (ABT-DT) [4]. More recently, a hybrid of the CBR and VBR approaches, called Renegotiated CBR (RCBR), attempts to combine the simplicity of admission control for CBR with the greater statistical multiplexing gains of VBR-real time [5]. However, RCBR needs to predict an effective bandwidth over long intervals, and thus it requires an accurate model for the distribution of sources rates over long time scales [6]. In the other hand, best effort services, such as Available Bit Rate (ABR), are based on the excess bandwidth in the network with an expected lower usage cost. Moreover, Admission control for ABR is based on the minimum cell rate (MCR) negotiated at the connection setup and it is non existent in UBR. Consequently, they provide the same simplicity as CBR for admission control phase. With the ABR Explicit Rate (ER) control mode, in-band Resource Management (RM) cells are periodically transmitted by sources to notify the desired bit rate. If the network is unable to provide the requested bandwidth, it may just adjust the Allowed Cell Rate (ACR) value before returning the RM cell back to the source. This is a kind of rate renegotiations between the source and the network, which is performed at a shorter time scale than RCBR and thus provides better statistical multiplexing gain than CBR. Therefore, although ABR is intended for non-real time applications, it is an attractive and economical candidate for the transport of delay flexible video applications such live video broadcast and one-way video-on-demand. Consequently in this paper, we are considering ABR for the transmission of the enhancement sub stream of a hierarchically encoded MPEG2 application using data partitioning. We are assuming that a guaranteed ATM service class distinctively carries the base layer, which is in this study a VBR connection with PCR reservation. The overall objective of this work is to assess the ATM layer end-to-end performance for supporting a hybrid VBR/ABR connection for transmitting respectively the base layer and the enhancement layer of a scalable one-way MPEG2 encoded video application.
We study the effect of various network/source parameters on the variance of the buffer occupancy, the Cell Transfer Delay (CTD) and the Cell Delay Variation (CDV) of a 2-layer VBR/ABR reference video communication. Examples of these parameters include, the data partitioning ratio (i.e. load balancing factor) and the ABR rate-base control mode (i.e. EFCI Binary or Explicit Rate). The measured experimental results are those of the worst case scenario, since no buffering or traffic smoothing is performed at the sources. The paper is structured as follows. We briefly review, in section 2, MPEG2 compression principles and the various scalable coding modes provided by the standard [7]. Section 3 is devoted to the description of the statistical properties of the reference video connection and the hybrid VBR/ABR load balancing service. In section 4, we present the simulation model, as well as the targeted Quality of Service (QoS) parameters and the investigated scenarios. Finally, we discuss the results in section 5 and present our conclusion.
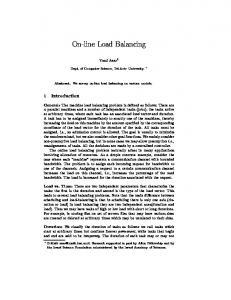
2. Layered MPEG2 Video Coding. 2.1 MPEG2 Compression principles There are three different frame types in MPEG2, which are distinguished by the used compression algorithm: Intra-coding (i.e. I frames), Predictive coding (i.e. P frames) and Bi-directional predictive coding (i.e. B frames). In the order of increasing coding efficiency, a typical arrangement is composed with periodic interleaving of frames from each mode.
(a)
(b)
Figure 1 – Frame displaying and transmission/decoding orders
This deterministic sequence is called Group Of Pictures (GOP) and is illustrated in Figure 1.a. According to the impact on picture quality, I frames and P frames are essential and require more bits than B frames.
Since a B-frame depends on reference pictures in the future and in the past, the decoder is not able to display it until its both reference frames have been correctly received. To overcome this problem, the transmission and decoding order is different from the display one (see Figure 1.b). Thus, conforming to the MPEG standard, we used the frame transmission order during our simulations.
2.2 MPEG2 Scalable Coding Modes Four scalable compression modes are defined in the MPEG-2 toolkit [7]. These coding techniques subdivide MPEG-2 video flows into numerous layers (base, middle, and high layers) mostly for prioritizing and interoperability purposes. At the destination, the lowest priority bitstreams (i.e. middle and high layers) can be added to the high priority base layer to provide a better display quality. Brief summaries of these modes are given below. •
Spatial scalability: this mode codes a base layer at lower sampling dimensions (i.e. resolution) than the upper layers. This mode is useful in simulcasting, where a standard TV set needs only to decode the 720 x 480 base channel, and leave the higher 1440 x 960 data for HDTV terminals.
•
Temporal Scalability: the higher priority bitstream codes videos at a lower frame rate (Hz), and the intermediate frames are coded in a second bitstream.
•
SNR Scalability: the layers are coded at identical sample rates, but with differing picture quality (through different quantization step sizes (Q)).
•
Data Partitioning: it is a frequency domain method that breaks the block of 64 quantized transform coefficients into two bitstreams. The first, higher priority bitstream contains the more critical lower frequency coefficients and side information (such as DC values, motion vectors, headers...). The second, lower priority bitstream carries the remaining higher frequency AC dat a.
Other scalability modes have been experimented with MPEG-2 video, such as Frequency Scalability, but were eventually dropped in favor of simpler methods that demonstrated similar quality.
3. The Hybrid VBR/ABR Reference Connection. Due to implementation complexity, only few MPEG2 codecs provide all the scalable capabilities defined by the ISO standard. In addition, most encoders are implemented by software and are thus time consuming.
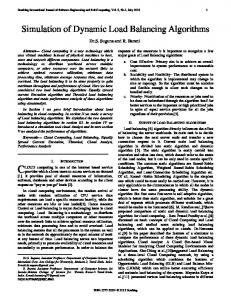
For instance, the time needed to compute all the motion vectors of a 61-frames CCIR-6011 704x480 (4:2:0) sequence is in the order of magnitude of days (i.e. three) using a DEC workstation. Figure 2 depicts the bit rate per frame for respectively the single, the base and the enhancement layers of a 2-seconds test sequence using spatial scalability. The base layer is in SIF (Standard Interchange Format) which is a non-interlaced 4:2:0 chrominance format with spatial dimensions of 352 x 240. It is actually the same format used for MPEG-1. As to the enhancement layer, it provides the complementary data to achieve a full screen format of 704x480. We observe that the aggregate video data are approximately split in a proportion of 30% for the highest priority base layer and 70% for the lowest priority enhancement layer. Figure 2 - Frame size traces of a Layered MPEG2 sequence using spatial scalability 18 16
___ single layer _o_ base layer (SIF) ----- enhanced layer (D1)
14
Bit rate [Mbps]
12 10 8 6 4 2 0 0
10
20
30 Time-slot [33 msec.]
40
50
60
Figure 2 – Frame size traces of a 2-layer MPEG2 sequence using spatial scalability
Therefore, for our simulation analysis, we rather use static data partitioning to generate two complementary sub-streams from a single layer MPEG2 encoded video sequence. The splitting approach we use allows us to approximate an actual scalable codec. It precisely consists to divide the aggregate output bitstream by a ratio, named Load Balancing Factor (LBF) ranging from 0.1 to 0.9, to generate two sub streams transmitted separately with VBR and ABR services with respectively LBF*AvCR and (1LBF)*AvCR bitrate. ‘AvCR’ corresponds to the aggregate Average Cell Rate of the application. This partition is assumed static for every frame during each simulation scenario.
1
CCIR Rec. 601-2 specifies the picture, acquisition semantic, and parts of the coding for digital standard television signals (NTSC, PAL and SECAM international standards).
The reference 2-layer MPEG2 video sequence has been encoded using the INRS-Telecom codec. The original ’TV News’ video sequence has been compressed using the following parameter set: GOP pattern: N=12 (24 fps) and M=3. Quantizer scales: 10 (I), 14 (P), 18 (B). Encoder input NTSC CCIR- 601 704x480 pixels with 24 bit color resolution. The total number of transmitted frames is 240, which corresponds to 10 seconds simulation time. Figures 3a and 3b summarize the most important moments of the reference frame sizes for both sub-layers for various Load-Balancing Factors (LBF). These metrics are: the minimum cell rate (MCR); the Average Cell Rate (AvCR) and the Peak Cell Rate (PCR). The corresponding Peak-to-mean ratio (B) is equal to 4.16 and gives us a measure of the burstiness level for the studied sequence. By way of comparison, the peak-tomean ratio of limited scene-changes sequence such ’TV talk-show’ is 2.8, whereas for the complex ’StarWars’ sequence is 5.0 [8]. Since the sub-layers are statically generated from the same original bit stream, a symmetrical linear variation of the bit rates is visible in the two Figures.
Figure 3a – Base layer bit rates of the reference connection (VBR)
Figure 3b – Enhancement layer bit rates of the reference connection (ABR)
4. Simulation Methodology 4.1 Performance Parameters In this study, the evaluated performance parameters are the end-to-end cell transfer delay (CTD) and the 2point CDV. These quality of service (QoS) parameters are measured individually for the two sub-streams (VBR, ABR) of the reference connection. Emphasis is on the variation of these metrics at the cell level for each MPEG frame type sub-flow (I, P, and B). In order to accurately measure the impact of different switch control algorithms on the delay variation, the buffer queue lengths are also monitored. We briefly remind in the following the definitions of these metrics. The End-to-end Cell Transfer Delay (CTD): is the time, DK = t0 K − tiK , between the departure of cell K from the source node ( tiK ) and its arrival at the destination node ( t 0 K ). We assumed that cells are neither lost nor discarded during the transmission. Indeed in this paper, we assume that the base layer and the enhancement layer are respectively carried by guaranteed loss-free VBR and ABR connections with switch buffers practically large enough to accommodate all incoming cells (i.e. buffer of infinite size). The Cell delay variation (CDV) : is the variation of the periodic cell arrival process at the destination end. There are actually two performance parameters associated with CDV, 1-point CDV and 2-point CDV [9].
The 1-point CDV ( yK ) for cell K at the destination end is the difference between the cell’s reference arrival time ( cK ) and the actual arrival time ( a K ) at the destination end:
yK = cK − a K The reference arrival time ( cK )is defined as follows :
c0 = a0 = 0 cK + Tmin cK +1 = a K + Tmin
if cK ≥ a K otherwise,
Where Tmin is the inverse of the Peak Cell Rate (PCR) of the target stream. In VOD environments, video streams are previously encoded and stored, which allows setting the value Tmin to the largest encoded frame size Pmax . The 2-point CDV ( vK ) for cell K is defined as the difference between the end-to-end delay experienced by this cell DK and that experienced by cell 0 ( D0 ).
vK = DK − D0
4.2 Network Simulation Model A discrete event-driven simulator written in C is used. We consider a simulation model consisting of two ATM switches (SW1 and SW2), a bottleneck link (L) and a number of background connections crossing these switches as shown in the following figure. The distances between the source/destination and the switch nodes are constant and set to 0.2 km (i.e. 0.125 miles). The switch-to-switch link distance is equal to 1000 km (i.e. 625 miles), which introduces a propagation delay of 5 ms for an optical medium having a speed of 200,000 km/s. The VBR/ABR reference video connection is generated using frame traces of a ‘Tennis’ video sequence. The main traffic and coding parameters of the MPEG video sequence are summarized in Table 1. Reference video sequence Compression Ratio (X:1) Quantizer scale GOP pattern (N=12 M=2) Mean Cell Rate (Mbps) Peak Cell Rate (Mbps) Peak/Mean ratio
121 P : 14 IBBPBBPBBPBB 0.55 1.58 2.87
Table 1 - Coding parameters and traffic descriptors of the reference video connection
The background traffic consists of a number of ABR and VBR connections crossing each switch. In our model, all background streams exit at the output of each stage, and new traffic is added at the input of the next stage. Each ABR connection belonging to the ABR background obeys to the ABR source/destination
behavior. We believe that this model representing the worst case traffic scenario is the most suitable for accurately evaluating the end-to-end delay variation. Indeed, when all the background connections originating from the source side sustain the path of the reference connection, all delay variations occur at the first switch queue (SW1) since there is no contention between the cells at the subsequent node (SW2).
Source
VBR background
VBR background
Destination VBR Mpeg2
VBR Mpeg2
AT M S wi tch 1
ABR Mpeg2
Link OC-3
AT M S wi tch 2
ABR Mpeg2
ABR background
ABR background
Figure 4 – Network Simulation Model
The ABR background connections are characterized by an ON-OFF process with a mean burst length of 2 ms, a mean interval between bursts of 0.5 ms and a bit rate at which cells are generated during the ON periods of 100 Mbps. For the VBR background we generate 50 MPEG video connections using the ’StarWars’ MPEG-1 frame traces [10]. The aggregate mean cell rate and peak cell rate of the background VP are respectively 18 Mbps and 212 Mbps. These 50 connections share the same VP but start transmitting at different instant in the range [0, 0.5 sec.]. We have noticed that the deterministic and periodic video frame pattern (i.e. GOP) of the encoded video traffics of the VBR background plays a very important role on the buffer occupancy and thus on the delay variation which confirms the observation in [11]. Besides, we also assume that the MPEG codec output rate are constant during the transmission of one frame and corresponds to the value (frame_size*fps) for each video connection. The level of congestion is monitored through the switch buffer occupancy. In this paper, we assume shared output FIFO buffers with two congestion thresholds. When the buffer occupancy exceeds the High Threshold (HT), a congestion flag is set. When the buffer occupancy drops below the Low Threshold (LT), the congestion flag is cleared. We also assume that there are two input queues with different priorities at each switching node, namely the VBR queue (VBR Q) and the ABR queue (ABR Q). Depending on their type of service, arriving cells are stored in corresponding queues. Cells in the VBR queue have priority over cells in the ABR queue, i.e., only when the VBR queue is empty ABR traffic is sent.
For all proposed scenarios, the processing delay at the ATM layer is not explicitly modeled. We assume that its contribution to the end-to-end delay experienced by each cell is relatively constant, and thus it can be omitted.
4.3 Simulation Configurations We use the previous network model with different simulation scenarios. These scenarios are grouped into two classes according to the ABR control algorithm performed by the switches. To evaluate the impact of rate-based flow control schemes on network performances, we compare the binary feedback and the explicit rate switch modes in their ability to efficiently carry a multi-layer video stream. We briefly present the two ABR switch modes and their simulation setup parameters, as well as the description of the derived simulation scenarios. 4.3.1 ABR Switch mode 1 : EFCI Binary marking.
According to [1], the ABR flow control algorithm supports two modes of switch operation: binary feedback and explicit rate (ER). In the binary mode, when a switch detects congestion, it sets the Explicit Forward Congestion Indication (EFCI) state in the headers of outgoing data cells. In this mode, the EFCI state information is saved at the destination and transferred to the CI bit of a turn-around RM cell. Upon receiving a backward RM cell, the source can either perform an additive increase (RIF) or a multiplicative decrease (RDF) in its rate in relation with the value of the CI bit.
The main parameters associated with this feedback scheme are set to : Rate increase factor (RIF) : 1/16
Minimum cell rate (MCR) : 0
Rate decrease factor (RDF) : 1/16
High congestion threshold (HT) : 15
Initial cell rate (ICR) : 7 Mbps
Low congestion threshold (LT) : 10
For the scenario 1, the ABR switch scheme is EFCI with a static load balancing factor (LBF) of 0.9, which corresponds to 90 % of the single layer video data transmitted through the VBR connection. The remaining 10% is transmitted over a distinct ABR VC. The scenario 2 is similar to the first but with LBF equal to 0.7. Finally, scenarios 3, 4 and 5 have respectively LBF equal to 0.5, 0.3 and 0.1. 4.3.2 ABR Switch mode 2 : Explicit Rate using EPRCA
In the Explicit Rate (ER) mode, the switch employs a control algorithm for managing the bandwidth among the virtual circuits crossing the switch. In addition to load monitoring and congestion detection, the switch performs an explicit rate calculation function. Through continuous monitoring, the switch computes maximum allowed cell rate (ACR) for each of its active ABR Virtual Circuits (VC). This ACR value is
then written into corresponding RM cells, and when the source receives the backward RM cell, its current bit rate is adjusted by the explicit rate contained therein. However, ER switch algorithms are not standardized by the ATM Forum, and are therefore implementation specific. A number of switch algorithms have been proposed recently [6]. In this study, we use the EPRCA scheme as defined in [12] for comparative purpose. The EPRCA scheme computes a mean allowed cell rate (MACR) using exponential weighted averaging. The fair bandwidth share of each connection is then set to a fraction of this calculated MACR if necessary, i.e., if the current cell rate indicated in the RM cells is larger than the fair share. As a congestion indication this scheme uses the queue length. If the preset threshold QT is exceeded the switch is said to be in congestion mode. MACR = (1 − EAF ) * MACR + EAF * CCR Fairshare = SW _ DPF * MACR
Where EAF is the exponential averaging factor and CCR is the current cell rate of the connection. These both parameters are indicated in the RM cells, while SW_DPF is a multiplier factor named ‘Switch Down Pressure Factor’ and set close to but below 1. Various simulation studies [13] suggest that the appropriate value for EAF and SW_DPF are respectively 1/6 and 7/8, while the initial MACR and the Queue Threshold (QT) are respectively set to PCR and 15. Similarly to EFCI, five scenarios are defined with LBF equal to 0.9, 0.7, 0.5, 0.3 and 0.1. In all our simulation scenarios, we have adjusted the background traffic to achieve a maximum bandwidth utilization of the bottleneck link (L). The measured average throughput crossing this link is varying from 87.34 to 89.96 %.
5. Simulation Results 5.1 Impact on Queue Length Figure 5a, 5b and 8 present the variation of the buffer queue lengths as function of the Load Balancing Factor. The first observation concerns the proportional increase of the average number of cells in the queue. Indeed, by comparing the five curves of Figure 8., it can be seen that the plot shapes are similar. Alternatively figures 5a and 5b show the advantage of EPRCA over the EFCI scheme. The mean occupation ranges from 14 cells for LBF equal to 0.1 to a maximum of 138 cells for LBF equal to 0.9. It is also interesting to note that this variation does not depend on the ABR control mode (EFCI, EPRCA). One should expect a correlation between the ABR and VBR queues, but this is not the case here. Indeed, due to
the separation in two distinct queues and the used service discipline which favor high priority VBR traffic over ABR one, we can consider that the average transit delays are closely depending on the number of VBR background load. This mean transit delay is bounded to 64.4 ms in the worst case scenario, i.e., of 50 simultaneous background video connections.
Figure 5a – VBR Mean Queue Length in Switch 1 and Switch 2
The CTD experienced by I-frames are the most important in comparison to the other frames. In the worst case corresponding to the enhancement layer with EPRCA, it reaches 782 ms, while for P and B substreams is respectively to 668 and 778 ms. In unidirectional video services, the tolerated CTD is 1 second [2].
Figure 5b – ABR Mean Queue Length in Switch 1 and Switch 2
We note that the average occupation for the ABR queues is increasing linearly for the two ABR controls with a minimum value of 259 cells for EPRCA with LBF equals to 0.1, and a maximum value of 1601 cells for EFCI with a similar LBF. Besides, in all other LBF cases the ER mode minimizes buffer oscillations. Figure 8 - VBR Queue length variation in SW1 1200
Queue length [Cells]
1000
.... LBF=0.1 ---- LBF=0.3 -.-. LBF=0.5 ___ LBF=0.7 ___ LBF=0.9
800
600
400
200
0 0
1
2
3 Time [Seconds]
4
5
6
Figure 8 – VBR Queue Length Variations in Switch 1
The last set of Figures (Figures 11.a, b, c, d) show the effect of varying the LBF ratio on the instantaneous ABR switch buffer occupancy for EFCI and EPRCA.
5.2 Impact on Cell Delay Variation In Figures 6.a, 6.b and 7 the average end-to-end cell transfer delay for each cell class (I, P and B) is illustrated for various LBF values. It is interesting to notice that for both ABR with EPRCA and VBR connections, the experienced mean CTD of I-frame cells are greater or equal to those of other frame type cells. This can be explained by the impact of Intra coding on the output frame size and subsequently on the source cell rate and switch buffer occupancy. Except for Figure 6b, which depicts the variation of the mean CTD for the enhancement layer using EPRCA, the more the load balancing factor increases, the more the mean delay increases. Besides, regardless to the used rate-base mechanism, the LBF value that minimizes the mean CTD for each subflows of the reference connection, is 0.2. However, for the reference VBR connection the CTD of any subflow is bounded by a mean value of 64 ms, whereas for ABR stream the average end-to-end transit delay seems to be out to acceptable bounds. Indeed, for most load-balancing configuration the experienced ABR cell delays are above the recommended upper bound of 150 ms for video applications [14].
It appears that for a heavy loaded wide area networks with approximately 85-90 % bandwidth utilization and 1000 km link length, the ABR service with the presented control schemes is not suitable for transmitting interactive two-ways video applications with stringent temporal requirements such as videoconferencing.
Figure 6a – Mean CTD of I, P, and B cells using EFCI (ABR Enhancement layer)
Figure 6b – Mean CTD of I, P and B frame cells using EPRCA (ABR Enhancement layer)
Despite of these excessive measured delays lighter network configuration, such as LANs associated with more efficient buffer cell scheduling algorithms, will provide better network performance regarding to unidirectional video retrieval services.
Figure 7 – Mean CTD for I, P and B frame cells (VBR Base layer)
5.3 Impact on Cell Delay Variation From the mean 2-point CDV curves (Figure 9a and 9b) and the Figures 6.a and 6.b (mean CTD) the following observations can be done.
Figure 9a – Mean 2-point CDV for I, P and B frame cells using EFCI (ABR Enhancement layer)
Firstly, the distribution of the mean 2-point CDV is identical to the distribution of the mean end-to-end delay, with a difference of a D0 time-shift. By definition, the 2-point CDV strongly depends on the
random variable D0 . This means that from one simulation run to the other the collected 2-point CVD statistics may be very different.
Figure 9b – Mean 2-point CDV for I, P and B frame cells using EPRCA (ABR Enhancement layer)
Secondly, the 2-point CDV defined in section 3 can be related to the calculation of the optimum sizes of the destination codec buffer. Indeed in [15], it has been shown that the optimum buffer size must be at least equal to twice the value ( Dmax - Dmin )/ Tmin . The numerator is the maximum of the 2-point CDV calculated at the minimum possible value of D0 = Dmin .
Figure 10 – Recommended codec buffer size at the destination to cope with the CTD
In our case study, this minimum ( Dmin ) is equal to a one-way trip to the destination with empty buffer along the path for the reference VBR connection and the smallest occurring cell delay for the reference ABR connection. The denominator corresponds to the inverse of the Peak Cell Rate (PCR) of the targeted connection. In VOD, video streams are previously encoded and stored, which allow us to set the value
Tmin to the largest encoded frame size Pmax . As depicted in Figure 10., the best results are obtained when LBF
is superior to 0.7. Indeed, the
3
recommended destination buffer size is then below 128x10 cells. A minimum of 50x103 cells is achieved when LBF is equal to 0.9 and regardless to the used ABR control modes.
6. Conclusion Available Bit Rate (ABR) service has been initially developed to carry non real-time bursty data. Because MPEG2 video sources are rate adaptive and scalable, the ABR service has the promise of supporting compressed video as well. Indeed, the ABR protocol allows the network to control the source rate directly. ABR schemes can then be adapted to control compression ratio at the codec sources, in addition to controlling cell-loss rates. Moreover, if the Sustained Cell Rate (SCR), which is selected for the VBR connection, is chosen to correspond to the Minimum Cell Rate (MCR) required by the video encoder to ensure an acceptable video display, the Available Cell Rate (ACR) determined by the ABR scheme may be used to specify the Current Cell Rate (CCR) for the ABR enhancement video connection. Therefore, in this paper we have studied through intensive simulation the suitability of a hybrid VBR/ABR connection for the transport of a 2-layer MPEG2 encoded streams. We evaluated the effectiveness of the ABR binary feedback and Explicit Rate control modes in situation of carrying the enhancement MPEG2 sub-stream with various static load-balancing configurations. To carry out the comparison, we used actual MPEG2 video traces and data partitioning. During the simulation, the output video streams are not smoothed using any buffering techniques at the source, which leads to the worst case scenario for the investigated experimental results. For most practical cases, the impact of changing some network parameters, such as the load balancing factor and the ABR switch control algorithm, on the network performance have in the given order the most significant effect on the buffer occupancy, the mean Cell Transfer Delay, and the Jitter. From the evaluation results, we noticed that the I-frame cells experienced the highest end-to-end delay but they never exceeded the 1-second required for one-way video (Video on Demand or TV broadcast).
Finally, if such compressed video retrieval applications with flexible temporal constraints will be widely provided over ATM networks, the use of scalable MPEG2 coding associated with best effort services may maintain high throughput during network overloads with an expected picture quality enhancement.
7. References [1] ATM Forum, Traffic Management Sub-Working Group, "Traffic Management Specification 4.0", at-
tm-0056.000, April 1996. [2] ATM Forum, "Audio visual Multimedia Services: Video on Demand v1.0", Service Aspects and
Applications Sub-Working Group , ATM Forum/95-0049, December 1995. [3] D. Reininger, B. Melamed and D. Raychaudhury, "Variable bitrate MPEG video: characteristics,
modeling and multiplexing", International Teletraffic Congress, June 1994, pp. 314-319. [4] ATM Forum, Service Aspects and Applications Sub-Working Group, "VBR MPEG2 specification",
draft, January 1997. [5] M. Grossglauser, S. Kershav and D. Tse, ‘RCBR : A Simple and Efficient Service for Multiple Time-
scale Traffic’, ACM SIGCOMM ’95, Cambridge, USA, September. 1995. [6] T.V. Lakshman, P.P. Mishra, K.K. Ramakrishnan, ‘Transporting Compressed Video over ATM
Networks with Explicit Rate Feedback Control’, IEEE INFOCOM ’97, Kobe, Japan, March 1997. [7] ISO/IEC 13818-2 MPEG-2, "Information Technology - Generic Coding of Moving Pictures and
Associated audio", 1995. [8] P. Pancha and M. El Zarki, 'Prioritized Transmission of Variable Bit Rate MPEG Video', IEEE
GLOBECOM'92, Orlando, FL, December 1992, pp. 1135-1139. [9] M. W. Garrett, "Contribution toward real-time services on packet switched networks". Ph.D. thesis,
Columbia University, 1993. [10] ITU-T recommendation I.356, "B-ISDN ATM layer cell transfer performance", Geneva, November
1993. [11] O. Rose and M. Frater, ‘Impact of MPEG Video Traffic on an ATM multiplexer’, IFIP High
Performance Networking ’95 (HPN’95), Palma, Spain, September. 1995, p.157-168. [12] L. Roberts, "Enhanced Proportional Rate Control Algorithm (EPRCA)", ATM Forum/94-0735R1,
August 1994. [13] Y. Chang, N. Golmie, and al., "Simulation study on the new rate-based PRCA traffic management
mechanism", TM SWG, ATM Forum/94-0809, September 1994. [14] Raif O. Onvural, "Asynchronous transfer Mode Networks : Performance Issues", Artech House, 1994. [15] H. Naser and A. Leon-Garcia, "A simulation study of Delay and Delay Variation in ATM Networks,
Part 1 : CBR Traffic", IEEE INFOCOM'96, San Francisco, March 1996.
Figure 11a – ABR Queue Length Variations in Switch 1 using EFCI
Figure 11b – ABR Queue Length Variations in Switch 1 using EFCI
Figure 11c – ABR Queue Length Variations in Switch 1 using EPRCA
Figure 11d – ABR Queue Length Variations in Switch 1 using EPRCA