and database marketing (Bennett and Campbell, 2000) [13]. For linear .... parameter tuning, RBF Kernel with SMO reg, Normalized polynomial and Polynomial.
Support Vector Regression degradation modeling for Constant Fraction Discriminator Adithya Thaduri, Lulea University of Technology, Sweden A K Verma, Stord/Haugesund University College, Norway Uday Kumar, Lulea University of Technology, Sweden V Gopika, Bhabha Atomic Research Centre, India Rajesh Gopinath, Bhabha Atomic Research Centre, India D Datta, Bhabha Atomic Research Centre, India
Abstract: In the nuclear industries, the electronic signal processing unit plays a key role in the data processing, data analysis, control mechanism and more importantly safety of the nuclear reactor. The processing unit comprises of different modules that process pulse and current signals from detector and constant fraction discriminator which has higher criticality is one of them. Earlier the reliability was calculated using MilHdbk 217 standard and found discrepancies to the field failure. This paper studies the failure phenomenon using physics of failure approach by studying degradation and failure analysis and conducting the experiments using modified physics of failure methodology. Support vector machine (SVM) is a machine learning phenomenon using statistical learning theory. In this paper, failure data is fed to SVM for regression models intended for life prediction. From the parametric analysis, it was found that Sequential minimal optimization with RBF kernel represent the best model for degradation of the CFD. This method provides higher accuracy compared to response surface methodology. Keywords: Constant Fraction Discriminator, Kernel, Physics of Failure, Regression, Response Surface Methodology, Support Vector Machine 1. Introduction The reliability of electronic systems, used in nuclear power plants, is traditionally estimated with empirical databases such as MIL-HDBK-217 [1], PRISM etc. These methods assign a constant failure rate to electronic devices, during their useful life. The constant failure rate assumption stems from treating failures as random events. Currently, electronic reliability prediction is moving towards applying the Physics of Failure approach [2] which considers information on process, technology, fabrication techniques, materials used, etc. Even alone Physics of Failure does not provide the reliability of the device. So amalgamation of deterministic and probabilistic analysis is carried out. For the most of the electronic components, the standard MilHdbk method was implemented in order to find the time to failure. But for the customized electronic components like Constant Fraction Discriminator using different technologies, this method cannot be applied as there was no proper model associating with it. Further, these new microelectronic devices often exhibit infant mortality and wear-out phenomena while in operation. Hence physics of failure approach was implemented on these components which laid emphasis on competing failure mechanisms such as electro migration, hot carrier injection, dielectric breakdown etc., that makes a device’s useful life different from that predicted by empirical methods. The dominant failure mechanism that leads to device failure was found by realistic approach to reliability prediction. 1
Neutron Flux Monitoring System-NFMS [3]- comprises of different modules (Pulse Translator, Logarithmic Count Rate, Mean-Square Value Processor etc) that process pulse and current signals from detector. Besides, there are modules that generate trip signals. Trip signals are of 24V level and optically isolated. It is worthwhile to study the failure mechanisms of the components involved in the signal processing chain of NFMS, as its reliability is being evaluated with conventional MILHDBK-217 method. The physics of failure study of these components will generate reliability data that can be eventually compared with the MTBF figures provided by MILHDBK-217. A few components have been identified in this regard-They form a part of trip signal generation which has direct implication on safety. 4N-36: Optocoupler, AD-620: Instrumentation Amplifier, OP-07: A general purpose operational amplifier etc., are widely used in the trip modules of NFMS. So it is beneficial to start the P.O.F study with these components. Another candidate chosen for study is CFD-2004.This chip is used in the pulse processing circuits of NFMS. It is an indigenously developed ASIC which uses BJT process technology. Constant fraction discriminator (CFD) is another device which is failing regularly in the field. This device is made up of BJT technology. It is a level discriminator at which it provides a pulse when the analog input reaches particular voltage level. The possible failure mechanisms for this device was electro migration and hot carrier injection. The temperature and radiation considered as stress parameters. These parameters effects the operation of BJT transistors inside to behave as it reduces the output voltage which further reduces the performance parameter which is in this case is voltage of output pulse. Constraint in the experimentation is that both the stress parameters cannot be applied simultaneously instead one after another. Effect of individual parameter is quantified on voltage output and degradation of whole device is studied. Selection of stress levels can be carried out by using Design of Experiments (DOE) [4] and accelerating testing [5] was implemented. Since there is no sufficient model for this device, modelling is to be carried out by probabilistic analysis. From the model, relation between design parameters and time to failure is observed and provided to designer. Support Vector Machine (SVM) is a learning algorithm developed by Vapnik 1995 [6] and later improved in Vapnik 1998 [7] and Shawe-Taylor and Cristianini 2004 [8]. It is sophisticated method prevents from overfitting of the data when compared to artificial neural networks. It is extensively used in pattern recognition, prediction, classification and regression in image processing, bio-medical sciences and other fields. The SVM uses several linear and non-linear kernel functions to measure the similarities between data, and the decision function is represented by an expansion of the kernel function selected. Support Vector Regression (SVR) utilises the regression analysis from SVM with the expansion of kernel functions. This SVR was applied to the testing data for the reliability prediction of CFD. This paper characterized the data obtained from the design of experiments and the accelerated testing to generate model and respective kernel function by sensitive analysis using the regression by classification. The degradation of the output voltage happened due to the application of stress parameters in a non-linear way, hence several non-linear kernel 2
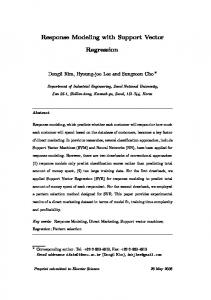
functions was implemented and tested to quantify which of the kernel and its parameters suit the model with higher accuracy. 2. Reliability Prediction using Physics of Failure Approach The following methodology demonstrated in Figure 1 was implemented on reliability prediction of constant fraction discriminator using support vector machine. Component Description
Failure Phenomenon
Failure Mechanism and Stresses
Experimental Testing
Design of Experiments & Accelerated Testing
SVM Methodology
Data Analysis
Sensitivity Analysis
Figure 1: Prediction Methodology 2.1 Component Description The electronic component of interest in this paper is Constant Fraction Discriminator. The construction, material characteristics, processes, operation and functioning of CFD is explained in this section. 2.2 Failure Phenomenon From the literature survey and field inspection, the dominant failure mechanism and correspondingly the dominant stresses is analyzed. These stresses tend to degrade the performance parameter and a failure criterion is set at which it reaches the threshold level. 2.3 Experimental Testing In order to test the component with stresses and its levels, design of experiments and accelerated testing are implemented to fail the component. A test circuit is designed and applies the input stress parameters to find the output at different runs. 2.4 SVM Methodology The phenomenon of support vector machine is explained and a methodology is introduced. 2.5 Data Analysis The data obtained from the DOE and accelerating testing is selected and combined for SVM modeling by finding the best kernel function and its function variables by using sensitivity analysis. A model is generated by selecting least error. 3
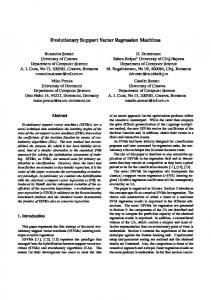
3. Reliability Prediction of CFD The methodology proposed in figure 1 was implemented on constant fraction discriminator. 3.1. Component Description Discriminators generate logic pulses in response to input signals exceeding a particular threshold. In general, there are two main types of discriminators, the leading edge discriminator and the constant fraction discriminator. The leading edge discriminator is the simpler one. Given an input pulse, the leading edge discriminator produces an output pulse at the time when the input pulse crosses a given threshold voltage. This, however, causes a problem in situations where the timing is important. If the amplitude is changed, but the rise time of the input pulse remains the same, a sort of “time walk” occurs (Figure 2) [9]. That is, an input pulse with smaller amplitude but with the same rise time as a larger pulse will cross the threshold at a later time. Thus, the timing of the output pulse is shifted by this change in amplitude.
Figure 2: Leading Edge Discriminator and “Time Walk” The constant fraction discriminator alleviates this problem by using a constant fraction, f, of the input pulse to precisely determine the timing of the output pulse relative to the input signal. It does this by splitting the input signal (Figure 3): attenuating one half so that it is a certain fraction, f, of the original amplitude (Figure 4), and delaying and inverting the other half (Figure 5). The attenuated pulse and the delayed and inverted pulse are then added together, and the zero crossing is computed (Figure 6). The zero crossing gives the time at which the CFD should create an output pulse, and is always independent of amplitude. For a simple linear ramp, like the one shown above, the equations for its input pulse, attenuated pulse, and delayed and inverted pulse are as follows: delay t d , fraction f , initial amplitude A,
input pulse Vi At , attenuated pulse Va fAt , delayed and inverted pulse Vd A(t t d ). 4
To find the zero crossing, set 0 Va Vd and solve for t : 0 fAt A(t td ) and tcross
td (1 f )
Ideally, the delay is chosen such that the maximum of the attenuated pulse crosses at the desired fraction of the delayed pulse. In that case, t d _ ideal t rise (1 f ) . However, if the delay is chosen smaller than td_ideal, CFD will operate at a fraction less than that of f. From equation 1, we see that tcross is independent of the amplitude of the input pulse. The CFD has a monitor output feature, which outputs the bipolar signal created by summing the attenuated and the delayed and inverted pulses, so that we can view how it is calculating the zero crossing [10]. As in Block diagram, Figure 6, in order to achieve a constant timing edge, it is customary to use an attenuator and a delay. The input signal is split. One part is delayed, and the other is attenuated. After these two signals are re-mixed, a comparator detects the zero cross points. The timing of the zero cross point is not influenced by the amplitude of the input signal [11].
Figure 2: Input pulse to CFD
Figure 4: Delayed and Inverted Pulse
Figure 3: Attenuated Pulse
Figure 5: Sum of Attenuated and Delayed pulse
5
Figure 6: Block Diagram of CFD 3.2. Failure Phenomenon Here we have taken Constant Fraction Discriminator CFD 2004 made by BEL, Bangalore, India. Comparators and flip flops as shown in Figure 6 consist of transistors made up of BJT Technology. So, the failure physics of these transistors at wafer level adversely affects the performance and failure of CFDs. As from the description, if the wave from the counter expects to cross at a threshold level, CFD must provide TTL pulse. Failure possibly happen if the threshold level at the input and the pulse width at the output varies in accordance with the prescribed level with the existing internal parameters. By the physics of failure approach, the stress parameters affect the BJT transistors to change their behavior of electrical hparameters. Commonly, when an electrical or temperature stress applied on the transistor, they develops reverse current from emitter to base to increase in such a way to degrade the performance of output electrical characteristics such as collector current and VCE voltage at the output. If these values changes inside the device, as all other devices are interconnected, this effective voltages and currents tend to vary at the larger levels of the whole device and output pulse width and time periods change. If this change is such a large that it can’t detect the input pulse providing the output TTL, then it is considered as failure. 3.2.1 Effect of Temperature The temperature dependence of bipolar transistors depends on a multitude of parameters affecting the bipolar transistor characteristics in different ways. Important effect is the temperature dependence of the current gain. Since the current gain depends on both the emitter efficiency and base transport factor [21]. The emitter efficiency depends on the ratio of the carrier density, diffusion constant and width of the emitter and base. As a result, it is not expected to be very temperature dependent. The carrier densities are linked to the doping densities. Barring incomplete ionization, which can be very temperature dependent, the carrier densities are independent of temperature as long as the intrinsic carrier density does not exceed the doping density in either region. The width is very unlikely to be temperature dependent and therefore also the ratio of the emitter and base width. The ratio of the mobility is expected to be somewhat temperature dependent due to the different temperature dependence of the mobility in n-type and p-type material. 6
The base transport is more likely to be temperature dependent since it depends on the product of the diffusion constant and carrier lifetime. The diffusion constant in turn equals the product of the thermal voltage and the minority carrier mobility in the base. The recombination lifetime depends on the thermal velocity. The result is therefore moderately dependent on temperature. Typically the base transport reduces with temperature, primarily because the mobility and recombination lifetime are reduced with increasing temperature. Occasionally the transport factor initially increases with temperature, but then reduces again. Temperature affects the AC and DC characteristics of transistors. The two aspects to this problem are environmental temperature variation and self-heating. Some applications, like military and automotive, require operation over an extended temperature range. Circuits in a benign environment are subject to self-heating, in particular high power circuits. Leakage current ICO and β increase with temperature. The DC β hFE increases exponentially. The AC β hfe increases, but not as rapidly. It doubles over the range of -55o to 85o C. As temperature increases, the increase in hfe will yield a larger common-emitter output, which could be clipped in extreme cases. The increase in hFE shifts the bias point, possibly clipping one peak. The shift in bias point is amplified in multi-stage direct-coupled amplifiers. The solution is some form of negative feedback to stabilize the bias point. This also stabilizes AC gain [22]. As from the studies from BJT technology, temperature and radiation is selected as stress parameters. The emitter and collector current of npn BJT is given Equations below
The output voltage VCE is given as in Equation Where Reff is effective output resistance at the output, IES = reverse saturation current at base-emitter diode, αT = common base forward short circuit gain, VT = Thermal Voltage kT/q, VBE = base-emitter Voltage, VCE = base-collector Voltage, VCC = Source Voltage typically 5V/10V. In Eber-Moll Model, IC grows at about 9% / 0C if you hold VBE constant and VBE decreases by 2.1mV / 0C if you hold IC constant with the temperature. Since both the currents depend on temperature parameter VT, the raise in the temperature leads to vary these parameters which finally lead to degrade the performance of CFD. 3.2.2 Effect of Radiation Another stress parameter which degrades the BJT devices is Cobalt β-radiation. Degradation of many types of bipolar transistors and circuits is known to depend strongly on dose rate. For a given total dose, degradation is more severe in low dose rate exposure than high dose rate exposure. This effect has been attributed to space charge effects from trapped holes and hydrogen related species through oxygen vacancies in base oxide. There are several hardness assurance tests and most popular has been high dose rate irradiation at elevated temperatures [23]. Although radiation exposure generally leads to grain degradation in npn and pnp devices, the mechanisms by which radiation effects their gains are quite different. Ionizing radiation 7
degrades the current gain of npn bipolar transistors by introducing net trapped positive charge and interface traps into the oxide base. This positive oxide trapped charge spreads the emitter-base depletion region into the extrinsic base results in increase of base recombination current under forward-bias operation at the junction. Radiation-induced interface traps, especially those near mid-gap, serve as generation-recombination centers through which recombination current in the base is further increased due to enhanced surface recombination velocity. In pnp transistors [23], near-midgap interface traps in the base oxide also increase the base current by surface recombination. Compared with npn transistors, radiation-induced net positive oxide trapped charge can mitigate gain degradation by creating an imbalance in carrier concentrations at the surface of the base. From the statistical results explained in et al. Witczak [24], Current gain degradation grows worse with decreasing dose rate regardless of dose. Excess base current, an increase in base current due to radiation exposure, increases gradually with decreasing dose rate. This effect is due to weak dependence of excess base current on radiation-induced defect densities at large total dose. Changes in collector current as compared to base current is small because it provides meaningful assessment of amount of gain degradation while relating closely to the physical mechanisms, excess base current is a convenient parameter to evaluate radiationinduced damage in these devices [24]. Although much progress has been made in understanding the effects of dose rate and temperature on radiation-induced bipolar gain degradation, still there is ambiguity in selecting the optimum values for assurance testing. From the analysis carried out by Witczak [5], the combined influence of both radiation and temperature has considerable dependence on gain degradation and excess base current enhancement. The combine effect of temperature and radiation results in degradation of performance parameters such as threshold voltage, pulse amplitude and time period of Constant Fraction Discriminator. The induced radiation is exposed to discriminator at ISOMED, BARC at initial dose rate of 2.5Mrad. After exposure, the IC is biased with initial conditions and then admitted the IC itself to various levels of temperature by using temperature controller at IIT Bombay laboratory. 3.3. Experimental Testing CFD 2004 of BJT technology from manufacturers of BEL is considered for this study. It is 24-pin DIP plastic package with operating conditions -5.2V to 5V and temperature 100C. In order to monitor and test this IC for temperature and radiation considering time, a circuit is required to assess and measure it. Figure 7 shows the conditional measuring circuit for this failure testing. As we can see, along with IC, several other components also required to measure the performance parameters such as Inverter (to invert the positive pulse to negative pulse input which is not shown in figure), resistors, capacitors, etc. These components are also sensitive to temperature which effects the measurement. Hence, the circuit is divided to two parts: CFD part and measurement part. In this way, effect of temperature lies only on CFD. The board of CFD part is also holed out at the bottom of IC to expose it with sufficient temperature. A thermistor is placed across IC to continuously monitor the temperature of it. 8
Figure 7: Circuit Diagram of CFD From the research, temperature and radiation dose rate are considered as stress parameters for the degradation of performance of constant fraction discriminator. The performance parameters include threshold voltage which is at the input and TTL pulse amplitude at the output. From the Taguchi method of design of experiments, selection of this temperature levels is considered such that IC provides optimum performance. Radiation and temperature are the dominant stress parameters from the failure phenomenon. Initially the device is exposed to radiation under biased conditions and further exposed to temperature. The stress parameter levels for the accelerated testing are found by using 2-stage DOE method: Basic and Extensive testing. 3.3.1 Basic testing Stage In the basic testing stage, the behavioral effect of the stress parameters on the performance parameter is studied by limited design of experiments and accelerated testing. 3.3.1.1 Radiation Testing: In this study, variation of pulse amplitude and time period in accordance with the radiation dose rate is calculated. Figure 8 shows the variation of output pulse amplitude with respect to the dose rate. As we can see, there is some little change in the output at higher dose rate.
Figure 8: Variation of pulse voltage with dose rate As from these results, dose rate at 80 rads makes considerable change in the time period. This result depicts some change in performance parameters with radiation.
9
3.3.1.2 Temperature Testing: In this study, variation of pulse amplitude and time period in accordance with the temperature is calculated. Range of temperature is considered from 300C to 500C. Figure 9 shows considerable decrease in the amplitude as the temperature increased nonlinearly to 50 0C because of explanation given in above chapter. As from these results, temperature variation on CFD decreases time period linearly. This result depicts some change in performance parameters with temperature.
Figure 9: Variation of pulse voltage with temperature From the screening results, we get to know that both radiation and temperature degrades the performance parameters as both the parameters increases. This experiment provides a proof of the discussion on degradation mechanisms that was explained in 3.2. 3.3.1.3 Design of Experiments: In this stage, stress levels of both radiation and temperature is subjected to CFD circuit one after another as provided in the table 1. The response surface graphs of pulse amplitude with dose rate and temperature as the input parameters is depicted in Figure 10. Table 1: 2X2 Matrix of radiation and temperature Run L1 L2 L3 L4
D
T 50 50 100 100
Avg
SD
30 50 30 50
-4.452 -4.4392 -4.451 -4.4382
0.013038405 0.012316655 0.013038405 0.012316655
Figure 10: Response surface graph of Pulse amplitude From DOE and these response surface graphs, the levels of input parameters is selected such that maximum degradation of performance parameter is expected and acts as input to the accelerated testing of CFD for life testing analysis. 10
3.3.1.4 Accelerated Testing: From the inputs of Design of Experiments, the levels are selected such that pulse amplitude as maximum degradation. The values are provided below and experiments are carried out at regular intervals after exposure of radiation and maintaining the temperature level.
Figure 11: Accelerated testing of CFD for Voltage As in Figure 11, the degradation of pulse amplitude happened over the time non-linearly. To quantify and model this time to failure considering dose rate and temperature need to be studied as there are no physics of failure models available in the literature. 3.3.2 Extensive testing Stage From the input from the stage 1, as the both temperature and radiation parameters increases, the output performance factor further degrade. In this stage, the radiation parameters are selected at the higher dosages as 0 KGray, 3.14 KGray, 6.64 KGray and 10 KGray. Similarly, the testing of IC is excited to higher temperatures of 300C, 500C, 700C and 900C. From the Witczak [24], the degradation of the device by radiation increases further with the temperature. Hence the items are subjected at first to the radiation step and second to the temperature step. To get more extensive data, accelerated testing is carried out after the temperature step. This radiation-temperature-time sequence is carried out at all the stress levels of the radiation. The cumulative effect of both temperature and time factors w.r.t radiation stress level is shown below. From the table 2, temperature further degrades the effect of radiation step and shown graphically in Figure 12 where t=0. Similarly, the degradation characteristics are observed with accelerated testing carried 0 out 90 C at each radiation step and results are provided in table 3. From table 3, the output parameter further degrades by the effect of accelerated time and shown graphically in Figure 13 and experiences non-linear behavior. From the above figures, it was concluded that both radiation and temperature degrades the performance parameter, the voltage of the output pulse with further accelerated time. Table 2: Radiation Step with Temperature Temp V0KG V 3KG V 6KG V10KG 0 30 -4.426 -4.368 -4.264 -4.146 ( C) 50 -4.404 -4.352 -4.238 -4.124 70 -4.382 -4.334 -4.216 -4.1 90 -4.35 -4.304 -4.184 -4.068
11
Figure 12: Degradation with radiation and temperature Table 3: Radiation step with accelerated time Time (in hrs) V 3KG V 6KG V 10KG 0 -4.304 -4.184 -4.068 50 -4.254 -4.134 -4.016 100 -4.194 -4.074 -3.952 150 -4.122 -3.992 -3.89 -3.6 0
50
100
150
-3.8 0 K G
-4 -4.2 -4.4 -4.6
Figure 13: Degradation with radiation and accelerated time
3.4 SVM Methodology 3.4.1 What is SVM? Support vector machine is a novel statistical learning machine based on statistical learning theory, which can repeatedly estimate dependencies among the data proposed by Vapnik [6,7], and it adheres to the principle of structural risk minimization seeking to minimize an upper bound of the generalization error rather than minimize the training error. The solutions provided SVM is theoretically elegant, computationally efficient and very effective in many large practical problems. It has a simple geometrical interpretation in a high-dimensional feature space that is nonlinearly related to input space. The classification problem assigns labels to objects, and it is a regression problem when the dependency estimates the relationship between explanatory variables and predictive variables. This induction principle is based on the bounding of the generalization error by the sum of the 12
training error and a confidence interval term depending on the Vapnik-Chervonenkis (VC) dimension [12]. The basic principle to solve regression prediction problem using SVM theory is to map the input data X into a high-dimensional feature space F by nonlinear mapping, to yield and solve a linear regression problem in this feature space. The SVM has been successfully applied to a number of applications ranging from particle identification, face identification, and text categorization, to engine knock detection, bioinformatics, and database marketing (Bennett and Campbell, 2000) [13]. For linear regression, assuming training set (xi,yi), for i=1,2,3…n, where xi is the actual value of input vector and yi is output, n is the number of total data pairs. It is desired to find a separator for partitioning data-set using binary classifier which separates the dark from white dots represents different sets of data. There were several possible lines L1, L2 and L3 which can separates the data into two groups as in Figure 14 [14].
Figure 14: Linear Discriminant Function to separate data sets In order to find the optimized solution, a linear discriminant function (or classifier) with the maximum margin was considered and this margin is defined such a way that the width of the boundary could be increased by before hitting a data point. The function is described as
and to maximize the marginal width of
equivalent to minimize
such that
. However in the most of the situations, it was difficult to linearly classify the data due to presence of non-separable data points. The slack variables ξi were introduced into the optimal solution to reduce the impact where formulation was deduced to such that where ≥ 0, i = 1,2,…m and C is penalty parameter which trade-offs classification accuracy and computation complexity. C value also can be used to set how strictness the data points to be classified correctly (low C is not strict, high C is strict). To solve the convex secondary optimization and dual problem for optimal solution, Lagrangian function (dual problem) was established to calculate partial derivative for slack variables, thus
13
where Lp(w,b,αi) is the Lagrangain function and αi represents the Lagrangain multiplier corresponding to xi. The condition should satisfy Karush–Kuhn– Tucker (KKT) conditions (also known as the Kuhn–Tucker conditions) [15] are first order necessary conditions for a solution in nonlinear programming to be optimal, provided that with some regularity conditions. The optimal solution is the Support Vector (SV), a sub set of the training data set with condition αi ≠ 0 which can influence the decision function as
The function xiTxj also known as kernel function K(xi,xj) which is in this case as linear classifier. When a nonlinear kernel function is used, the optimal decision function can be obtained in the same way it is obtained in the simple inner product , which is essentially a linear kernel function [16]. There are several non-linear classifiers available such as Polynomial, normalized polynomial, Gaussian etc., and selection of a function and tuning of its respective parameters plays a key role in deciding the classification accuracy. The Gaussian and polynomial functions differs in their methodologies to measure similarity in the data where former measures it by subtraction of the two vectors and later function does it by using inner product. The functions were defined as Linear Kernel: Polynomial Kernel: where p is the degree of the polynomial. It is in discrete in nature and higher the value of the polynomial, higher accurate and approximation of the model but takes higher computation time. Gaussian or Radical Basis Function (RBF): where as kernel width parameter with bigger gamma values give the steeper functions (more flexible) while lower gamma values give the smoother functions. In order to reproduce highly irregular decision boundaries (or target functions for regression), higher gamma values are recommended. The sequential minimal optimization algorithm (SMO) has been an effective method for training support vector machines (SVMs) on classification tasks performed on sparse data sets [17]. SMO differs from most SVM algorithms in which do not require a quadratic programming (QP) solver by segregating a sub problem into size two with each size has analytical solution. While SMO has been shown to be effective on sparse data sets and especially fast for linear SVMs, the algorithm can be extremely slow on non-sparse data sets 14
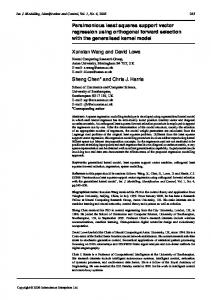
and on problems that have many support vectors. Regression problems are especially prone to these issues because the inputs are usually non-sparse real numbers (as opposed to binary inputs) with solutions that have many support vectors. SMO repeatedly finds two Lagrange multipliers that can be optimized with respect to each other and analytically computes the optimal step for the two Lagrange multipliers. When no two Lagrange multipliers can be optimized, the original QP problem is solved. SMO actually consists of two parts: (1) a set of heuristics for efficiently choosing pairs of Lagrange multiplier to work on, and (2) the analytical solution to a QP problem of size two [18]. Smola and Schölkopf’s SMO algorithm [19] that is caused by the operation with a single threshold value was overcome by Shevade [20] suggesting two modifications the problem by efficiently maintaining and updating two threshold parameters. Their computational experiments show that these modifications speed up the SMO algorithm significantly in most situations. This paper compares and implements the sensitivity analysis of each of the tuning parameters of Gaussian and Polynomial kernels with and without of SMO. 3.4.2 Proposed methodology for comparison of SVM models We used the following methodology as in Figure 15 to obtain the approximation kernel function with tuned parameter for the degradation of output voltage of CFD. Start
Select a Kernel Function
Train SVR with 66%
Tune parameters
Min Error?
Predict Failure Phenomenon
End
Figure 15: Proposed Methodology for comparison of different kernel functions for degradation i. Select one of the kernel functions of RBF Kernel without hyper parameter tuning, Normalized polynomial without hyper parameter tuning and Polynomial without hyper
15
ii. iii. iv. v. vi.
parameter tuning, RBF Kernel with SMO reg, Normalized polynomial and Polynomial with SMO reg. Select the parameters of SVR Train with percentage split of 66%. Tune the function parameters to get min Mean Square Error and Root Means Square Error Predict the degradation phenomenon Select another function and repeat the process from (i)
3.5 Data Analysis By combining the data from Table 1, Table 2 and 3, the table 4 as a data set was constructed with all the possible runs obtained from the design of experiments and accelerated testing of the constant fraction discriminator. In this data, temperature, time and radiation are the input parameters and Voltage as the output parameter. These 39 data points were characterized for the SVM regression analysis that was illustrated in the above section using Weka tool. The procedure that was proposed in Figure 15 was implemented with the different kernel functions and tuning of their respective parameters. For the RBF Kernel, the complexity factor C and gamma value and for polynomial kernel, the complexity factor C and the degree of polynomial P parameters were tuned in such a way to reduce the Mean Absolute Error (MAE) and Root Means Square Error (RMSE). Table 4: Data for SVM analysis Temperature Time
Radiation Voltage
Temperature Time
Radiation Voltage
50
0
1
-4.441
70
0
6.5
-4.216
50
50
1
-4.431
70
0
10
-4.1
50
100
1
-4.4188
90
0
0
-4.35
50
200
1
-4.4393
90
0
3
-4.304
50
300
1
-4.3644
90
0
6.5
-4.184
30
0
0.5
-4.452
90
0
10
-4.068
50
0
0.5
-4.4392
90
50
0
-4.4308
30
0
1
-4.451
90
50
3
-4.254
50
0
1
-4.4382
90
50
6.5
-4.134
30
0
0
-4.426
90
50
10
-4.016
30
0
3
-4.368
90
100
0
-4.4188
30
0
6.5
-4.264
90
100
3
-4.194
30
0
10
-4.146
90
100
6.5
-4.074
50
0
0
-4.404
90
100
10
-3.952
50
0
3
-4.352
90
150
0
-4.4059
50
0
6.5
-4.238
90
150
3
-4.122
16
50
0
10
-4.124
90
150
6.5
-3.992
70
0
0
-4.382
90
150
10
-3.89
70
0
3
-4.334
3.5.1 Sensitivity Analysis For the Gaussian Kernel without hyper parameter tuning, the gamma value was adjusted and set to 3.5 for minimum error of 3-4% as with results shown in Table 5. Table 5: Gamma tuning of RBF Kernel Gamma MAE RMSE 20 0.0447 0.0543 10 0.035 0.0451 7.5 0.0322 0.0428 5 0.0313 0.0414 4 0.0312 0.0412 3.5 0.0313 0.0411 2.5 0.0315 0.0414 1 0.0342 0.0456 0.1 0.0727 0.0882 Similarly, the exponent of the Normalized Polykernel and Polykernel without hyper parameter tuning was adjusted to get minimum error with 8.5% and 9.1% which were higher than the RBF Kernel as shown in Table 6 and Table 7 respectively. Table 6: Exponent Tuning of Normalized Polykernel Exponent MAE RMSE 2 0.0941 0.1122 3 0.0858 0.1017 4 0.0818 0.096 5 0.0789 0.093 10 0.073 0.0871 20 0.0718 0.0856 25 0.0718 0.0855 30 0.0718 0.0854 35 0.0719 0.0855 50 0.0727 0.0859 Sequential Minimal Optimization with regression had 3 tuning parameters: C, exponent and Epsilon parameter (the insensitive loss function). By varying these parameters, the MAE was reduced to 3% and RMSE reduced to 6.3% for normalized Polykernel with C = 15, Exponent 17
= 45 and Epsilon = 0.0001 in Table 8 which was not recommended. Similarly, by setting the parameters to get minimum errors, the MAE was reduced to 2.6% and RMSE was reduced to 5.6% for Polykernel with C = 30 and Exponent = 27 in Table 9 which was also not recommended. Table 7: Exponent Tuning of Polykernel Exponent MAE RMSE 1 0.1104 0.1248 5 0.0736 0.0949 10 0.0661 0.0926 15 0.063 0.0922 20 0.0618 0.0919 25 0.0606 0.0919 30 0.0605 0.0919 35 0.0603 0.0918 40 0.06 0.0918 45 0.0598 0.0917 50 0.0596 0.0917 75 0.0592 0.0916 100 0.05914 0.0916
Table 8: SMO reg with Normalized Polykernel C 1 5 10 15 20 Exp 2 3 4 5 10 15 20 25 30 35 40 45 50
MAE RMSE 0.0725 0.0988 0.0684 0.097 0.0668 0.0914 0.0664 0.0922 0.0664 0.0922 MAE RMSE 0.0664 0.0922 0.0537 0.0773 0.0521 0.0728 0.0504 0.0778 0.0436 0.0837 0.0406 0.0774 0.0371 0.0702 0.0342 0.0686 0.0337 0.0679 0.0328 0.0665 0.0313 0.0648 0.0299 0.0639 0.0298 0.0639 18
Table 9: SMO reg with Polykernel with C = 30 Exp 1 2 3 5 10 15 20 25 27 30
MAE RMSE 0.0357 0.0481 0.036 0.0478 0.0347 0.0449 0.0295 0.0499 0.0277 0.0555 0.0271 0.0562 0.0268 0.0562 0.0262 0.0562 0.0263 0.0562 0.0289 0.0549
But for the RBF Kernel, the error was 0.06% which was so low when compared to the other kernel functions. In the paper Shuzen Li [25], they were considered the RBF kernel for accelerated degradation testing results using the data from monte-carlo simulation. The optimized tuned parameters for SMO reg with RBF kernel were C =100 and gamma is 15 from the results tabulated in Table 10 and 11. With epsilon = 0.0001, the errors were further reduced to 0.0003 and 0.0005. Hence RBF kernel best suited for degradation. Table 10: SMO Reg with RBF Kernel with C tuning C 1 5 10 15 20 25 30 35 40 45 50 75 100
MAE RMSE 0.0903 0.1195 0.0403 0.0575 0.0369 0.0564 0.0358 0.0532 0.0352 0.0508 0.0349 0.0591 0.0346 0.0486 0.0341 0.0466 0.0338 0.0463 0.0336 0.0461 0.0334 0.0459 0.0325 0.0451 0.0317 0.0441
Table 10: SMO Reg with RBF Kernel with Gamma Tuning Gamma MAE RMSE 0.01 0.0317 0.0441 0.1 0.0171 0.0273 1 0.0051 0.0104 19
5 10 15
0.001 0.0007 0.0006
0.0014 0.0008 0.0008
The optimized support vectors were -93.28437484337455 * k[0]+0.040257228770170024 * k[1]0.22793205333831948 * k[2]-0.2817526828692522 * k[3]-0.16891291918032977 * k[4]-6.792562217468341 * k[5]-12.159262158450781 * k[6]+3.738817498294129 * k[7]+100.0 * k[8]+3.136432650141998 * k[9]0.40548305118697636 * k[10]-0.017686862789814694 * k[11]+0.14142421495665403 * k[12]+5.8972372165834095 * k[13]-0.590734211920628 * k[14]+0.05207817633637825 * k[15]+0.13923829757449374 * k[16]-0.16307291228062248*k[17]-0.08479230240257521 * k[18]+0.010018497184633142 * k[19]+0.1664237846610784*k[20]+0.15714402054772972 * k[21]0.22342312817692356 * k[22]-0.036205478232958915* k[23]+0.1225132753217027 * k[24]0.5132086855567924 *k[25]+0.30454974450294453*k[26]+0.1872978002657113 * k[27]+0.20949944853703384 * k[28]+0.23888524680828016 * k[29]-0.2590720408770739 * k[30]0.180202691026668 * k[31]-0.061199087083700046 * k[32]-0.4254874566893895 * k[33]+0.37184630434488447 * k[34]+0.3928517912643163 * k[35]+0.5688495868096197 * k[36] + 0.3783
The failure data from the physics of failure methodology was supplied to the support vector machine to find the model with optimum kernel function to find the reliability of the constant fraction discriminator. Conclusion In this paper, failure phenomenon of constant fraction discriminator was studied and found that the radiation and temperature with accelerated testing over time led to degradation of the output voltage from the data obtained by design of experiments and accelerated degradation test. Support vector machine was discussed to model the reliability prediction of this electronic component and proposed a model to obtain the optimum kernel function with the respective tuning parameters. It was concluded from the sensitivity analysis of all functions, SMO regression with RBF kernel was best suited for the degradation of the output parameters with least amount of error. References [1]. [2]. [3].
[4]. [5].
“Military Handbook, Reliability prediction of electronic component, MIL-HDBK217F” Mark White, “Microelectronics reliability : Physics-of-failure based modeling and lifetime evaluation”, JPL Publication 08-05, NASA, Feb 2008 Susumu Harasawa, Atsushi Nakamoto, Yoshinori Hayakawa, Jun Egawa, Otohiko Aizawa, Tetsuya Nozaki, Takashi Minobe, Hiroshi Hatanaka, “Improved Monitoring System of Neutron Flux during Boron-Neutron Capture Therapy”, Radiation Research, 88, 187-193 (1981) Lloyd W. Condra, “Reliability improvement with design of experiments”, 2nd edn, Marcel Dekker, 2001. Wayne Nelson, "Accelerated Testing: Statistical Models, Test Plans, and Data Analysis", John Wiley & Sons, 2004
20
[6]. [7]. [8]. [9]. [10]. [11]. [12]. [13]. [14].
[15]. [16]. [17]. [18]. [19]. [20].
[21].
[22]. [23].
[24].
[25].
Vapnik, V.N., “The Nature of Statistical Learning Theory”, Springer: New York; 1995. Vapnik, V.N., “Statistical Learning Theory”, John Wiley and Sons, Inc: New York; 1998. Shawe Taylor, J. & Cristianini, N., “Kernel methods for pattern analysis”, Cambridge, Cambridge University Press, 2004 Kristin Luery, "Failure of the Constant Fraction Discriminator", July 9, 2003. Vladimir Vassiliev, Jeremy Smith, David Kieda, "VERITAS L1 trigger Constant Fraction Discriminator", B. Van Zeghbroeck, "Principles of Electronic Devices", University of Colarado, 2011. Nello Cristianini, John Shawe-Taylor, “An Introduction to Support Vector Machines and Other Kernel-based Learning Methods”, Cambridge University Press, 2000. Bennett, K. P. & Campbell, C., “Support Vector Machines: Hype or Hallelujah?”, SIGKDD Explorations, Vol 2 Issue 2, Page 1-13, 2000. Yuan Fuqing, Uday Kumar, K B Mishra, "Complex System Reliability Evaluation using Support Vector Machine for Incomplete Data-set", International Journal of Performability Engineering, Vol. 7, No. 1, January 2010, pp.32-42. Kuhn, H. W., Tucker, A. W., "Nonlinear programming", Proceedings of 2nd Berkeley Symposium, Berkeley: University of California Press. pp. 481–492. 1951 Yuan Fuqing, "Failure Diagnostics Using Support Vector Machine", Doctoral Thesis, Printed by Universitetstryckeriet, Luleå 2011 John, C Platt, "Sequential Minimal Optimization: A Fast Algorithm for Training Support Vector Machines", Microsoft Research, April 21, 1998 Gary William Flake, Steve Lawrence, "Efficient SVM Regression Training with SMO", Machine Learning, 2001 A. Smola and B. Sch¨olkopfm, “A tutorial on support vector regression”, Technical Report NC2- TR-1998-030, NeuroCOLT2, 1998 S. K. Shevade, S. S. Keerthi, C. Bhattacharyya, and K. R. K. Murthy, "Improvements to the SMO Algorithm for SVM Regression", IEEE Transactions on Neural Networks, vol. 11, no. 5, September 2000 "The temperature characteristics of bipolar transistors fabricated in CMOS technology", Guijie Wang, Gerard C.M. Meijer, Elsevier, Sensors and Actuators 87 2000 81–89. Theodore F Bogart, Jeffrey Beasley, Guillerno Rico, "Electronic Devices and Circuits", Pearson Prentice Hall, 2009 Ronald L. Pease, M. C. Maher, M. R. Shaneyfelt, M. W. Savage, P. Baker, J. Krieg, T. L. Turflinger, "Total-Dose Hardening of a Bipolar-Voltage Comparator", IEEE Transactions on Nuclear Science, vol. 49, no. 6, December 2002 "Hardness assurance testing of bipolar junction transistors at elevated irradiation temperatures", S.C. Witczak, R.D. Schrimpf, D.M. Fleetwood, K. F. Galloway, R.C.Lacoe, D.C. Mayer, J.M. Puhl, R.L.Pease, J.S. Suehle, IEEE transaction on Nuclear Science, Vol 44, No. 6, Dec 1997 Shuzhen Li, Xiaoyang Li, Tongmin Jiang, "Life and Reliability Forecasting of the CSADT using Support Vector Machines", Proceedings - Annual Reliability and Maintainability Symposium (RAMS), Page(s): 1 - 6, 25-28 Jan. 2010 21