Negar Ahmadi & Reza Berangi
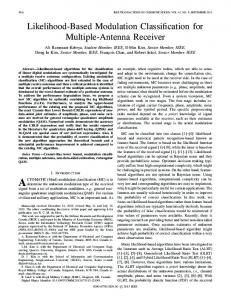
Symbol Based Modulation Classification using Combination of Fuzzy Clustering and Hierarchical Clustering
Negar Ahmadi
[email protected]
Department of Computer Engineering Iran University of Science and Technology Narmak, Tehran, Post Code: 1684613114, Iran
Reza Berangi
[email protected]
Department of Computer Engineering Iran University of Science and Technology Narmak, Tehran, Post Code: 1684613114, Iran
Abstract
Most of approaches for recognition and classification of modulation have been founded on modulated signal’s components. In this paper, we develop an algorithm using fuzzy clustering and consequently hierarchical clustering algorithms considering the constellation of the received signal to identify the modulation types of the communication signals automatically. The simulation that has been conducted shows high capability of this method for recognition of modulation levels in the presence of noise and also, this method is applicable to digital modulations of arbitrary size and dimensionality. In addition this classification finds the decision boundary of the signal which is critical information for bit detection. Keywords: Fuzzy C-means, AMR, Modulation Classification, Hierarchical Clustering.
1. INTRODUCTION Modulation classification (MC) is an important subject in both military and commercial communication applications. This is a challenging problem, especially in non-cooperative environments, where no prior knowledge on the incoming signal is available. The aim of modulation classification (MC) [1-5] is to identify the modulation type [6] of a Communication signal. It plays an important role in many communication applications such as software radio, intelligent modem, and electronic surveillance system [7]. In many military communication situations such as reconnaissance, surveillance and electronic warfare, an indispensable step is to classify automatically the modulation types of the received signals. Automatic modulation recognition plays an important role in civil fields such as interference identification and spectrum management. Modulation recognition is an intermediate step on the path to full message recovery. As such, it lies somewhere between low level energy detection and a full fledged demodulation. Therefore, correct recovery of the message per se is not an objective, or even a requirement [8, 9]. The existing methods for modulation classification span four main approaches. Statistical pattern recognition, decision theoretic (Maximum Likelihood), M-th law non-linearity and filtering and ad hoc [10, 11].
Signal Processing – An International Journal (SPIJ), Volume (4) : Issue (2)
123
Negar Ahmadi & Reza Berangi
Early on it was recognized that modulation classification is, first and foremost, a classification problem well suited to pattern recognition algorithms. A successful statistical classification requires the right set of features extracted from the unknown signal. There have been many attempts to extract such optimal feature. Histograms derived from functions like amplitude, instantaneous phase, frequency or combinations of the above have been used as feature vectors for classification, Jondral [12], Dominguez et al. [13], Liedtke [14]. Also of interest is the work of Aisbett [15] which considers cases with very poor SNR. The current state of the art in modulation classification is the decision theoretic approach using appropriate likelihood functional or approximations thereof. Polydoros and Kim [16] derive a quasi-log-likelihood functional for classification between BPSK and QPSK modulations. In a later publication, Huang and Polydoros [17] introduce a more general likelihood functional to classify among arbitrary MPSK signals. They point out that the S-classifier of Liedtke, based on an ad hoc phase-difference histogram, can be realized as a noncoherent, synchronous version of their qLLR. Statistical Moment-Based Classifier (SMBC) of Solimon and Hsue [18] are also identified as special coherent version of qLLR. Wei and Mendel [19] formulate another likelihood-based approach to modulation classification that is not limited to any particular modulation class. Their approach is the closest to a constellation-based modulation classification advocated here although they have not made it the central thesis of their work. Carrier phase and clock recovery issues are also not addressed. Chugg et al [20] use an approximation of log-ALF to handle more than two modulations and apply it to classification between OQPSK/BPSK/QPSK. Lin and Kuo [21] propose a sequential probability ratio test in the context of hypothesis testing to classify among several QAM signals. Their approach is novel in the sense that new data continuously updates the evidence. Past work on modulation recognition has primarily used signal properties in time and/or frequency domain to identify the underlying modulation. One of the typical analysis methods for the modulated signal is the extraction of In-Phase I and Quad-Phase Q components. According to these components, we can see the signal as a vector in the I Q plane which is referred to as the constellation diagram. With the use of modulated signal constellation, modulation classification can be investigated as pattern recognition problem and well known pattern recognition algorithms can be used. For example in a recent publication Ahmadi and Berangi [22] introduce a method to classify modulation by using Genetic Algorithm and template matching Based on constellation diagram.
2. CLASSIFICATION OF QAM AND PSK MODULATIONS USING FUZZY CLUSTERING As mentioned, constellation diagram, which consists of In-phase and Quad-phase components, can be used for modulation classification. Since the constellation is symmetric with respect to its axes, in order to reduce complexity, we can map all the received symbols into the first quadrant in the constellation diagram. After obtaining number and location of clusters in the first quadrant, centroids of the clusters could be extended to the whole constellation, symmetrically. The proposed technique has been designed so that it would be capable of recognizing the types: 4-PSK, 8-PSK, 16-PSK, 4-QAM, 16-QAM and 64-QAM. So the initial number of clusters has been set to 16 in the first quadrant. This technique consists of two stages of FCM (Fuzzy C-means) clustering and post processing. Therefore the initial clusters can be defined as a vector of 16 elements in which, each element is a point in the first constellation quadrant. Initial value of centroids of the clusters is used for obtaining initial elements of the membership matrix. In order to reduce processing, calculation is done in the first quadrant, absolute value of signal’s I Q components is calculated and stored in a 2D matrix and used in the future processing. 2.1. An Overview of Fuzzy C-mans Algorithm
Signal Processing – An International Journal (SPIJ), Volume (4) : Issue (2)
124
Negar Ahmadi & Reza Berangi
Fuzzy C-means algorithm executed as follows [23, 24, and 25]: Initial membership matrix constructed according to equation (1).
1
u ij
2
x i c j k 1 x c k i C
m 1
(1)
where m is the Fuzzy exponent, xi are the input symbols and c j denote the centroids. 2. New centroids shall be calculated using membership function as equation (2). N
cj
m ij
u x u i 1
N
i 1
i
(2)
m ij
Values of the old membership matrix are stored for the future comparisons.
3. New membership matrix is calculated using equation (1) and the objective function is calculated using equation (3). N N C J m J i u ijm x i c j i 1 i 1 j 1
2
1 m
(3)
In fact the aim of clustering is assigning symbols to clusters so that the value of the objective function is minimized. The algorithm convergence and termination condition are evaluated as equation (4).
max ij u ij k 1 u ij k
(4)
If the above condition is satisfied or the number of iterations reaches its end, then the algorithm is terminated, otherwise it returns to the step 2. Through this stage the number of centroids is constant. Hence to reduce the number of centroids, a post-processing step is necessary.
2.2. Post-Processing Stage In this stage the centroids resulted from fuzzy clustering have been merged such that they result in the actual number and the location of centroids. The number of clusters in one quadrant could be 1, 2, 4, 8 or 16. The foundation of this step is based on hierarchical clustering [26]. Therefore, upon the completion of the fuzzy algorithm when centroids are obtained naturally, we use hierarchical clustering. To do this, first we calculate the Euclidean distance of the clusters pairwise and construct the hierarchical tree. After constructing the tree, all the possibilities of the merged centroids are calculated based on the number of the centroids. For each possibility the fitness value of the merged centroids with signal’s symbols is calculated. This fitness value is calculated using hard C-means clustering [26]. Since clustering is performed to assign symbols to clusters, in a sense that the objective function (fitness value) is minimized. The number of optimum clusters corresponds to the objective function that is minimum between all possibilities. It must be mentioned that, since the value of the objective function increases naturally as the number of clusters increases, which in turn causes an error in recognition of the actual number of cluster, the value of the objective function is multiplied by a weight proportional to the number of clusters to prevent producing error.
Signal Processing – An International Journal (SPIJ), Volume (4) : Issue (2)
125
Negar Ahmadi & Reza Berangi
After multiplication of the weights, the number of clusters corresponding to the objective function with minimum value is chosen as the final number of cluster. After the final clusters on the first quadrant are obtained, these clusters are extended to the whole constellation diagram. For example, consider Figure (1) which corresponds to post processing of 16-QAM. It can be seen that the value of the objective function for 4 clusters in one quadrant is minimum with respect to the function’s value for other possibilities; therefore 4 clusters are chosen for the first quadrant, and for the whole constellation diagram, 16 clusters are chosen (equal to the number of points of the 16-QAM constellation).
Figure 1: Values of the objective functions for possible clusters in the first quadrant (16-QAM).
Also in Figure (2) which corresponds to 8-PSK modulation, objective function for two clusters in the first quadrant has the minimum value, so the modulation levels in the whole constellation diagram are equal to 8, which is equal to points of 8-PSK constellation. In this way, for all modulations of QAM and PSK families, the post-processing step can lead to finding the actual number of clusters from the 16 clusters resulted by the fuzzy algorithm.
Signal Processing – An International Journal (SPIJ), Volume (4) : Issue (2)
126
Negar Ahmadi & Reza Berangi
Figure 2: Values of the objective functions for possible clusters in the first quadrant (8-PSK).
3. EVALUTION AND SIMULATION RESULTS In order to evaluate the performance of the proposed method, simulation has been performed for various SNR values and various types of QAM and PSK modulations. Channel model, applied in this work, has been assumed to be an AWGN channel, and it is also assumed that there is no time and/or frequency synchronization error. Simulation results show that this method has an efficient performance and high accuracy for the recognition of modulation. The performances of this method for 16-QAM and 16-PSK have been investigated. Figure (3) and Figure (4) show the centroids in the first quadrant obtained from fuzzy algorithm. After completion of fuzzy algorithm, post-processing is performed to achieve the actual number of clusters in the first quadrant and consequently modulation type is recognized. For both 16-QAM and 16-PSK modulations, the value of objective function for 4 clusters in one quadrant will be minimum. Therefore closest clusters are combined so that 4 clusters are obtained in the first quadrant. Figure (5) and Figure (6) show extended clusters and signal symbols together, for 16QAM and 16-PSK modulations, respectively. Accuracy of this method for different modulations and different values of SNR is evaluated. The accuracy percentages have been obtained by executing the algorithm enough number of times and by calculating the ratio between correct recognition and total number of execution. Figure (7) shows the accuracy of recognition versus SNR ratio for different modulation types of QAM family; Also, this figure shows the results for the PSK family. As it can be seen in Figure (7) and (8), as modulation level increases, higher SNR is needed for the correct recognition of modulation type.
Signal Processing – An International Journal (SPIJ), Volume (4) : Issue (2)
127
Negar Ahmadi & Reza Berangi
Figure 3: Centroids in the first quadrant obtained from fuzzy clustering (16-QAM).
Figure 4: Centroids in the first quadrant obtained from fuzzy clustering (16-PSK).
Signal Processing – An International Journal (SPIJ), Volume (4) : Issue (2)
128
Negar Ahmadi & Reza Berangi
Figure 5: Extended clusters and their centroids in whole constellation diagram after post-processing step (16-QAM).
Figure 6: Extended clusters and their centroids in whole constellation diagram after post-processing step (16-PSK).
Signal Processing – An International Journal (SPIJ), Volume (4) : Issue (2)
129
Negar Ahmadi & Reza Berangi
Figure 7: Accuracy of QAM modulation recognition versus SNR.
Figure 8: Accuracy of PSK modulation recognition versus SNR.
Signal Processing – An International Journal (SPIJ), Volume (4) : Issue (2)
130
Negar Ahmadi & Reza Berangi
Having analyzed the obtained results from the fuzzy clustering method, we can imply the following cases: This method can recognize all the 4-QAM modulations with 100% accuracy and its recognition truth does not depend on the signal to the noise, and it can also identify this modulation type with SNR=0. This method can identify all the 16-QAM modulations with SNR=8 with a 95% accuracy, whereas it can also recognize the signal to the noise ratio lower than 8 with a less exactness and higher than 8 with a more exactness; it is noteworthy to say that in lower SNR, the more the sample is increased, the more efficient is the recognition of the modulation type. Accuracy of recognition of 64-QAM for the signal of the noise 10 and higher than that is 100% and for a level lower than it is less. Here, for the lower SNR, as the number of specimens increases, the accuracy would also increase. This research aims to recognize the modulation of QAM modulation family, but can be applied practically to recognize and separate the PSK modulation family. The proposed method to recognize PSK modulation can recognize all the QPSK modulations with 100% accuracy. Exactitude of this method to recognize the 8-PSK modulation with the signal to noise 8 and higher is 100% and for the lower level it is less; moreover, this method is able to identify 16PSK modulation with SNR=15 and higher than that with 100% accuracy and for a level lower than this it is less. In this method fuzzy clustering and hierarchical clustering was used to classify different modulation types of QAM and PSK families, using the constellation diagram of the received signal, which is the noisy version of transmitted signal. As can be seen in the simulation section, the proposed method shows a good performance for recognition even in low SNR condition, of course it must be mentioned that the performance could be increased with a higher number of data symbols. Another advantage of this method is calculating final centroids of clusters and determining the location of these centroids in constellation diagram. Also this approach could be extended and modified to recognize other types of digital modulation. Figures (9), (10), (11), (12) show some more simulation results of this method. 4. CONCLUSION In this paper fuzzy clustering and hierarchical clustering were used to classify different modulation types of QAM and PSK families, using the constellation diagram of the received signal, which is the noisy version of the transmitted signal. By using fuzzy clustering algorithm, the clustering of input samples in the I Q plane is done with a high accuracy, and then in the post-processing stage, by using hierarchical clustering the number of real clusters that are representative of levels of modulation is recognized. As can be seen in simulation section, the proposed method shows a good recognition performance even in low SNR condition, and adapt to engineering applications. of course, it must be mentioned that the performance could be improved with higher number of data symbols. Another advantage of this method is calculating final centroids of the clusters and determining the location of these centroids in constellation diagram. In addition this approach could be extended and modified to recognize other types of digital modulations. The method that has been used can be expanded and uses them for modulation recognition of any PAM signals. These signals have one-dimensional constellation while in this research we study the signals with two-dimensional constellations, which are more complicated. Thus with a little change we can use them for recognition of PAM signals. From these signals the MFSK and MASK modulations can be referred. With little changes in the proposed method it can be used in the recognition of modulations that have non-standard one dimensional or two-dimensional constellation. By rotating the
Signal Processing – An International Journal (SPIJ), Volume (4) : Issue (2)
131
Negar Ahmadi & Reza Berangi
constellation diagram of PAM signals for 45 in the I Q plane, without any change in the proposed method, it can recognize modulations.
(a)
(b)
(c)
(d)
Figure 9: Recognition of 4-QAM with SNR=0dB and 1000 samples. a) Centroids in the first quadrant obtained from fuzzy clustering, b) values of the objective functions for possible clusters in first quadrant, c) centroids of the clusters in whole constellation diagram after post-processing step and d) extended clusters and their centroids in whole constellation diagram after post processing step.
Signal Processing – An International Journal (SPIJ), Volume (4) : Issue (2)
132
Negar Ahmadi & Reza Berangi
(a)
(b)
(c) Figure 10: Recognition of 64-QAM with SNR=13dB and 1000 samples. a) centroids in the first quadrant obtained from fuzzy clustering, b) centroids of the clusters in whole constellation diagram after post processing-step and c) extended clusters and their centroids in whole constellation diagram after post processing step.
Signal Processing – An International Journal (SPIJ), Volume (4) : Issue (2)
133
Negar Ahmadi & Reza Berangi
(a)
(b)
(c)
(d)
Figure 11: Recognition of 8-PSK with SNR=7dB and 2000 samples. a) centroids in the first quadrant obtained from Fuzzy clustering, b) values of the objective functions for possible clusters in first quadrant, c) centroids of the clusters in whole constellation diagram after post processing-step and d) extended clusters and their centroids in whole constellation diagram after post processing-step.
Signal Processing – An International Journal (SPIJ), Volume (4) : Issue (2)
134
Negar Ahmadi & Reza Berangi
(a)
(b)
(c)
(d)
Figure 12: Recognition of 16-PSK with SNR=13dB and 1000 samples. a) centroids in the first quadrant obtained from fuzzy clustering, b) values of the objective functions for possible clusters in first quadrant, c) centroids of the clusters in whole constellation diagram after post processing-step and d) extended clusters and their centroids in whole constellation diagram after post processing step.
REFERENCES [1] A. Swami, B. M. Sadler, “Hierarchical Digital Modulation Classification Using Cumulants”, IEEE Trans. Communications, Vol. 48(3), pp.416-429, 2000 [2] A.K. Nandi, E.E. Azzouz, “Algorithms for Automatic Modulation Recognition of Communication Signals”, IEEE Trans. Communications ,Vol. 46(4), pp. 431-436, April 1998 [3] E.E. Azzouz, A.K.Nandi., “Automatic Modulation Recognition of Communication Signals”, Kluwer Academic Publisher, Norwell, MA, 1996
Signal Processing – An International Journal (SPIJ), Volume (4) : Issue (2)
135
Negar Ahmadi & Reza Berangi
[4] Wen Wei, Jerry M.Mendel, “A Fuzzy Logic Method for Modulation Classification in Nonideal Environments”, IEEE Trans. Fuzzy Systems, Vol.7 (3), pp.333-344, June 1999 [5] J. Lopatka, M.Pedzisz, “Automatic Modulation Classification Using Statistical Moments and a Fuzzy Classifier”, in Proceedings of ICSP2000, pp 1500-1506, 2000 [6] S. G. Wilson, “Digital Modulation and Coding”, New York, Prentice-Hall, Inc., Ch.3, (1996) [7] Daniel Boudreau, Christian Dubuc, Francois Patenaude et al., “A Fast Automatic Modulation Recognition Algorithm and Its Implementation in a Spectrum Monitoring Application”, MILCOM2000, Los Angeles, California, Oct. 22-25, 2000 [8] J. Reichert, “Automatic Classification of Communication Signals using Higher Order Statistics”, ICASSP 92, pp.221-224, 1992 [9] R. Schalkoff, “Pattern Recognition: Statistical, Structural and Neural Approach” , John Wiley, (1992) [10] Bijan G. Mobaseri, “Constellation shape as a robust signature for digital modulation recognition”, Military Communications Conference Proceedings, MILCOM IEEE, Volume 1, Issue, pp. 442-446, 1999 [11] Bijan G. Mobasseri, “Digital Modulation Classification using Constellation Shape”, Signal Processing, Vol. 80, No. 2, pp.251-277, 2000 [12] F. Jondral, “Automatic Classification of High Frequency Signals”, Signal Processing, Vol. 9, No. 3, pp.177-190, 1985 [13] L. Dominguez, J. Borrallo, J. Garcia, “A General Approach to the Automatic Classification of Radiocommunication Signals”, Signal Processing, Vol. 22, No. 3, pp.239-250, 1991 [14] F.F. Liedtke, “Computer Simulation of an Automatic Classification Procedure for Digitally Modulated Communication Signals with Unknown Parameters”, Signal Processing, Vol. 6, pp.311.323, 1984 [15] J. Aisbett, “Automatic Modulation Recognition using Time-Domain Parameters”, Signal Processing, Vol.13, No. 3, pp.323-329, 1987 [16] A. Polydoros, K. Kim, “On the Detection and Classification of Quadrature Digital Modulation in Broad-Band Noise”, IEEE Transactions on Communications, Vol. 38, No. 8, pp. 1199-121, 1990 [17] C. Huang, A. Polydoros, “Likehood Method for MPSK Modulation Classification”, IEEE Transaction on Communications, Vol. 43, No. 2/3/4, pp.1493-1503, 1995 [18] S. Soliman, S. Hsue, “Signal classification using statistical moments”, IEEE Transactions on Communications, Vol. 40, No. 5, pp. 908-915, 1992 [19] W. Wei, J. Mendel, “A New Maximum Likelihood for Modulation Classification,” Asilomar-29, pp. 1132-1138, 1996 [20] K. Chugg, et al, “Combined Likelihood Power Estimation and Multiple Hypothesis Modulation Classification”, Asilomar-29, pp. 1137-114, 1996
Signal Processing – An International Journal (SPIJ), Volume (4) : Issue (2)
136
Negar Ahmadi & Reza Berangi
[21] Y.Lin, C.C. Kuo, “Classification of Quadrature Amplitude Modulated (QAM) Signals via Sequential Probability Ratio Test (SPRT)”, Report of CRASP, University of Southern California, July 15, 1996 [22] Negar Ahmadi, Reza Berangi, “A Template Matching Approach to Classification of QAM Modulation using Genetic Algorithm”, Signal Processing: An International Journal, Vol.3, Issue 5, pp: 95-109, 2009 [23] Krishna K. Chintalapudi and Moshe Kam, “A Noise-Resistant Fuzzy C Means Algorithm for Clustering”, Fuzzy systems proceedings, IEEE international Conference, Vol. 2, pp. 1458-1463, 1998 [24] Sadaaki Miyamoto, “An Overview and New Methods in Fuzzy Clustering”, Knowledge-Based Intelligent Electronic Systems, Second International Conference, Vol. 1, , pp. 33-40, 1998. [25] Frank Chung-Hoon Rhee and Cheul Hwang, “A Type-2 Fuzzy C-Means Clustering Algorithm”, 20 th NAFIPS international conference, Vol. 4, pp. 1926-1929, 2001 [26] E. Gose, R. Johnsonbaugh, S. Jost, “Pattern Recognition and Image Analysis”, Prentice Hall PTR, (1996)
Signal Processing – An International Journal (SPIJ), Volume (4) : Issue (2)
137