System Level Approach for Assessing and Mitigating Differential Skew for 10+ Gbps SerDes Applications Michael J. Degerstrom, Benjamin R. Buhrow, Bart O. McCoy, Patrick J. Zabinski, Barry K. Gilbert, Ph. D., and Erik S. Daniel, Ph. D. Mayo Clinic 200 First St SW; Rochester, MN 55901
[email protected] Abstract Weave-induced skew on printed wiring boards (PWB) for 10+ Gbps SerDes data rates can be very significant. In this paper, we not only investigate weave-induced skew but also look at other sources of skew. We show the weave skew results taken from measurements of three different test boards. Results from a fourth board are presented to examine PWB differential via skew. Measurements from a fifth board are analyzed to determine total channel skew. We propose a budget such that a certain amount of skew can be tolerated with a small increase in channel insertion loss. We then present a case study to project overall performance on PWB yield. We observe a number of anomalies with our test results and suggest additional studies to guard against unpredicted high skew. Introduction As differential digital signal speeds continue to increase well into the Gigabit-per-second range, much more attention is being focused on the issue of differential skew between the positive and negative signals comprising a pair. In particular, over the past several years, several papers have emerged regarding the so-called “weave effect”, whereby inhomogeneous printed wiring board (PWB) materials (such as conventional FR4 which consists of woven glass and surrounding resin which differ in dielectric constant) can give rise to differential skew [1-4]. The existing literature describes weave effect skew both through theoretical treatments and corresponding measurements of a number of materials. Mitigation effects involving geometric rotation of artwork relative to the PWB panel have also been described. However, identification of other contributors to differential skew, and in general, a system-level methodology for identifying and accommodating a limited skew budget in high speed differential designs has been lacking. In this paper, we will present a number of pieces of information in an attempt to (at least partially) fill this void. We described three PWBs to test for weave-effect skew. A fourth board was used to test for differential via performance versus layer to layer misalignment. A fifth board was used to analyze skew from both weave-effect and other effects. We also discussed skew as it relates to total system performance and its impact on overall yield. Weave Skew Test Structures And Methods Existing studies of weave-effect skew generally involve the measurement of many samples of short differential lines [1,2,4] or short single-ended lines [3] and subsequent
978-1-4244-2231-9/08/$25.00 ©2008 IEEE
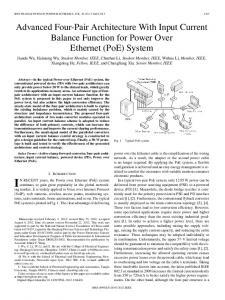
reporting of the statistical characteristics of these groups of measurements. Our first test board, as depicted in Figure 1, was built to investigate these weave skew effects for our particular material sets of interest. This board consists of a 3 by 2 array of separate sub-boards designed to fit within an entire 18” by 24” standard panel. The boards were built with Nelco 4000-13 SI material. Each of the sub-boards has 57 five inch long differential .005” wide striplines with .007” spacings. However, the middle lower test board lacks the first eighteen structures in order to incorporate other (non-related) tests. We utilized GSGSG microwave probe pads on 250 micron pitches which are small enough to allow us to pack as many structures in the available board area as possible, yet large enough to accommodate approximately 5 mil pad widths with 5 mil spacings. These metal widths and spacings are generally easily achievable by PWB manufacturers. We also believe that by using microwave probes we obtain better uniformity relative to other approaches, such as with using SMA or smaller connectors. This latter point is important as it is necessary to ensure that test interface skew is minimized so as to achieve accurate skew measurements of the structures being tested.
5"
Additional Vias Added Between Differential Pairs
Power Integrity Test Sites
JAN_14 / 2008 / MJD / 23191
Figure 1 – First test board to measure weave-effect skew For our second test board, we took skew measurements on a pre-existing board with a limited number of 5 inch long stripline pairs that were 4.5 mils wide on a 14 mil pitch. This second test board used fiberglass-reinforced low-loss PTFE TPG-29/TLG-30 laminates from Taconic.
513
2008 Electronic Components and Technology Conference
JAN_14 / 2008 / MJD / 23198
Figure 2 - Third test board design to primarily determine skew mitigation due to artwork rotation Our fourth board incorporated structures to examine the skew and loss of differential vias. The fifth board that we investigated was a pre-existing system board. Measurements on structures for our first, third, and fourth test boards were all performed using an Agilent Model 8364B PNA with an Agilent Model N4421B 4-port test set. GGB Industries, Inc. Model 40A-GSG-250-DUAL probes were used. A SOLT calibration was performed to the probe tips using a GGB Industries, Inc. CS-2-250 impedance standard substrate. For our second board, we used the same equipment as with the other three boards except that similar probes and calibration substrates were used having 150 instead of 250 micron probe pitches to match the 150 micron pad pitches used for this second board. The measurements on the fifth board utilized the Agilent Technologies N5230A PNA-L 4Port Network Analyzer and custom-made probes and SOLT calibration substrates. Full four-port S-parameters were acquired for each differential line structure. Skew was computed from the
514
SUB-BOARD A
6
SUB-BOARD B
6
2 0 -2
4
2 0 -2
5
15
25 35 45 Line Number
6
5
15
25 35 45 Line Number
55
5
15
25 35 45 Line Number
55
SUB-BOARD F
SUB-BOARD E
6
4
0
-4
55
SUB-BOARD D
2
-2
-4
-4
SUB-BOARD C
6
4
4
Skew, ps
10o / 100o
Skew, ps
0o / 90o
4
2
Skew, ps
45o / 135o
Weave Skew Measurement Results Our measurement results from our first test board are summarized for a first and a second panel (that is, two copies of the same test board) on Figure 3 and Figure 4, respectively. These are stem plots where the horizontal axis shows the structure numbers (or structure indexes) and the vertical axis shows the skew of the positive (true) signal with respect to the negative (complement) signal. We will refer to positive and negative signals as “P” and “N”, respectively, throughout the remainder of this document. We observed that weaveeffect skew can vary dramatically between stripline pairs adjacent to one another – sometimes showing ‘sinusoidal mixing patterns’ as shown by [1,2] but other times having much less cohesive patterns. Weave-effect skew was shown to vary with location both within a panel and from panel to panel. Sub-board C of our first panel (see upper right plot of Figure 3) showed a strong sinusoidal pattern whereas the other sub-boards on the same panel show more random skew. All sub-boards exhibited a positive mean (average) skew across all measurements within each sub-board. The second panel (referring to Figure 4) shows similar but definitely different results when compared to the results of the first panel. The two right-most boards on this second panel show sinusoidal patterns but differ in peak to peak spacing from each other and from the pattern on Sub-Board C of the first panel. In addition, the non-zero average skew was very noticeably reduced. Even though all of the first test boards were built at the same time the variability of the skew plots shown by Figure 3 and Figure 4 demonstrate how unpredictable skew can be.
Skew, ps
90o / 135o
-10 o / 80 o
measured phases divided by the frequency across the two striplines within the differential pair. We observed some frequency dependence of skew which we believe was related to resonances with our test instrumentation and probe/via launches. In light of this fact, we chose to perform averaging to obtain more uniform results. Skew was computed by averaging measured skew of each line in a given pair between 4 and 6 GHz with the intent of targeting skew for 5 GHz which is the fundamental frequency of 10 Gb/s NRZ data.
Skew, ps
We built a third set of test boards as depicted in Figure 2 where different boards were rotated by 0, 10 and 45 degrees. We repeated the same stripline design as that of the first test boards in using .005” wide differential striplines with .007” spacings. However, we shortened the stripline lengths from five to four inches due to spacing considerations. We also added vertically running stripline pairs since warp yarns, which run along a roll of cloth, and fill yarns, which run across a roll of cloth, often have differing pitches and differing fiber bundle shapes – one may be flatter and wider than the other. For these boards there are 63 stripline pairs running horizontally and another 63 pairs running vertically. There are additional smaller patterns where some lines jog 0.001” for every 0.1” traveled. At the time of this writing these jog-pattern structures have not been measured so further details of these structures will not be discussed. This third test board design was built in three versions with these materials: 1) Nelco 4000-13, 2) Nelco 4000-13 SI, and 3) An advanced material with low-loss characteristics.
0 -2 -4
2
Defective Board
0 -2 -4
5
15
25 35 45 Line Number
55
15
25
35 45 Line Number
55
JAN_14 / 2008 / BRB / 23192
Figure 3 – Skew results on first of two test panels
2008 Electronic Components and Technology Conference
SUB-BOARD C
4
4
4
2 0
-2 -4
Skew, ps
6
2 0
15
25 35 45 Line Number
55
-4
2 0
-2
-2 5
5
15
25 35 45 Line Number
55
-4
25 35 45 Line Number
55
6
4
4
2
Defective Board
0
-2
Skew, ps
Skew, ps
15
SUB-BOARD F
6
-4
5
SUB-BOARD E
SUB-BOARD D
been highlighted in yellow to examine bundle position with respect to the signal pairs. Note that this particular board uses two layers of fiberglass reinforcement both above and below the signal lines. The left-hand signals are the P signals whereas the right-hand signals are the N signals of the layer pair. For signal pair 51 (left set of cross-sections) with +6 picoseconds of skew, we expect that the left (P) signal of the pair will have fiber bundles noticeably aligned above and below the signal whereas its right (N) signal should have a lack of fiber bundles above and below the signal. Furthermore, the right-hand side cross-sections should show a randomness regarding fiber bundle alignment to either P or N signal. Contrary to these expectations, we did not observe any discernable pattern for either of the differential pairs in these selected cross-sections.
2 0
-2 5
15
25 35 45 Line Number
55
JAN_14 / 2008 / BRB / 23193
-4
5
15
25 35 45 Line Number
55
Figure 4 – Skew results on second of two test panels
A fiberglass bundle typically has a much higher dielectric constant than that of the surrounding resin. It is commonly thought that maximum skew is obtained when one of the differential pair signals runs directly over a fiberglass bundle whereas the other signal runs over the resin between the fiberglass bundles. This scenario is depicted in Figure 5, where the right hand side top and middle regions depict two cases of balanced conductors whereas the lower region depicts a case of maximum weave skew. For an array of differential pairs that are spaced on a fixed pair-to-pair pitch that is different from the weave pitch, then a sinusoidal mixing pattern can be expected. Therefore, we elected to examine the structures in Sub-Board C on the first panel in more detail since these structures yielded the most pronounced skew patterns.
Line Pair #51 Has +6.2 ps P/N Skew
CROSS SECTION #1
CROSS SECTION #2
CROSS SECTION #3
Line Pair #44 Has +0.3 ps P/N Skew
SUB-BOARD B 6 Skew, ps
Skew, ps
SUB-BOARD A 6
CROSS SECTION #4
JAN_14 / 2008 / MJD / 23195
Balanced Phase Lowest Impedance
Resin (Er~ ~ 3.2)
Figure 6 – Fiber bundle locations in relation to striplines having highest and near-zero skew
Balanced Phase Highest Impedance
Weave ~ 5.0) (Er~
Differential Stripline Pair Unbalanced Impedance and Phase
Woven Fiberglass Cloth Differential Stripline Pairs
JAN_14 / 2008 / MJD / 23194
Figure 5 - Origins of weave-induced skew Referring back to the results of Sub-Board C of the first panel as shown by Figure 3, we find that differential pair 51 has the highest skew at approximately 6 picoseconds whereas differential pair 44 has no measurable skew. In order to attempt to correlate the relative trace to weave alignment with measured skew, we performed four cross-sections of these differential pairs uniformly along their length. The resulting cross-sections are shown in Figure 6. Each of the four crosssections are stacked up vertically with line pair number 51 shown on the left and line pair number 44 shown on the right hand side of this figure. Each of the four cross-sections depicts the same layer-pair with its upper and lower ground planes (signal layer 6 of an eight layer board). The fiber bundles are roughly the shape of a flattened eye and have
Even though we observed that both skew magnitude and statistical correlation between neighboring traces differed from panel to panel and even within boards of the same panel, there is a strong desire to be able to derive simple models to predict skew. In order to develop such a model, we examined the probability density of the skew for all the differential pairs of panel 1. A plot of the skew probability density function (PDF) is shown on the left side of Figure 7 with skew plotted on the horizontal axis and probability density plotted on the vertical axis. Despite the differing behaviors of skew within the sub-boards, the PDF fits very well to a Gaussian curve with a mean value of 1.7 picoseconds and a standard deviation of 1.63 picoseconds. We will attempt to explain this non-zero mean later in this paper. In addition to characterizing the skew of the measured 5 inch stripline differential pairs, we wanted a means to extrapolate the results from the shorter lines to much longer lines representative of the maximum stripline lengths used in an actual system. An accurate extrapolation from measurements on shorter lines to estimated skew for longer lines is essential. For example, a simple linear extrapolation
515
2008 Electronic Components and Technology Conference
DISTRIBUTION OF SKEW OF 15 PAIRS AT 5 GHz 3.0 2.5 Number of Observations
may be very overly conservative. Therefore, we examined 1000 cases of 40” line pairs where each of these longer line pairs are created by cascading measured s-parameters from eight randomly selected five inch lines. The s-parameter measurements of the lines were cascaded with Synopsys HSPICE. The results of this study are shown in the right hand plot of Figure 7 and again show a very strong fit to a Gaussian PDF. We note that the mean has increased by a factor of 8.7 which is quite close to the expected value of 8.0. Now we expect the standard deviation to increase by a factor of the square root of 8.0; that is, the expected standard deviation should be 4.8 picoseconds. The actual standard deviation is 5.2 picoseconds which again is very close to the expected value if we assume a Gaussian distribution.
= -0.477 = 3.35
2.0 1.5 1.0 0.5
S-parameters of 8 Randomly Chosen 5 Inch Differential Pairs, Cascaded Together
0.0
S-parameters of 40 Inch Differential Pair
25
20
15
10
JAN_14 / 2008 / BRB / 23197
0.08
0.30
Density
Density
0.06
Skew at 5 GHz Gaussian Fit
0.20 0.15
0.04
0.02
0.05 0.00
= 14.22 = 5.2
0.05
0.03
0.10
0.01 4
2
0
Data
2
4
6
0
10
15
20
25
Skew at 5 GHz Gaussian Fit
0.07
= 1.63 = 1.7
0.25
0 5 Skew, ps
Figure 8 – Skew measurements on PTFE board
8 RANDOMLY CASCADED 5" STRIPLINES
SEPARATE 5" STRIPLINES 0.35
5
5
JAN_14 / 2008 / BRB / 23196
0
5
10 15 Data
20
25
30
Figure 7 – Skew across entire panel and extrapolated to 8X longer line In addition to this first test board, which used Nelco 400013 SI laminate materials, we also had another previously built test board (described in the Introduction as our “second” test board). As previously described, this particular board used a PTFE-based material system with some fiberglass reinforcement. We took measurements on 15 differential stripline pairs. The measurements are summarized in Figure 8. What we found most interesting is that the standard deviation of the skew for our second test board is about 3.4 picoseconds, or twice that found with our previous testing on the Nelco 4000-13 SI boards. We believe that the higher skew is due to the fact that the PTFE in these boards, having a very low dielectric constant (approximately 1.9), contrasts more with the high dielectric of the fiberglass reinforcement which we estimate to have a dielectric constant of approximately 6.5 – thereby the resulting material set would then have a higher amount of weave skew compared with the Nelco 4000-13 SI material.
Weave Skew Mitigation There are 17 possible skew mitigation techniques as suggested by [4]. Using our previously described third test board (depicted in Figure 2), we primarily examine skew mitigation by rotating stripline direction with respect to weave direction. The measured standard deviations of the skew for all three rotation angles and all three differing materials are summarized in Figure 9. Generally, either 10 or 45 degree rotation reduces the skew significantly, with the 10 degree rotation perhaps a little more effective than that of the 45 degree rotation. For all six classes of sub-boards with rotated lines, that is, both 10 and 45 degree rotations and across all three material systems, the standard deviation of the skew is less than 0.2 picoseconds. We have not yet studied our measurement accuracy and therefore these very low values of skew may include additional error terms with measurement accuracy and probe/via launch repeatability. However, we will later make the case that one-sigma skew values of less than 0.2 picoseconds for these four inch lines is more than adequate for 10 Gb/s systems. Again, we note that these skew values were measured on four inch lines, whereas the skew values reported earlier on the first test boards were for five inch lines. We avoid presenting our results in terms of skew per inch given our preliminary studies (above) which show that skew standard deviation is not proportional to line length, but rather, follows Gaussian statistics. But we also avoid directly presenting our skew measurements in terms that fit Gaussian behavior as our testing up to this point is quite minimal due, in part, to labor involved in taking a more statistically significant number of measurements. We find that the skew for the striplines with 0 degree rotation has increased by a factor of four versus our first test board. This could be due to differing fiberglass reinforcements being used or some other effect. But these results serve notice that it may be necessary to specify exactly
516
2008 Electronic Components and Technology Conference
the same laminate materials if one expects to observe similar skew. If rotation is utilized then hopefully the skew is minimal enough such that higher skew can be tolerated if differing laminate materials are utilized pending impedance adjustments or material availability at the PWB fabrication facility. The reported skew shown in Figure 9 is computed from measurements on signal line pairs running in the horizontal direction. A smaller sampling of measurements on striplines in the vertical direction yielded similar skew characteristics. Oddly, we did not see significant skew reduction with the Nelco 4000-13 SI material versus the Nelco 4000-13 material. The former uses the NE glass where the latter material uses the more common E glass. The NE glass has a somewhat lower dielectric constant which suggests that a material system with NE glass would have a more electrically homogenous behavior, i.e., the NE glass and resin have dielectric constants that are more closely matched than that of E glass and the resin.
Standard Deviation of Skew, ps
9
than what is needed to satisfy skew requirements such that stripline orientation to the worst case pulled weave is still a few degrees different. However, there is very little information available on the variability of the pulled weave angles, and increasing rotation angles increases scrap and therefore adds cost to the manufacturing of the board.
8o
8.29 6.84
6.49
8
JAN_14 / 2008 / MJD / 23200
7
Figure 10 - Non-orthogonal weave orientation
6 5 4 3 2 1
0.183 0.185
0.171 0.165
0 Advanced Material
Nelco 4000-13 SI Dielectric Materials
0.183 0.121
Nelco 4000-13
0 45
10
Rotation (Degrees)
JAN_14 / 2008 / KJB / 23199
Figure 9 - Summary of skew on third test board To investigate the degree to which fiberglass bundles can wander from true orthogonal position within the various layers in a PWB, we took a number of planar cross-sections of our third test board. This method required dissecting the board into sample sizes no larger than about .200” by .200” (so we could only view small areas of the board) and then grinding and polishing away successive layers to the expose individual weave layers. We chose to look in the upper right corner of the boards with the 0 degree rotation. We found on numerous occasions weave that was pulled more than a degree or so from true position. In the worst case we found an instance where the weave was pulled 8 degrees from true position in one direction whereas the cross-weave had virtually no rotation. This case is shown in Figure 10. Note that typical striplines will have one to two layers of fiberglass reinforcement both above and below the stripline. In this case, the effects of pulled weave may be somewhat averaged out. However, if, for the intent of weave skew mitigation, one chooses to rotate artwork 8 degrees with respect to the expected direction of the weave, then is could actually result in significantly worse skew than if no rotation was used. Therefore, one may be tempted to specify even more rotation
Other Sources of Skew In many cases weave-induced skew is expected to dominate total skew seen within a SerDes channel. However, it is important not to neglect other sources of skew. One other source of skew can come from unbalanced P/N routing lengths in PWBs and packages. In many cases, much of the routing length difference in one region of the differential pair route is compensated in another location where routing congestion is minimal. However, sometimes congestion is too great, or other factors arise such that not all P/N lengths can be matched exactly. Skew can also arise when one of the striplines within a pair is routed closely to plane voids and/or vias and is loaded differently than the other stripline within the same pair. PWB layer-to-layer misregistration will increase the variability of this type of skew. If connectors are used then one should note that many of the commercial connectors, especially the right-angle connectors, will have unmatched lengths within a differential pair. Sometimes, these unmatched connector paths are compensated for in the PWB design but it is often difficult or not possible to implement PWB routing rules to compensate for scenarios such as these. Differential vias can be problematic with respect to skew. Due to routing congestion it is not always possible to design vias that are symmetrically loaded. For example, there may be room for a ground via near the P via but no room for a ground via near the N via. Or it may not be possible to route symmetrically into and out of a differential via. Layer to layer misregistration can also affect the skew within a differential via. Misregistration typically increases with larger boards, increased layer count, and with some of the
517
2008 Electronic Components and Technology Conference
various directions to replicate the effects of layer-to-layer misregistration. Four of the nine different via patterns are shown in the upper half of Figure 12. Each structure consists of a differential via pair connected together by stripline on layer 8 of a 10 layer, .095” thick PWB. Microstrips connect the differential vias to microwave probe pads. Complete Differential Via Test Structures North Shift
Northeast Shift
East Shift
Nominal
lower loss materials which are often specified for higher data rate applications. Figure 11 shows the cross-section of two vias where there is up to 0.005” of layer-to-layer misregistration. The via on the left hand side is a design with all unused via pads removed to decrease via capacitance and thereby increase via electrical performance. The via on the right-hand side did not have unused pads removed but better illustrates how layers moved in this particular board build.
P Path
~.005"
Via With Unused Pads
0
Differential Return Loss ( SDD11 )
-10
1
-20 0
-1
.012" Diameter Vias
Skew ( P Minus N Path )
-2 4.9
-30
dB
Via With Unused Pads Removed
Picoseconds
2
N Path
Nominal (Centered) North Shift Northeast Shift East Shift 5.0 Frequency, GHz
-40 -50 5.1
-60 0
JAN_10 / 2008 / MJD / 23202
2
6 4 Frequency, GHz
8
10
Figure 12 - Differential Via Skew and Return Loss
JAN_08 / 2008 / MJD /23201
Figure 11 - Via cross-section showing layer-to-layer misregistration Layer-to-layer misregistration can easily explain positive mean values of skew across a set of test structures such as with the first test boards previously described. For example, if a via were drilled .0015” above the true center of a pad, where the stripline is assumed to be launching outward (to the right) then one would expect added skew of about 0.5 picoseconds. This is simply a time-of-flight calculation, using 0.17 picoseconds per mil of length, where the signal path length of .0015” is added between the probe pad and the signal, and another .0015” path length is added between the via and the launching stripline for a total of 0.003” added path length. If we assume that the via to pad misregistration is uniform for all four vias within the two probe/via launches for this particular stripline pair, then the skew is doubled since the complement has a .0015” shorter path than nominally excepted. The skew is doubled again, since there are vias at both ends of the striplines. Therefore the expected skew for all the striplines if a .0015” misalignment has occurred is approximately 2.0 picoseconds. Our simple time-of-flight calculations may well not apply for a 3-D structure such as a via, but our example certainly can explain some of the nonzero mean values that we measured, particularly the 1 to 1.5 picoseconds of average skew seen with the sub-boards on the first panel of the first test board (refer back to stem-plots of Figure 3). Our fourth test board was measured to investigate the effect of layer-to-layer misregistration on via skew and loss performance. This fourth PWB employed via voids offset in
We measured less than 1.5 picoseconds of skew for two differential vias. The vias with the worst case skew had the lateral shift (labeled “east shift”), which was expected, since the mismatch of capacitive loading between P and N vias should be maximized with a lateral shift. Since the upper and lower via pairs with a lateral shift are symmetric we expect the skew from each pair to be additive such that the total skew is comprised of equal skew contributions from both via pairs. This means that, with a total measured skew of 1.5 picoseconds for the entire structure, then the skew from each via pair is approximately 0.75 picoseconds. In contrast, the skew of vias with a west shift was measured to be approximately -0.5 picoseconds for the via pair, which is only one-third the skew of the vias with the east shift. We noted that skew of the nominal via is about 0.25 picoseconds which adds to the measured skews of the vias with both east and west shifts. If we substract out this skew from the nominal via we obtain 1.25 and -0.75 picoseconds for the respective vias with the east and west shifts and as such the magnitude of the skew from both vias is much closer than without the correction for the skew from the nominal via. In our measurement we perform an SOLT calibration on a ceramic calibration standard. So we believe that part of the non-zero skew, which we observed in the measurement of the skew from the nominal via, can come from our probe launches. Figure 13 shows X-ray images of one of the differential via pairs for nine of the differential via patterns. The lower right image has no void offset and the X-ray verifies that layer-to-layer misregistration is minimal. We note that, as an X-ray is a point source, voids appear larger from the top to the bottom layer. This is a well-known imaging artifact termed parallax error. This parallax error can make it appear that layers have less or more misregistration than the actual amounts. For the remaining eight imaged designs we simply
518
2008 Electronic Components and Technology Conference
shifted all voids together by 0.005” in one of eight directions as indicated by the arrows superimposed on each image.
(No Offset)
JAN_08 / 2008 / MJD / 23203
Note: Arrows Indicate Direction of Deliberate .005" Offset
Figure 13 - X-ray images of vias with intentional layer offsets
Board #2 91 Measurements
30
30
20
20
20
10
10
10
0
0
0
-10 0
Total Measured P-N Skew, ps
Board #1 91 Measurements
30
10
20
30
Board #4 92 Measurements
-10 0
10
20
30
Board #5 91 Measurements
30
30
20
20
10
10
10
0
0
0
10 20 30 Net Length, Inches
-10
0
10 20 30 Net Length, Inches
Differential Insertion Loss (SDD21 )
0
-10 0
20
-10 0
Board #3 93 Measurements
10
20
30
-10
Board #6 93 Measurements
-10 0
5.0 GHz
-20
-30 0
dB
Figure 14 – Skew on actual system boards
4 6 8 10 Frequency, GHz Differential to Common Mode Reverse Conversion (SDC11) 0
-20
-20
-40
-40
-60 No Skew 0.2 UI Skew 0.4 UI Skew
-80 -100
the skew was shown to be a weak function of increasing line length. Should the skew follow Gaussian behavior, then we would expect skew to be related to the square root of the line length. Alternatively, skew that is dominated by effects other than weave effects would show little dependence on line length. Whereas, the analysis we described immediately above did not suggest that vias were the source of a lot of skew, there could still be factors adding skew to the vias in this board such as non-uniform ground via loading and asymmetric routing entry into these vias which could cause
2
Differential to Common Mode Forward Conversion (SDC21)
0
10 20 30 Net Length, Inches
JAN_14 / 2008 / MJD / 23204
0.5 dB
1.8 dB No Skew 0.2 UI Skew 0.4 UI Skew
dB
30
Skew Budgeting In addition to characterizing and measuring skew from weave effects and other sources, it is important to determine a budget for acceptable levels of skew. Figure 15 shows simulated S-parameters for a hypothetical SerDes channel targeted for 10.0 Gb/s data rates. This particular channel utilizes 36” of total stripline length. The upper plot of this Figure 15 gives simulation results showing the effects of increasing insertion loss and the lower plots show increasing differential to common mode conversions for backplane skews of 0, 0.2 and 0.4UI. These results indicate that skew levels of 0.2UI are acceptable, providing that the additional 0.5dB of differential insertion loss is tolerable. At 10.0 Gb/s, 0.2UI equates to 20 picoseconds. We are inclined to be guarded and allow 10 picoseconds of the skew for weave effects and the remaining 10 picoseconds of the budget for other effects. Assuming Gaussian statistics, 10 picoseconds of skew across 36” will be equivalent to 3.33 picoseconds of skew for four inch long lines. For a system to have a low failure rate due to skew effects, for example a 0.1% failure rate for a system with 1000 nets, we will require an expected failure rate of less than 1 net per million cases. This translates to a weave skew distribution of +/- 5 sigma – meaning that for a four inch line we can tolerate a one-sigma skew of only 0.6 picoseconds. Our measurements to date show that striplines with no rotation relative to weave direction fell far short of meeting these goals whereas striplines with rotation exceeded the 0.6 picosecond goal by over a factor of three.
dB
Total Measured P-N Skew, ps
To get an idea of how much total skew is associated with SerDes channels in a complex board (as opposed to simple test structures), we analyzed measurements from a fifth board which is a pre-existing system board. We measured 91 differential structures across six different boards. The absolute value of the skew was extracted and plotted versus line length as shown in Figure 14. For these boards, net lengths ranged from 0.27” to 31.4”. Somewhat surprisingly,
more than the sub-picosecond via skew that we measured as reported above. We also know that there are a few picoseconds of skew for many of these nets due to residual P/N routing length mismatches.
0
2
4 6 Frequency, GHz
-60
No Skew 0.2 UI Skew 0.4 UI Skew
-80 -100 8
10
0
2
4 6 Frequency, GHz
8
10
JAN_14 / 2008 / MJD / 23207
Figure 15 – Budgeting for Total Skew Conclusions We have shown that weave skew is quite variable and unpredictable – sometimes showing very little coherence but other times showing distinct patterns across arrays of differential stripline pairs. We saw this contrasting variance and coherence not only from differing panels but also between smaller sub-boards within the same panel. We also
519
2008 Electronic Components and Technology Conference
have shown that measurements over an entire panel fit very well to that of a Gaussian distribution. We have demonstrated that very low levels of skew are achieved by rotating stripline orientation with respect to weave bundle orientation. In one case, weave bundle orientation was observed to be pulled 8 degrees from true position. This weave pulling may be problematic when rotating artwork with respect to nominal weave direction to mitigate skew effects. For our particular study, we did observe very low levels of skew for our test structures that were rotated either 10 or 45 degrees from nominal weave orientation. We studied skew effects from differential vias, finding that skew change was less than one picosecond despite having .005” layer to layer misregistration. Measurements of previously built system boards illustrated that a high percentage of nets on each board exhibit more skew than what would have been tolerable for 10 Gb/s systems – yet this skew was not a strong function of total route lengths. We studied the effect that total skew has on overall SerDes performance and conclude that up to 0.2UI of P/N skew is tolerable. We developed a budget with one-half of the allowable skew allocated to weave skew, and subsequently determine that for our example with 36” stripline lengths, we required 0.6 picoseconds of skew per four inch line to achieve a 99.9% yield for a board with 1000 SerDes differential pairs running at 10 Gb/s. Although our studies suggest that with stripline-to-weave rotations we can easily meet our skew budgets, we have seen many strange results both with weave structure testing and sampling from real system boards. We recommend that designers request information from the PWB suppliers on specific laminates used for the build of their boards. Each laminate differs by the type and number of fiberglass cloths used. The skew of the boards should be measured and tracked and the fabrication drawing specifications to the PWB vendor should exclude any laminates that have not first been characterized. Variability of weave pull and even the variance of the thread counts per inch complicate this screening significantly. Other materials, such as non-woven reinforcements or tight weave materials may offer a workable solution in lieu of, or in addition to, stripline-to-weave rotations. The Gaussian behavior of skew variability should continue to be investigated. Lines of differing lengths should be built to validate that skew increases with the square root of the line lengths. Until the variabilities described above can be better characterized and a statistical model such as one employing Gaussian statistics can be confirmed, screening all of the nets on a system board [5] will be necessary to avoid fully building and populating systems having one or more channels with unacceptable skew. The advantage of screening all of the nets on a system board is that total skew is measured, thereby also screening for systematic skew, i.e., skew that is expected due to particular design implementations. Also skew arising from other manufacturing tolerances such as layer to layer misregistration is also screened with testing of a full system board.
In conclusion, we expect that SerDes channel skew will present significant design challenges for systems employing data rates of 10 Gb/s and above. A large part of channel skew can be due to weave-effect but it is difficult for the PWB industry to quickly adapt to low-skew approaches. This is complicated by the fact that there are a lot of players in this industry, starting with the fiberglass cloth suppliers, followed by the laminate suppliers, then followed by the PWB manufacturers and finally to the signal integrity design engineer. Certainly the early adopters of 10+ Gb/s systems will have the design resources to overcome these issues, albeit, perhaps by specifying more advanced materials to mitigate weave-effect skew. However, before 10+ Gb/s systems can be mainstreamed it should be incumbent on the PWB manufacturers to produce boards with weave skew compliance, just as they now do with meeting characteristic impedance specifications. Acknowledgments We wish to thank Steven Richardson, Elaine Doherty, Deanna Jensen, and Theresa Funk for graphics preparation. We also wish to thank Shaun Schreiber for gathering the measurements and Jim Bublitz and Kerry Holm for material preparation and Kerry Holm and Devon Post for board design. References 1. Heck, H., et al, “Impact of FR4 Dielectric NonUniformity on the Performance of Multi-Gb/s Differential Signals”, Electrical Performance of Electronic Packaging, Oct. 2003, pp. 243-246 2. Heck, H., et al, “Modeling and Mitigating AC Common Mode Conversion in Multi-Gb/s Differential Printed Circuit Boards”, Electrical Performance of Electronic Packaging, Oct. 2004, pp. 29-32 3. McMorrow, S. and Heard, C., “The Impact of PCB Laminate Weave on the Electrical Performance of Differential Signaling at Multi-Gigabit Data Rates”, DesignCon 2005 4. Loyer, J., Kunze, R., and Ye, X., “Fiberweave Effect: Practical Impact Analysis and Mitigation Strategies”, DesignCon 2007 5. Schraufnagel, D. J., et al, “Fully Automated Large Form Factor (2' X 3') Four-Port Differential 20 GHz Vector Network Analyzer Test System with Real Time Link Characterization. IEEE AUTOTESTCON 2007, Session C.1 ATS Framework, September 17-20, 2007, .Baltimore, MD.
520
2008 Electronic Components and Technology Conference