COMPUTING IN CIVIL AND BUILDING ENGINEERING ©ASCE 2014
System-of-Systems Modeling of Performance in Complex Construction Projects: A Multi-Method Simulation Paradigm Jin Zhu1, Ali Mostafavi2, and Irtishad Ahmad3 Downloaded from ascelibrary.org by Texas A&M University on 10/29/16. Copyright ASCE. For personal use only; all rights reserved.
1
Ph.D Candidate, Department of Civil and Environmental Engineering, College of Engineering and Computing, Florida International University, Miami, FL, Email:
[email protected] 2 Assistant Professor, OHL School of Construction, College of Engineering and Computing, Florida International University, Miami, FL, Email:
[email protected] 3 Professor and Director, OHL School of Construction, College of Engineering and Computing, Florida International University, Miami, FL, Email:
[email protected] ABSTRACT In this paper, a framework is proposed for the investigation of base level components in the assessment of performance in construction projects. A multimethod simulation paradigm is proposed to provide a structure for bottom-up abstraction and modeling of construction projects based on micro-behaviors at the base level. The proposed framework and the model are used in a numerical example related to concrete pouring to evaluate the impacts of micro-behaviors at the base level on project performance. The findings of the case study highlight the importance of modeling the base level components and demonstrate the capability of the proposed framework in enhancing the assessment of performance in construction projects. INTRODUCTION Performances failures, such as cost overruns, schedule delays, and quality deficiencies significantly affect the efficiency of investment in construction projects. A better assessment of performance is contingent on modeling the processes and micro-behaviors in construction projects. In one stream of research, different methodologies (e.g., CPM, PERT, Cyclone, and STROBOSCOPE) were created for modeling the performance of construction projects in terms of time, cost, and quality. However, the disparity between the simulated and actual project performance measures has revealed that there are context-level factors (Lee et al. 2007) that affect the performance of construction projects that could not be captured in the abovementioned models. The reason for this disparity is that the existing methods investigate construction projects as monolithic systems in which the level of abstraction is at the activity level. In reality, complex construction projects are systems-of-systems (SoS) consisting of different interconnected networks of processes, activities, resources, and players. Systems-of-systems have different traits compared to monolithic systems; and their investigation requires a bottom-up approach in which the dynamic behaviors of the constituents are analyzed at the base level (Mostafavi et al. 2011). The objective of this paper is to propose a framework
Computing in Civil and Building Engineering (2014)
1877
COMPUTING IN CIVIL AND BUILDING ENGINEERING ©ASCE 2014
for SoS modeling to facilitate consideration of base-level components in assessment of performance in construction projects.
Downloaded from ascelibrary.org by Texas A&M University on 10/29/16. Copyright ASCE. For personal use only; all rights reserved.
CONSTRUCTION PROJECT SYSTEM-OF-SYSTEMS FRAMEWORK In the proposed framework for assessment of construction project system-ofsystems (CP-SoS) (Table 1), construction projects are analyzed at four levels. The level of abstraction is at the base-level, where human agents perform tasks using resources and information. In the proposed framework, the outcome of each level is obtained from the aggregation of the dynamics at the levels below. Table 1- Levels of analysis in CP-SoS Name Base Level
Level Alpha (α)
Activity Level
Beta (β)
Process Level Project Level
Gamma (γ) Delta (δ)
Description Base level components include human agents, resources, and information Collection of base-level constituents and their interactions, organized in an activity network Collection of activities in a process Collection of processes in a project
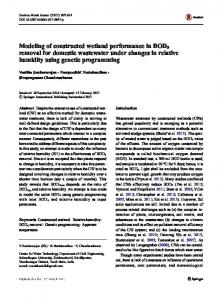
The fundamental premise underlying the proposed CP-SoS framework is that construction projects consist of human agents, information, and resources at the base level. If these components are abstracted and properly modeled, the performance of construction projects can be investigated more accurately. At the base-level of CPSoS, human agents are entities who use their bounded rationality to conduct production work or to process information and make decisions. Different human agents have different risk attitude, working habit, and skill level traits, which can directly influence their behaviors and can change over time. Resources are entities that facilitate production work, and they can be categorized as capital, material, and equipment. One of the important factors affecting the variations in the performance of construction projects is resource uncertainties (e.g., availability and quality of material and the productivity and condition of equipment). The last component of the base level in the CP-SoS framework is information, which can be either static or dynamic in nature. Static information remains unchanged throughout the project, for example, requirements related to regulations, building codes, and specifications. On the other hand, dynamic information can be generated and can evolve during the project. Examples of dynamic information include the decision made by a human agent, the outcome of an activity, and accidents which sometimes happen unexpectedly. The proposed framework also includes a multi-method simulation paradigm (Figure 1) to facilitate abstraction and modeling of base-level components using the following steps: (1) The micro-behaviors at the base-level are simulated using agent-based simulation. Agent-based modeling facilitates simulating the dynamic behaviors related to the information processing, decision-making, behavioral issues, and risk attitudes of the agents (Mostafavi et al. 2013). (2) The outcomes of the micro-behaviors at the base level are aggregated at the activity level, where the interdependencies between the activities are modeled using discrete-event simulation. (3) The outcomes related to the interactions between construction activities are aggregated at the process-level, where the interdependencies between the processes are modeled using system dynamics simulation. A multi-method paradigm provides
Computing in Civil and Building Engineering (2014)
1878
COMPUTING IN CIVIL AND BUILDING ENGINEERING ©ASCE 2014
1879
Activity Level Process Level
Downloaded from ascelibrary.org by Texas A&M University on 10/29/16. Copyright ASCE. For personal use only; all rights reserved.
the capabilities of the three simulation approaches simultaneously to model the baselevel components.
Base Level
Figure 1. Multi-method simulation paradigm of CP-SoS NUMERICAL EXAMPLE A numerical example is used here to illustrate the application of the proposed framework in a hypothetical case. Three activities related to pouring concrete are considered. The numerical example only considers the construction process and does not investigate the interdependencies between the processes. The objective of the numerical example is to demonstrate the significance of the abstraction and modeling of construction projects at the base-level. Case description. 80 cubic yards of concrete is needed for pouring a concrete slab. Three activities are modeled in the course of pouring concrete: ordering, delivery and testing, and pouring. At the beginning of the process, a procurement agent orders the required concrete from the concrete supplier. After the order is placed, mix trucks start to be sent to the jobsite. The mix trucks used for concrete delivery have a capacity of ten cubic yards. Eight trucks in total are required for the concrete slab. The quality of concrete, measured by the slump test, varies across the batches transported by the trucks. If the results of the slump tests do not meet the requirement defined by the slump acceptance range, the delivered concrete in a specific truck is rejected and a redelivery is required. An inspector is responsible for testing the slump, which is conducted randomly, of the concrete delivered and making the decision on whether or not to accept the delivered concrete. The delivered concrete is poured if tested and approved, or if the inspector chooses not to test it. The likelihood of testing depends on both the risk attitude and the behavioral attitude of the inspector at the time of delivery. Different inspectors have different risk attitudes: risk-neutral, riskseeking, and risk-averse. A risk-seeking inspector will always avoid conducting the test because he trusts in luck, and a risk-averse inspector is on the opposite side. An inspector of a specific risk attitude type, however, can have different behavioral attitudes over time. Three states of behavioral attitude can exist for the inspector: neutral, optimistic, and pessimistic. The behavioral attitude of the inspector changes during the process of delivery and testing, depending on the test results from the previous deliveries. The activity of pouring begins after delivery and testing finishes. The base level components related to the activity of delivery and testing are summarized in Table 2.
Computing in Civil and Building Engineering (2014)
COMPUTING IN CIVIL AND BUILDING ENGINEERING ©ASCE 2014
Table 2. Base-level components related to the activity of delivery and testing Components Human agent Resource
Downloaded from ascelibrary.org by Texas A&M University on 10/29/16. Copyright ASCE. For personal use only; all rights reserved.
Information
Types Inspector Concrete Mix truck Slump acceptance range Test result
Categories and attributes Risk attitude, behavioral attitude Slump of concrete in each truck Arrival time, finish time Static information from specification Dynamic information from each test
Computational model. Anylogic 6.9.0 was used to create the computational model related to the hypothetical case. Agent-based modeling and discrete-event simulation techniques were implemented in modeling the dynamic behaviors and interdependencies related to the base level components and their aggregation at the activity level, respectively.
Figure 2. (a) Class diagram and (b) Sequence diagram of agent-based model The Unified Modeling Language (UML) for agent-based modeling (ABM) (Bersini 2012) is used to explain the computational model. The class diagram (Figure 2a) defines the organization and the static relationships in the model, representing agents as different classes. Five classes are identified in the model: procurement agent, mix truck, inspector, concrete pouring crew, and main class, among which only mix truck has multiple objects in its class. The main class has a composition relationship with all the other agents, meaning that all the actors of the simulation are embedded in the main class. Mix truck and inspector have a one-to-many association relationship because one inspector at the jobsite will make decisions on the delivery of each mix truck that arrives. The characteristics and capacities of the agents are stored in the attributes and operations of each class. Taking the mix truck class as an example, the attributes of each mix truck are its arrival time, finish time (whether accepted or rejected), and the slump of the fresh concrete it delivers. The operation stored at the bottom of the class is deliver, in which an object in the mix truck class delivers a truck of fresh concrete to the jobsite. The sequence diagram (Figure 2b) shows the sequence of events that characterizes the simulation experiment in a dynamic view by focusing on the message interchanges between objects. In the example, the procurement agent sends a message to the mix truck to start delivering.
Computing in Civil and Building Engineering (2014)
1880
Downloaded from ascelibrary.org by Texas A&M University on 10/29/16. Copyright ASCE. For personal use only; all rights reserved.
COMPUTING IN CIVIL AND BUILDING ENGINEERING ©ASCE 2014
Once the mix truck arrives at the jobsite, it sends a message to the inspector to start testing. If the inspector chooses to test and the test result is a failure, the inspector needs to send a message of redeliver to the mix truck class. The interactions between the inspector and the mix truck are repeated in a loop in the sequence diagram until eight trucks of concrete have been allowed to be poured. Then, the inspector sends the message of start pouring to the concrete pouring crew. For each class of agents, state diagrams and action charts are used to describe their dynamic behaviors. For the inspector agent class, the state and action charts (Figure 3) are used to model the decision-making process related to testing and accepting the delivered concrete. In Figure 3(a), the adaptive nature of a risk-neutral inspector agent is modeled using the three previously-defined behavioral attitudes. In the state of neutral, the inspector has a 50% chance to conduct the slump test. The likelihood of random testing will decrease in the optimistic state and increase in the pessimistic state. The transition between the states for the inspector is tracked by a variable called “BehavioralAttitude”, which has an initial value of 2, meaning the inspector is in the neutral state. When a mix truck arrives, if the inspector chooses not to do the test, his state stays the same. Otherwise, if the delivered concrete is tested and approved, the variable of BehavioralAttitude will increase by 1 with a maximum possible value of(b) 3 (state changes from neutral to optimistic, or from pessimistic to neutral, or stays optimistic), or if the delivered concrete is tested and rejected, BehavioralAttitude will decrease by 1 with a minimum possible value of 1 (state changes from optimistic to neutral, or from neutral to pessimistic, or stays pessimistic). The state of the inspector is adaptive as it changes based on the results of the previous tests. Figure 3(b) is part of the action chart for the inspector, illustrating the actions taken by the inspector when the mix truck arrives. First, the inspector decides whether to conduct the test. If the inspector decides not to test, the concrete in the specific truck is poured. Otherwise, the inspector does the slump test. If the slump test result is within the acceptance range defined by an upper-limit and lower-limit of slump, the delivered concrete is accepted and the inspector’s BehavioralAttitude updates. Otherwise, the delivered concrete is rejected and the inspector’s BehavioralAttitude updates. When the delivered concrete is rejected, the inspector sends a message to the mix truck agent class to deliver another truck of concrete to the jobsite. The action chart works in a loop, which ends as soon as the number of concrete trucks ready to be poured is equal to eight. A class of object, which is a discrete event model, is used to aggregate the micro-behaviors of the agents in each activity. Figure 4 shows the sequence of activities in the discrete event model. Table 3 summarizes the assumptions related to the parameters and variables used in the model pertaining to the hypothetical case.
Computing in Civil and Building Engineering (2014)
1881
Downloaded from ascelibrary.org by Texas A&M University on 10/29/16. Copyright ASCE. For personal use only; all rights reserved.
COMPUTING IN CIVIL AND BUILDING ENGINEERING ©ASCE 2014
(a)
(b) Figure 3. State chart (a) and Action hart (b) of inspector in model of the case study
Figure 4. Flow chart of activities in model of the case study Table 3. Assumptions for important parameters and variables in model of the case study Parameter or Variable Time for ordering Slump of concrete Single delivery time Slump acceptance range Test probability of a riskneutral inspector Time for pouring
Modeling Method Triangular distribution of typical negotiation time Uniform distribution between 20mm and 120mm Distance and speed (triangular distribution of average speed) From lower-limit of 50mm to upper-limit of 90mm 0.5 under neutral behavioral attitude; 0.3 under optimistic behavioral attitude; 0.7 under pessimistic behavioral attitude Quantity and crew productivity (triangular distribution of average productivity)
RESULTS The results of the simulation model related to the hypothetical case were analyzed in terms of time and quality performance. Time was measured by the total finish time of the three activities, and the quality was evaluated by the number of false acceptance times, in which case, the unqualified concrete was poured without being tested by the inspector. One hundred runs of the model were used to investigate project performance under different scenarios using Monte Carlo experimentation. Three major scenarios were considered: base case, variation in the slump acceptance range, and variation in inspector’s risk attitude. Base case: In the base case, the acceptance range of 50mm to 90mm for the slump test was static information from the specifications, and the behavior of the inspector was simulated in three behavioral states of the risk-neutral type. Out of the 100 runs in the base case, the average finish time for the three activities was 7.16 hours, with a maximum duration of 10.97 hours and a minimum duration of only 4.74 hours; and on average, 3.46 of the eight trucks of concrete used in the slab were accepted by mistake, which means 43.25% of the concreted used was unqualified.
Computing in Civil and Building Engineering (2014)
1882
1883
Change the slump acceptance range: In the base case, the acceptance range of 50mm to 90mm was used for the slump test as static information from the specifications. According to European Standard (BS EN 12350-2), deviation was allowed in the range limit to a certain degree. In this scenario, the acceptance range of slump was changed in the specifications of the hypothetical case to investigate the impacts on time and quality performance. Figure 5(a) shows that compared to the base case, the total time would decrease by 15.9% when the slump acceptance range was enlarged by ±10mm, and would increase by 15.3% when the range was narrowed down by ±10mm. Also, when the requirements for concrete quality were increased by narrowing down the acceptance range, the standard deviation of the finish time increased significantly, thereby causing a strong likelihood for severe schedule delays. In other words, the stricter the requirement for concrete quality is, the larger the chance for rejecting and redelivery is. In Figure 5(b), the distributions of the number of false acceptance times showed great variations in the mean values. When the acceptance range of slump was 40mm to 100mm, the qualified rate of concrete was 72.88%; and when the requirement increased to 60-80mm, the rate declined to 38.63%. Distribution of finish time under different slump acceptance ranges
Distribution of false acceptance times under different slump acceptance ranges 0.35
slump range 50-90mm 60-80mm 40-100mm
0.3
Mean StDev N 7.163 1.383 100 8.258 2.187 100 6.022 0.9262 100
0.2
slump range 50-90mm 60-80mm 40-100mm
0.30 0.25
Density
0.4
Density
Downloaded from ascelibrary.org by Texas A&M University on 10/29/16. Copyright ASCE. For personal use only; all rights reserved.
COMPUTING IN CIVIL AND BUILDING ENGINEERING ©ASCE 2014
Mean 3.46 4.91 2.17
0.20 0.15
StDev N 1.579 100 1.464 100 1.280 100
0.10
0.1 0.05
0.0
4
6
8
10
12
14
16
Total finish time (hr)
18
0.00
0
2
4
6
8
Number of false acceptance times
(a)
(b)
Figure 5. Time (a) and Quality (b) indicators under different slump acceptance ranges Change inspector’s risk attitude: Time and quality were also affected by the human agent’s risk attitude. In the base case, a risk-neutral inspector was assumed to be working at the jobsite. Assuming that the likelihoods of testing for a risk-averse inspector were 0.7, 0.5, and 0.9 under neutral, optimistic, and pessimistic behavioral attitudes, respectively and the likelihoods of testing for a risk-seeking inspector were 0.3, 0.1, and 0.5 under the corresponding states, respectively, comparative experiments were conducted for inspectors with different risk attitudes. Figure 6(a) shows that the duration of the work increased by 14.04% when a risk-averse inspector was involved in the project, and the duration decreased by 15.2% with a risk-seeking inspector compared to the base case. Regarding the quality performance, Figure 6(b) illustrates that a risk-averse inspector could reduce the probability of using unqualified concrete from 43.25% in the base case to 29.13%, while in the case of a risk-seeking inspector, the rate of false acceptance could rise to 52.38%.
Computing in Civil and Building Engineering (2014)
COMPUTING IN CIVIL AND BUILDING ENGINEERING ©ASCE 2014
Distribution of false acceptance times under differnt risk attitudes
Distribution of finish time under differnt risk attitudes 0.35
Mean 7.163 8.169 6.077
0.20 0.15 0.10
StDev N 1.383 100 1.855 100 1.163 100
risk attitude risk-neutral risk-averse risk-seeking
0.3
Density
0.25
Density
0.4
risk attitude risk-neutral risk-averse risk-seeking
0.30
1884
Mean 3.46 2.33 4.19
0.2
StDev N 1.579 100 1.138 100 1.535 100
0.1
0.05
Downloaded from ascelibrary.org by Texas A&M University on 10/29/16. Copyright ASCE. For personal use only; all rights reserved.
0.00
4
6
8
10
Data
12
14
0.0
0
2
4
6
8
Number of false acceptance times
(a)
(b)
Figure 6. Time (a) and Quality (b) indicators under different risk attitudes CONCLUSION In this paper, a framework was proposed to enable the investigation of construction projects as systems-of-systems. The proposed framework provides a tool for consideration of the components of construction projects at the base level and uses a multi-paradigm simulation approach for bottom-up simulation of performance. Application of the proposed framework was demonstrated using a numerical example, the results of which prove its capability in modeling the dynamic behaviors of the agents and the impact of modeling information and information processing in investigation of the performance of construction projects. The next step will be to expand the model to include more interdependent activities and processes and to use data from actual case studies to investigate the robustness of the framework. REFERENCE Bersini, H. (2012). UML for ABM. Journal of Artificial Societies and Social Simulation, 15(1), 9. Lee, S., Han, S., and Peña-Mora, F. (2007). Hybrid system dynamics and discrete event simulation for construction management. In ASCE International Workshop on Computing in Civil Engineering, Pittsburgh, PA. Mostafavi, A., Abraham, D., DeLaurentis, D., and Sinfield, J. (2011). Exploring the dimensions of system of innovation analysis: a system of systems framework. Systems Journal, IEEE, 5(2), 256-265. Mostafavi, A., Abraham, D., and DeLaurentis, D. (2013). Ex-ante policy analysis in civil infrastructure systems. Journal of Computing in Civil Engineering, 10.1061/(ASCE)CP.1943-5487.0000350.
Computing in Civil and Building Engineering (2014)