TABLE Table of log P values and predicted bioactivity ... - Scielo.br
Recommend Documents
Chl a. 0.5. 0.0035. 0.009. 0.0434. S3 Table: Summary of p- and R2 values for temperature and nutrient parameters vs. NMDS1 and NMDS 2. Significant p-values ...
Table 1S. Log P values calculated by different computer software (ChemDraw Ultra 8.0, ChemDoodle and Dragon 5.4). Compound. logP. logPc. logPv. logPb.
Table S3. St. Thomas Florida (IS) Florida (OS) Belize. St. Thomas Florida (IS) Florida ... Pairwise Permutational MANOVA Monte Carlo P-values (Bottom/White).
P-values for permutation test for homogeneity of multivariate dispersions. Differences in the compositional variance as calculated through the betadisper function ...
STANDARD NORMAL DISTRIBUTION: Table Values Represent AREA to the
LEFT of the Z score. Z .00 .01 .02 .03 .04 .05 .06 .07 .08 .09. -3.9 .00005 .00005 ...
In database terminology a (one-way) table is the data structure used to represent ... Physical Database Design for Relational Databases ...... email classification, text genre classification, topic ...... A base timeline, denoted Td, is an interval o
Formation of a stable ternary complex between Cas1-Cas2, protospacer P1 and CRISPR- containing plasmid pCOLA-Z0. Samples contained combinations of ...
Table S3: Conversion of wavelength data for predicted reflectance peaks to RGB values. ... Method 3: "Wavelength to RGB converter" online at www.uvm.edu/~kspartal/Physlets/Lecturedemo/LambdaToRGB.html (accessed 28/12/2010).
Table S3: Compositional Features of Novel Predicted Genes and Short-Length Sanger Genes Compared to All Sanger Genes. A) Comparison between Sanger ...
Frankfurt am Main. Available from: www.acdlabs.com; C: Molinspiration. Cheminformatics 2017. Available from: http://www.molinspiration.com/cgi-bin/properties; ...
Leishmanicidal fungal metabolites • Betania Barros Cota et al.
Mem Inst Oswaldo Cruz, Rio de Janeiro, Vol. 113(2): 1-1, February 2018
Fig. 1: concentration-response curves of isolated compounds (1-7) and amphotericin B on Leishmania (Viannia) braziliensis expressing firefly luciferase as a reporter gene. Compounds 1, 2, and 5 were more active, with IC50 values of 21.4, 28.3, and 24.8 µM, respectively. Compounds 4 and 7 showed IC50 values of 78.5 and 72.6 µM, respectively, and amphotericin B showed IC50 of 0.12 µM. Luciferase activity was measured by luminescence detection after 72 h treatment. IC50 values were calculated using GraphPad Prism (Version 6.0c).
Fig. 2: concentration-response curves of isolated compounds (1-7) and amphotericin B on THP-1 cells. None of these compounds were considered toxic to THP-1 cells. Amphotericin B showed IC50 of 12.0 µM in the assay on THP-1 cells. Cell viability was quantified by MTT after 72 h treatment and IC50 was calculated using GraphPad Prism (Version 6.0c).
1
Fig. 3: concentration-response curves of isolated compounds (1-7) and amphotericin B on Vero cells. None of these compounds were considered toxic to Vero cells. Amphotericin B showed IC50 of 18.2 µM in the assay on Vero cells. Cell viability was quantified by MTT and IC50 was calculated using GraphPad Prism® Version 5.01.
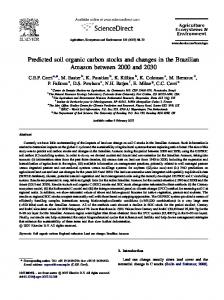
TABLE Table of log P values and predicted bioactivity scores Log P
A: Tetko et al. (2005); B: Advanced Chemistry Development Inc., 2016. (ACD/Labs) ACD/PERCEPTA Version 2015. Frankfurt am Main. Available from: www.acdlabs.com; C: Molinspiration Cheminformatics 2017. Available from: http://www.molinspiration.com/cgi-bin/properties; D: SciFinder Database. Available from: https://scifinder.cas.org; E: DrugBank Database, DrugBank Version 5.0. Available from: https://www.drugbank.ca/. Experimental property; F: drugBank Database, DrugBank Version 5.0. Available from: https://www.drugbank.ca/. Predicted property. Supplementary data