Tangible Image Query Thomas Psik, and Ina Wagner Institute of Design and Assessment of Technology Vienna University of Technology Argentinierstrasse 8/187, A-1040 Vienna {psik|iwagner}@pop.tuwien.ac.at
Kresimir Matkovic, VRVis Research Center Donau-City Strasse 1, A-1220 Vienna
[email protected] ABSTRACT
offer a solution for retrieving images from large data bases.
This paper introduces a tangible user interface for browsing and retrieving images from an image database. The basis for the query to the image database is a color layout sketch, which is used by the underlying query algorithm to find the best matches. The users are provided with colored cubes of various sizes (1.5 to 4 cm) and colors (8 base colors). The users can place and arrange the colored cubes on a small table to create a color layout sketch. Multiple users can use this interface to collaborate in an image query. To evaluate the benefits of the interface, it is compared to a traditional GUI application in which the users use a mouse to create a color layout sketch.
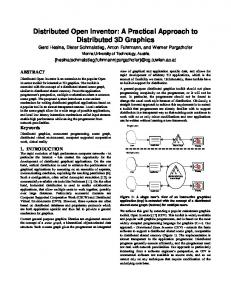
The original and still the most often used idea is query by the example method. This means that the user supplies an image, and the system tries to find similar images. The only problem is the definition of similarity in this case. As humans themselves can not always agree on what is similar and what is not (or what is more similar) the results of image retrieval is often unexpected and sometimes disappointing. Figure 1 shows an example where such a system was used to search for images similar to the bird image. If the user understands that the system tries to find images with similar color layout, and not the content (bird in this case) results are much more satisfactory. On the other hand if the user expects birds he/she might be really disappointed.
Author Keywords
Tangible user interface, image retrieval.
The next step in image retrieval was not to search only for overall similarity, but rather to find images containing a specific pattern. A company logo is a good example. Imagine a company searching for images containing their logo. The logo can be anywhere in the image, it can be taken under various lighting conditions, it can be distorted due to the perspective projection and so on. Clearly this is not a trivial task. Furthermore, if we try to find all images containing a bird, for example, the whole search becomes practically impossible.
ACM Classification Keywords
H.5.2 User Interfaces: Input devices and strategies. I.4.8 Scene Analysis: Color. INTRODUCTION
The explosion of digital technology in the last decade led to the enormous amount of digital images. Conventional ways of data retrieval become just insufficient for large amounts of visual material. Popular thumbnail view becomes useless if we have thousands or tens of thousands of images. Another approach, key wording, simple does not function with most of us. It is easy to keyword few images, but it is illusory to expect that average users will keyword their whole collections. Eakins and Graham [8] claim that some professional agencies need up to 40 minutes to keyword a single image. It is clear that common user confronted with hundreds and thousands of images cannot do such precise key wording. Content based image retrieval which has been a subject of extensive research in the last decade, tries to
There are numerous systems capable of various kinds of image queries available. Let us mention just a few best known ones. IBM’s QBIC System [13] was one of the first systems, and it can be tested online on [2] and [1]. The VIR Image engine [15] from Virage, Inc. and Photobook Project [24] developed in the MIT Media Lab are two also well known examples. The work of Jacobs at al. [19] is especially well known in the computer graphics community. All of these as well as [10,16,20,27], represent query by example approach. There are systems like Blobworld [4,7] or ICONA [6,11,12] which represent another group of systems that goes beyond simple query by example, and try to find similar shapes, textures, and other features.
1
Figure 1. Query by Example can be disappointing if the user does not understand underlying algorithm. Here the system searches for similar color-layout, and not for birds.
Some systems offer a possibility for the user to sketch the query image. The idea is that the user might remember how the image looked like (but cannot remember image’s name), so the user sketches the image, and the system finds matching images from the database. Another possible scenario of use comes from the designers’ and architects’ perspective. In the concept design phase of a project it is common practice to browse through the image collections in order to be inspired, to see some unexpected connection between images. Visual image query can be used for such a browsing. The drawback of the method described above (see Figure 1) suddenly becomes an advantage. Asking for a parrot, and getting a flower can be either: frustrating or inspiring, depending on user and context.
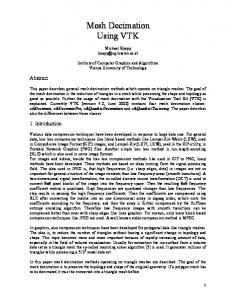
Figure 2. Rectangle distribution for first 100, 250, 500 and 1000 rectangles in the algorithm we have used.
descriptors. Various query systems differ in the art way how descriptors (sometimes called signatures) are created. In tThe Visual Image Query (the system he have used)which we used,calculates descriptors are created using quasi-randomly distributed rectangles of various sizes in the image. The rectangles partly overlap. The sizes of the rectangle are chosen according to the contrast sensitivity function of the human eye. Figure 2 illustrates rectangles’ distribution for 100, 250, 500 and 1000 rectangles. After the rectangles are placed, the average color is computed for each rectangle, and the Luv color triple for each of 1000 rectangles is stored in the signature. The signature contains only color information for each rectangle, and the system can not distinguish if, e.g. an orange spot in the middle is a flower or a fish. The only information known is that there is an orange spot in the middle. Exact shape of the spot is also not known. It is sampled using the rectangles, and can never be precisely reconstructed.
Our work is based on such a system, and we introduce a new kind of user interface for sketching the images. Instead of using a mouse to draw, users are provided with small cubes of various sizes and colors, and they try to sketch the image using the color cubes. Cubes are placed on a semitransparent glass surface. Besides the cubes, users can use any color objects. This kind of “sketching” using currently available artifacts is particularly common among designers and architects. We implemented the method, made build a prototype and tested it with users. Finally we compared the results with conventional sketching using a mouse.
The method was used since it is particular convenient for comparison of user sketches. The sketch is not precise, and actually, only the color layout matters. Actually, the more precise is the drawing is, the more unsatisfactory are the results.
UNDERLYING ALGORITHM
Our system is based on the visual image query by Matkovic et al. [23]. We’ll describe the underlying algorithm briefly. Just like the most of image query methods, the method uses descriptors to describe each image. Descriptors are created for each image in the database during the a preprocessing phase. When the user requests performs a query, a descriptor is created for query image and compared to the stored descriptors. Various query systems differ in the art
In order to make it suitable for the new interface, and in order to compare it with conventional input, we have had to change the original algorithm slightly.
2
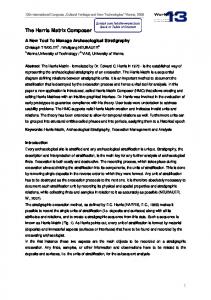
Figure 3. The user draws three separate areas, and only corresponding rectangles will be used for query. Changes in the original algorithm
The authors of the original algorithm use a reduced color space, but they still have more than 50 colors. This was too much for our approach, so we had to further reduced the color space. There are only 7 colors (red, orange, yellow, green, cyan, blue, and magenta) and black and white that we use. Furthermore, in the original algorithm either the whole image or a single area was compared. We had to change this to allow multiple areas. Only the parts of the image where the user sketches something will be used in comparison. In this way user does not need to sketch the background, but only significant places he/she remembers. Furthermore, the query starts automatically if the user does not change the sketch for a second, and results are displayed. Figure 3 illustrates an example of simple sketch and the subset of rectangles used in this case.
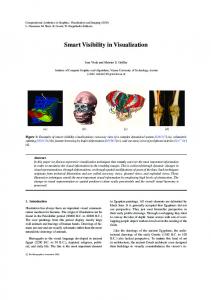
Figure 4. Students trying the new interface. NEW SKETCHING INTERFACE
The whole setup consists of a table with a semi-transparent white glass plate. There is a set of color cubes, and the users can arrange them on the table in order to make a sketch. A simple web-cam is mounted under the plate, and images are taken with the web cam and segmented in color areas. This sketch image is used as a query image. Figure 4 shows a part of the setup with the table used for sketching. It was common practice during our experiments that users “draw” together. They stood around the table, and instead of the others instructing one main user what to do (which was common with the mouse), the group could draw together. The collaborationis another important quality of the cubes interface. Furthermore, not only the cubes can be used to sketch. As soon as we placed a bowl of fruits next to the table, some users used oranges and apples as sketch tools.
Of course, the support for the new interface had to be added as well. Sketching the query image
In our tests with the original system using conventional mouse input, we found out that there are two groups of users. The first group of users, forming a majority, are the users who claim they can not draw (or paint, or sketch). It was not easy to encourage them to try the system. They were just saying “I can not draw”. Although we explained that they do not need exact reproduction, but just a red spot here, and a blue spot there... just a color layout sketch, it was still not easy to get sketches from them.
VISION BASED COLOR SKETCH
The Crayon project [9] provides a good overview of the current state of vision based interaction. In the project the researchers use a camera for hand tracking and explored the field of color calibration and machine learning. Our approach is related to their work in the respect that we also extract color information from a live video stream.
The second group of users were users who can draw. The problem with them was that they were not satisfied with the sketch, they wanted to have it perfect. It was clear to us that conventional sketching is a good solution for very limited number of users. We realized soon that we need another kind of interface. We need an interface that is very suitable for sketching, but which is not suitable for drawing. In this way, the users who can not draw will not be disappointed with their drawing results. It is impossible to draw with that interface anyhow, and for the same reason the users who can draw will not try to draw perfectly. We introduce such an interface in this paper, and this is our main contribution.
Although we had to face various problems, that are related to color vision. First test showed that for certain colors (especially cyan and gray) that were desirable, no stable calibration was possible. As web cams use compressed video information and optical sensors that are optimized to capture images of faces. This is the main use in video meetings and that is the main target. The red part of the visual spectrum is covered quite well, but blue and contrast are not of high concern.
3
Hardware Setup
To reduce the problems that come with computer vision, like changing ambient light and dynamic in-camera adaption, we created a setup, where these external interferences are reduced. The camera was mounted underneath a semi transparent surface, on which the colored cubes were placed. Also a light source was installed underneath this surface to ensure proper lighting conditions. The setup was surrounded by a non transparent casing leaving only the surface visible to the users and exposed to the ambient light in the room. With this setup we were able to achieve good results with a static calibration of the color detector. The output of the query was displayed by using a projector to create a large screen right in front of the image sketching surface.
Interface
Mouse
Tangible
indirection
+
+/-
compatibility
--
++
integration
--
+/-
Table 1. Comparison of mouse and tangible interface.
representatives for the grey spectrum and red, green, blue as the basic colors. As yellow, orange and magenta are also remembered colors we provided them too. Cyan as a mixture of green and blue seemed to us to bee also a very important color. But because of the color dynamic of web cams this particular color is hard to be extracted from a web cam image. In sake of stability of the color detector we did not provide this color. Our user tests have shown that cyan was not requested by the users when they had to sketch the images.
The steps of the color detector
First a image is grabbed from the web cam, than a color segmentation was performed and finially a color indexed image is send to the search engine.
COMPARING MOUSE AND TANGIBLE INTERFACE
The color segmentation was implemented using the HSV (hue, saturation, value) color space. For each color (white, yellow, orange, red, green, blue, magenta, black) ranges for the HSV values are specified. Using a simple filter, regions in the grabbed image that have color values within these ranges are copied to a color index image. The color index range is from 1 to 8. Zero is being used to indicate that none of the colors were detected. This indexed color image is then sent over the network to the search algorithm.
As discussed in [3] a user interface can be evaluated with the terms: degree of indirection, degree of integration, degree of compatibility. Although the original publication focuses on widgets, it can also be adopted for tangible user interfaces. The object that the interface operates on can be interpreted in two ways. On the one hand the users manipulate the color layout sketch, on the other hand they do that because they want to change the results of the color layout query.
A “change” parameter is extracted from the live stream as well, measuring how much the image has changed between two updates. A high value indicates that the users are currently changing the sketch or just moving the hands within the observed area (for example to point out certain regions and compare them with the results). During this period of vivid interaction no update is send to the search algorithm, not even the color segmentation is evaluated. Intermediate results will probably confuse the users and also distract their concentration from the task of creating or changing a sketch. When the “change” parameter drops below a certain value the color segmentation is activated. If the difference between the resulting sketch and the previous query to the search algorithm is above a certain value (indicating that the vivid change in the video stream was not just moving the hand but also moving some objects), the new sketch is send to the search algorithm. This allows us to create fast update rates, as no unnecessary video images and queries are evaluated.
The degree of indirection is a measure of the spatial and temporal offsets generated by an interface. The spatial offset is the distance between the input part of the interface and the object it operates on. The temporal offset is the time difference between the physical action on the interface and the response of the object. The temporal offset is quite the same for both interfaces, as the sketching of the color layout is with both interfaces performed in real time, without any time delay. And after a specific time without manipulation the created sketch is send by both interfaces to the search algorithm. The special offset is slightly better with the mouse interface as the drawing area and the display of the results are on the same screen and the tangible interface needs two separate areas, one to sketch the color layout and one to present the results. The degree of compatibility measures the similarity between the physical actions of the users on the interface and the response of the object. The tangible user interface provides a higher degree of compatibility as the users directly manipulate the color layout sketch with the colored cubes. The interface is a very direct approach without abstract mapping between input and effect on the query. With the mouse interface the users have to draw by selecting a color from the palette and then move the mouse to create a colored area in the sketching window.
Selection of Colors for the tangible interface
After our first tests with the color segmentation we had to realize that not all desirable colors would be sensable with the setup we have chosen [5]. In the previous implementation of the color layout search, about 50 different colors were available for the users. For the web cam and color cubes based interface we had to reduce the colors to the basic primary color set. White and black as 4
The degree of integration measures the ratio between the degrees of freedom (DOF) provided by the logical part of the instrument and the DOFs captured by the input device. The term degree of integration was introduced in integral tasks [18]. The degree of freedom can be evaluated in two dimensions: the color dimension and the layout (2D) dimension. The mouse interface provides only a 2D interface. Therfore an indirect color selection method has to be incorporated. The tangible interface in our current setup allows direct access to all three dimensions (color and 2D), but as one of our test users stated, the cubes can also be stacked to create a three dimensional structure. So the tangible interface has four dimensions that can be operated on. RESULTS
We have tested the system with several users. The users had different drawing and computer usage skills. A collection of approximately thousand images was presented to the users. They observed a slideshow, and they were asked to remember few images that had an impact on them. Afterwards they tried to draw a sketch in order to retrieve remembered images. First they made a sketch with the mouse, and then using the new color cube interface. Results and impressions of users were compared at the end. A brief summary of most interesting users follows.
Figure 5. Sketch done by a painter looking for the portrait of the sitting person
office. He does not want to give a single tool such importance, and special hardware setup. The next tester was Yvonne, she is an Artist, primarily active in Design. She is a very skilled PC user with the superb use of mouse. She was missing dark-green & grey color in the mouse interface. She was satisfied when searching for photographs, but quite unsatisfactory when she (unsuccessfully) tried to find some paintings. Yvonne finds the tangible interface more usable than the mouse input for sketching. Tangible interface reminds her of her childhood, which she pointed out as a further positive aspect of the cubes. Just as Andreas and Mira did, Yvonne wanted to have feature detection as features are more easily remembered.
Our first tester was Mira. Mira is a painter, and she is not a very skilled computer user. She found mouse interface OK, but she stated one should learn how to use it. It is interesting that she tried to draw structures all the time, rather then doing a color-layout. She tried to “redraw” the images using shapes that were present in the picture. It was not so easy for her to remember the color layout of images. The color she was missing in the interface was gray. Unfortunately she did not have time enough to play with the tangible image query, but the first impressions were positive, and she definitely thinks it is much easier to sketch color-layout and get away from structures using color cubes. Figure 5 shows Mira’s sketch of a sitting person, and result images (she was looking for the second best guess by the system). Note that Mira would have sketched the image much more precise, if she would be more experienced in mouse drawing.
Sylvia who is computer scientists specialized in AI and InfoVis tested the setup. She uses computer daily, so she had no problem with mouse interface. She was missing the brown color. She perceived the tangible interface as more “free” and “artistic” thus more convenient for dealing with images. She connects mouse to “serious” work, and she wants to be free and creative when dealing with images. The multi-user aspect of the tangible interface was disturbing for Sylvia. It was easy for other persons to alter her “sketch”, and when they actually did it, Sylvia was a little upset. She did not want other people to work on the same sketch with her.
Another user was Andreas, an Architect. He uses computer for his daily work, so he did not have any problems with mouse interface. He was the only user who was used to share the mouse with another user. So the mouse drawing was not a single-user interface for him. Same as Mira, he was concentrated on structures rather than on overall color layout. It is just the way he remembers images, he said. He was not satisfied with the results of mouse image query. The color he was missing was brown. It is interesting that he missed the color only with mouse interface, and although there are fewer colors in the tangible query, they were sufficient. Andreas finds the tangible interface better, but complains about special role such a setup would have in his
It can easily be seen from those characteristic users that the most of users tried to “draw” the picture with the mouse, and the tangible interface helped them to understand that a sketch is better for the search than a “redraw” of the image they searched. The results that were presented by the search algorithm often did not fit their expectations when drawing with mouse (and trying to draw structures). It is interesting that users sometimes could remember the shapes but not the color, but this can be subjective
5
characteristic, or it can be correlated with some professions like architects for example.
pictures are indexed (with words) and therefore we will be able to do a filtering based on these keywords. This will lead to an image query system that combines the unsharp search based on color layout, as described in this article, and the image search by keyword. In combining these two approaches we hope to encourage the users of the framework to make use of this interface even more. We want to test whether the combination of indexing by words and a color based image search will result in a better interface or not. The surprise element of results will surely decrease (in case the indexing is done properly), but also the results could fit better to the expectations of the users.
The general response was very good, and most of the users liked tangible interface better than conventional one. As we have some test users with visual arts background, we noted that they were very pleased with the surprising component of the tool. E.g., a user searched for a sun-set that was instantly within the top 15, but mixed with images of red flowers and a firework. These results were far from disappointed, and the flowers and firework images fitted well in the users expectations.
Improvements on the color layout search engine will also be investigated. As we will have access to a repository with over 10.000 images, we can than test the scalability of the algorithm and probably introduce new aspects in respect of clustering the database and improving the response to the query.
CONCLUSIONS
As many available examples prove the color layout search is an interesting approach to image query. Our work presents a new tangible user interface that allows creating color layout sketches in an easy and straight forward manner. Rather than improving the query algorithm itself, we tried to find a new interface which suits the existing algorithms better. The algorithm needs a certain level of abstraction, which is often hard to achieve using common interface. The new color cube interface makes it impossible to draw precisely, and therefore helps the users achieve needed level of abstraction.
The vision system as described in this paper was realized using a consumer web cam. If a high quality camera can be used, surely the detection of the color sketch would improve as the color dynamic will increase.
Still many of the underlying problems of the underlying methods persist. Tangible user interfaces enrich the possibility of collaboration and multi user input, with all the problems that come with it. For example there is no method of helping the users with synchronization, as all users that use the interface, actually shared this interface. They have to sort out conflicts between them without a (computational) help, for example: someone adding his ideas to the sketch without asking. Furthermore a special hardware setup is needed in addition to the existing system. The method of color layout image retrieval also has its laws. The users can not clearly identify the distinction between shape and color layout. A good example is the search for a sunset. A red shape placed in the middle of the image is a good approach, but images where the sun is not close to the center will not be found, even if it is a picture of a sunset, and images of a red flower in the center of the image will be found instead.
REFERENCES
1. Image Retrieval Service (IRS) of the EVlib http://visinfo.zib.de/IRS/ 2. The State Hermitage Museum, St. Petersburg, Russia, QBIC Color and Layout Search, http://www.hermitagemuseum.org/fcgibin/db2www/qbicSearch.mac/qbic?selLang=English 3. Beaudouin-Lafon, M., Instrumental Interaction: An Interaction Model for Designing Post-WIMP User Interfaces, CHI 2000, p. 446-453 4. Belongie, S., Carson, C., Greenspan, H. and Malik, J. “Color and texture-based image segmentation using EM and its application to content-based image retrieval.” In Proc. Int. Conf. Comp. Vis., 1998. 5. Benford, Steve et. al., Sensible, sensable and desirable: a framework for designing physical interfaces, Technical Report Equator-03-003, Equator, February 2003 http://www.equator.ac.uk/papers/Abstracts/2003benford.html
We observed that the use of a tangible user interface helps the users to create color layouts rather than shapes. More over the interface can be used in a more vivid way. It allows direct access to the sketch rather than the indirect method of using a mouse.
6. Boujemaa, N. Fauqueur, J. Ferecatu, M. Fleuret, F. Gouet, V. Saux, B. Le Sahbi, H., "IKONA: Interactive Generic and Specific Image Retrieval", International workshop on Multimedia Content-Based Indexing and Retrieval (MMCBIR'2001), Rocquencourt, France.
The color cubes interface fits very well with the underlying visual image query, and helps the users to cope with the limitations of the query algorithm. In this way the usability of the whole system is significantly enhanced.
7. Carson, C., Thomas, M., Belongie, S., Hellerstein, J.M. and Malik, J. “Blobworld: A system for region-based image indexing and retrieval.” In Proc. Int. Conf. Visual Inf. Sys., 1999.
FUTURE WORK
We want to integrate this interface into the framework, where designers are adding images to a repository. These
8. Eakins, J. P. and Graham, M. E., Content-based image retrieval, a report to the jisc technology applications 6
9. Fails, J. A. Olsen, D. R., A Design Tool for Camerabased Interaction, CHI 2003, Vol5 Issue No.1 p.449-456
18. [Jacob95] Jacob, I. & Oliver, J. (1995). Evaluation of Techniques for Specifying 3D Rotations with a 2D Input Device. Proc. HCI'95 Conference, People and Computers X, p.63-76.
10. Faloutsos, C., Barber, R., Flickner, M., Niblack, W., Petkovic, D. and Equitz, W. “Efficient and effective querying by image content.” Journal of Intelligent Information Systems, 3(3/4): 231-262, July 1994.
19. Jacobs, C.E., Finkelstein, A. and Salesin, David H., Fast Multiresolution Image Querying. Computer Graphics (Proceedings of Siggraph '95), 29(Annual Conference Series):277--286, November 1995.
11. Fauqueur, J. and Boujemaa, N. "Logical Query Composition from Local Visual Feature Thesaurus" Third International Workshop on Content-Based Multimedia Indexing (CBMI'03) September 22 - 24, 2003
20. Kelly, P. M. and Cannon, M. “Query by Image Example: the CANDID Approach.” Los Alamos National Laboratory White Paper, (1995).
programme, www.unn.ac.uk/iidr/research/cbir/report.html, 1999.
21. Klemmer, R.S., Thomsen, M., Phelps-Goodman, E., Lee, R. and Landay, J.A. Where do web sites come from? Capturing and interacting with design history. Proc. CHI 2002, CHI Letters 4(1), 1-8.
12. Fauqueur, J. and Boujemaa, N. "Region-based Retrieval: Coarse Segmentation with Fine Signature" IEEE International Conference on Image Processing (ICIP'2002), Rochester, USA, September 2002
22. Mather, B.D. Making up titles for conference papers. Ext. Abstracts CHI2000, ACM Press (2002), 1-2. 23. Matković, K. Neumann, L. Siegler, J. Kompast, M. Purgathofer, W. , Visual image Query, Smart Graphics 2002, Hawthorn, NY, USA
13. Flickner, M., et. al., Query by image and video content: the qbic system. IEEE Computer, 28(9):23--32, 1995. 14. Freeman, W., Anderson, D., Beardsley, P., et al. “Computer vision for interactive computer graphics.” IEEE Computer Graphics and Applications, Vol. 18, Num 3, pages 42-53, May-June 1998.
24. Pentland, A. Picard, R. and Sclaroff, S., Photobook: Tools for Content-Based Manipulation of Image Databases. International Journal of Computer Vision, 18(3):233--254, 1996.
15. Gupta A. The Virage Image Search Engine: an Open Framework for Image Management. In Storage and Retrieval for Image and Video Databases IV, volume 2670 of SPIE proceedings series, pages 76-87, 1996.
25. Schwartz, M., and Task Force on Bias-Free Language. Guidelines for Bias-Free Writing. Indiana University Press, Bloomington, IN, USA, 1995 26. Shneiderman, B. (1983). Direct Manipulation : a Step Beyond Programming Languages. IEEE Computer, 16(8), pp 57-69.
16. Hirata, K. and Kato, T. “Query by Visual Example— Content-Based Image Retrieval.” Advances in Database Technology EDBT ‘92, 3rd International Conference on Extending Database Technology, Vienna, Austria, A. Pirotte, C. Delobel, and G. Gottlob, eds., Lecture Notes in Computer Science, vol. 580, Springer-Verlag, Berlin, 1992, pp. 56-71.
27. Vailaya, A., Zhong, Y., and Jain, A. K. “A hierarchical system for efficient image retrieval.” In Proc. Int. Conf. on Patt. Recog. (August 1996).
17. Ishii, H., and Ullmer, B. “Tangible Bits: Towards Seamless Interfaces between People, Bits and Atoms.” Human Factors in Computing Systems (CHI ’97). (March 1997).
7