Journal of Physics: Conference Series
PAPER • OPEN ACCESS
Spatial and temporal patterns of macrozoobenthic community inhabiting sediments under tropical fish farming To cite this article: Abdullah Aufa et al 2018 J. Phys.: Conf. Ser. 1025 012041
View the article online for updates and enhancements.
This content was downloaded from IP address 66.78.60.78 on 30/05/2018 at 13:23
ISNPINSA-7 IOP Conf. Series: Journal of Physics: Conf. Series 1025 (2018) 1234567890 ‘’“” 012041
IOP Publishing doi:10.1088/1742-6596/1025/1/012041
Spatial and temporal patterns of macrozoobenthic community inhabiting sediments under tropical fish farming Abdullah Aufa1, Mochamad Hadi2 and Sapto Purnomo Putro2,3,* 1
Master Program of Biology, Department of Biology, Faculty of Science and Mathematics, Diponegoro University, Jl. Prof. Soedarto, SH, Tembalang, Semarang 50275, Indonesia; 2 Department of Biology, Faculty of Science and Mathematics, Diponegoro University Jl. Prof. Soedarto, SH, Tembalang, Semarang 50275, Indonesia 3 Center of Marine Ecology and Biomonitoring for Sustainable Aquaculture (CeMEBSA), 2nd floor, Central Laboratory for Research and Services. Diponegoro University, Jl. Prof. Soedarto, SH, Tembalang, Semarang 50275, Indonesia E-mail:
[email protected] Abstract. Macrozoobenthic animals is one of biota that may be used to assess the impact of the activities. They inhabit sediment of water ecosystem and may respond vary at different spatiotemporal scales. The purpose of this study is to study spatial and temporal patterns of macrozoobenthic community under fish farming activities at coastal area of Tembelas Island, Kepulauan Riau Province, Indonesia. The macrozoobenthic assemblages were assessedat three sampling locations, i.e. policulture [IMTA], monoculture and reference sites. Each sampling location consisted of three stations with three replicates for each station. The data obtained were analyzed using PRIMER software V.6.1.5. to compare number of taxa (S), ShanonWiener diversity index (H’), and Pielou’s evenness index (e) and K-dominance cumulative curves between sites and times. The results showed that diversity index at fish farming locations (IMTA and monoculture) exhibited lower than those at reference site, between 1.58 – 2.19 and between 1.99-2.84, respectively. However, diversity at all locations were considered moderate diverse ecosystem. Meanwhile, Pielou’s evenness indexbetween locations and sampling time showed no majordifference, ranging between 0.96-0.98. Based on K-dominance curves, P3T2 station curve was positioned on the top among other curves, implying certain taxa has dominated the assemblages, i.e. Nassarius sp. (Gastropod). Keywords: aquaculture, macrozoobenthic community, organic enrichment, diversity index, and evenness index
1. Introduction Over the last ten years, fish farming in Indonesia has developed from monoculture to polyculture system [1]. Both activities may produce organic waste in the form of organic nitrogen, phosphor and ammonia that may spread from tens to hundreds of meters from fish farming area, resulting disturbance and contamination in the aquaculture environment and surrounding areas [2]. The impact of fish farming can be reduced through modification of farming practice to growing up more than one species in the same areas (integrated aquaculture). In line with the time, Integreted Multi Trophic Aquaculture (IMTA) has been introduced to produce several farmed biotas at the same Content from this work may be used under the terms of the Creative Commons Attribution 3.0 licence. Any further distribution of this work must maintain attribution to the author(s) and the title of the work, journal citation and DOI. Published under licence by IOP Publishing Ltd 1
ISNPINSA-7 IOP Conf. Series: Journal of Physics: Conf. Series 1025 (2018) 1234567890 ‘’“” 012041
IOP Publishing doi:10.1088/1742-6596/1025/1/012041
time at the same areas [3], thus reduce the environmental impact [4]. The concept of IMTA is the practice of aquaculture which involves a mutualistic relationship between farmed organisms from low trophic level, i.e. suspension feeder organisms to a higher trophic level organism i.e. carnivore fish [5,6]. Polyculture and multitropic aquaculture systems have been shown to create an ecosystem within a balanced area [7] so that IMTA applications contribute to the sustainability of aquaculture [6]. Studies on IMTA-based seaweed cultivation have been conducted. However, generally the study was conducted at subtropical areas [3]. The results of the Troell [8] study in Metri Bay, Chilli showed that Gracilaria sp. cultivated at a distance of 10 m from floating net cages of salmon had a 40% increase in biomass. According to Troell et al [22] seaweed, has a key role as a biofilter and an economically valuable biomass producer, where fish farming wastes released as unfed pellet and fish feces and urine can be a source of nutrients that are very useful for seaweed growth. Macrozoobenthic community inhabiting sediment under water ecosystem is generally very sensitive to changes in the aquatic environment, both spatial and temporal. Therefore, their distribution pattern, diversity and dominant are often used as biological indicators because of their way of life, body size, and different tolerance ranges among species within aquatic environments. The use of indicator organisms to assess water quality is very useful for routine biomonitoring and the status of water ecosystem. Thus, the taxa of indicators can be use as a complementarypart or strengthen the assessment of water quality based on physical and chemical parameters [9]. Consequently, further research is urgently needed to determine the quality of aquaculture fisheries using macrozoobenthic community. 2. Research Methods The sampling sites was located at Tembelas Island, Kepulauan Riau, Indonesia. Three sampling locations were assessed with three stations and three replicates for each location, i.e. floating net cage of monoculture, floating net cage of IMTA, and reference area. The base sediments taken from three locations using Eckman Grab then the sample was introduced into a plastic bottle containing 4% of formalin solution. Samples of animal macrozoobenthic were treated by rinsing, sorting and preservation in 70% of ethanol solution. Macrozoobenthic identification is performed using identification books [23] after that calculation of the amount of types, tabulation and calculation was conducted. The diversity of the macrozoobenthic assemblages was analysed using). Shanon-Wiener index (H’), Evenness (e) index was used to express similarity [24] and K-Dominance Curve using PRIMER software V.6.1.5. k-Dominance curves belong to this class of techniques, and have been quite widely used in the context of environmental assessment [25]. The formula of Shanon-Wiener index (H’) is as follows: s
H '
p log p 2
….........................................................................................……(1) Specification: S = number of species Pi = proportion of the total sample of i-th species = ni / N ni = number of individuals of i-th species N = total number of individuals of all species H' value normally will not be more than 5 (five). In general, the greater number of species in the community, then the value of the index H' will be higher as well. Meanwhile, Evenness (e) index is calculated as follows: i 1
e
i
i
H' ln S ……...................................................................................................…(2)
Specification: H’ = index of species diversity (species) Shanon- Wiener Ln = exponential logarithm S = number of species (types).
2
ISNPINSA-7 IOP Conf. Series: Journal of Physics: Conf. Series 1025 (2018) 1234567890 ‘’“” 012041
IOP Publishing doi:10.1088/1742-6596/1025/1/012041
The higher the value of e, the higher similarity degree between several types of communities compared will be. 3. Results and Discussion 3.1. physical-chemical factors at tembelas island Table 1. Result of measurement of water quality parameters.
Poluculture I Polyculture II Monoculture I Monoculture II Reference I Reference II
DO (mg/l) 4.30 7.41 4.61 6.33 4.50 6.13
Salinity (ppt) 30.00 31.00 31.00 30.67 30.67 32.67
pH 8.50 7.67 7.63 7.73 8.30 7.60
temperature (oC) 30.57 30.47 29.90 31.23 30.13 31.60
turbidity 27.67 25.00 56.00 59.33 26.00 45.00
%C
%N
4.09 15.24 2.88 12.08 3.87 9.78
0.5 1.13 0.41 1.13 0.37 1.16
Smooth sand 0.3 10.58 0.6 8.6 0.5 10.2
Silt 97.7 86.42 92.4 90.4 0.5 87.8
Clay 2 3 7 1 7 2
The water quality in the coastal island ofTembelas Riau Islands Province in the three research sites (polyculture, monoculture, reference), among others obtained DO (4,30-7,41) (table 1). The oxygen level (DO) indicates that the waters in the first and second sampling are still quite good. The optimum oxygen content (DO) for benthic animals is> 4.0 mg / l [14]. Decreasing dissolved oxygen can cause serious problems for macrozoobenthos animal life, the reduction of oxygen in waters is usually associated with high organic material entering the water [15]. The salinity range in each of the research areas for the first and second samples had a fairly high salinity level of 30.00-32.67 but was still tolerable by benthos animals. The ideal salinity for macrobenthos biota growth is 26 ‰ - 37 ‰ [19]. pH on the coast ofTembelas island in the three research sites is still normal between 7.60 to 8.50 and allows for benthos animals to live. According Efendi[16], the pH range that can still be tolerated benthos animals is 6.5-8.5. Temperatures obtained at the study sites in both the first and second samples were 29.90-31.60 0C. the temperature value at the study site is good for macrobenthos life and is in the normal range, this is in accordance with the Odum[11] statement that is the ideal temperature for growth and reproduction of gastropod is generally 25-320C. Based on the decree of ministry for environment year 2004, the standard of turbidity for marine biota is less than 5 NTU. The lowest turbidity or turbidity values are in the location of Monoculture either at the time of the first sampling or the second sampling. High turbidity levels will disrupt the penetration of light into the water, consequently can interfere with the process of photosynthesis and affect the decrease in dissolved oxygen content, thus decreasing the productivity of the water [17]. The nitrogen content in the first sampling averaged 0.37-0.5, while the second sampling averaged 1.13-1.16. The first and second sampling has a long time lag so that organic matter may accumulate in the area. According to Effendi [16], the source of organic nitrogen in the waters comes from the decay of living things that have died while the anthropogenic source is derived from fishery activities. Be aware of sediment data obtained in polyculture cultivation area, monoculture and reference area, third location there are three substrate granular composition ie smooth sand, silt and clay. The three research sites are dominated by silt / mud. The highest value of silt was found at the polyculture site on the first sample of 97.7%. However, silt peresntasi value at all three locations do not have differences too high. The highest smooth sand value was found at the polyculture site on the second sampling 10.58%. The highest clay value was found at the monoculture site on the first sample and the reference area on the first sample. This is due to the sedimentation process or the substrate influenced by the velocity of the current in the area [18]. 3.2. Macrozoobenthic abundance based on locations Based on the identification results both in the first and second sampling on the floating net cage area of IMTA system, the floating net of the monoculture system and the reference area is Gastropoda class
3
ISNPINSA-7 IOP Conf. Series: Journal of Physics: Conf. Series 1025 (2018) 1234567890 ‘’“” 012041
IOP Publishing doi:10.1088/1742-6596/1025/1/012041
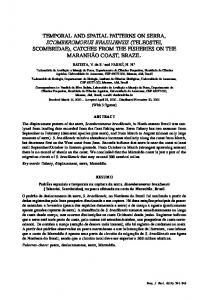
there are 48 species from 27 families. Bivalvia class there are 18 species from 10 families. Class Polychaeta there are 13 species from 6 families. Crustacean class there are 4 species from 3 families and Ophiuridae class there is 1 species from 1 family (Figure 1). From the results of identification, is a family of gastropods and bivalves class with a fairly high distribution found in all three locations.This is because Gastropods can live and thrive on a wide variety of sedimentary structures and can adapt to waters dominated by mud and sand substrate types. 11%
4% 4% Gastropoda Bivalvia Polychaeta Crustacea
50% 22% 17%
25% 17%
(a)
7% 3%
Gastropoda Bivalvia Polychaeta Crustacea Ophiuridae
50%
26% 64%
Gastropoda Bivalvia Polychaeta Crustacea
(c)
(b)
Figure 1. Proportion of macrozoobenthic abundance (a) on floating net cage of monoculture (b) on floating net cage of IMTA (c) on reference area 3.3. Diversity index The value of the Shanon-Wiener (H ') diversity index taken from Wilhm and Dorris[10] is the value of diversity considered low if H'