alojado en sus casas mientras buscaba la mía. Sam gracias por ...... Gràcies al canvi climàtic (o malauradament per culpa d'ell, segons es vegi) la fenologia ...
Departament de Biologia Animal Facultat de Biologia Universitat de Barcelona
Departamento de Ecología Evolutiva Museo Nacional de Ciencias Naturales Consejo Superior de Investigaciones Científicas
Spatial and temporal migratory patterns of trans-Saharan birds in the Iberian Peninsula Memòria presentada per Oscar Gordo Villoslada per optar al títol de Doctor Programa de doctorat: Zoologia Bienni 2002-2004
El doctorand
Oscar Gordo Villoslada Vist i plau dels Directors
Dr. Xavier Ferrer Parareda
Dr. Juan José Sanz Cid
Barcelona, Juliol 2006
Dr. Lluís Brotons i Alabau
A Sergio, simply the best
AGRADECIMIENTOS Debo dar algo más que las gracias a los cientos de observadores voluntarios que han formado y forman parte de la red fenológica del Instituto Nacional de Meteorología. Esos cientos de personas han ido anotando sin mayor pretensión que la del curioso observador año tras año, estación tras estación, todos aquellos cambios fenológicos que acontecían en sus pueblos y ciudades, a los que todos estamos tan acostumbrados, pero a los que tan poca atención prestamos. Sin su paciente y anónima labor esta tesis no hubiese sido posible. Muchos han sido los integrantes de este programa, cuya labor ha sido insuficientemente reconocida e incluso incomprendida (pensemos en la conciencia sobre el medio ambiente existente hasta no hace demasiados años). Esta tesis, así como otros trabajos de estos últimos cuatro años, son un tributo a la labor de todas y cada de estas personas. Desde los que solamente ha aportado un dato hasta aquéllos que se han dedicado durante décadas a registrar afanosamente tantos eventos. Entre estos últimos debo mencionar a Pere Comas i Durán (Cardedeu, Barcelona), que ya no podrá ver que su incansable y meticulosa labor entre 1952 y 2004 además de usarse en varios estudios, sirvió para que un chaval de su pueblo acabase metido en esto de la investigación. Quiero mencionar también a Juan Mosquera Candal (Sta. Cruz de Montaos, A Coruña), que con más de 90 años sigue tan entusiasmado por la naturaleza como cuando empezó allá por el año 1948, todo un pionero de la red que aún continúa. Se lamentaba en una carta de sólo poderme enviar los datos de los últimos 15 años, puesto que el resto los prestó pero jamás se los devolvieron. Estos son tan sólo dos ejemplos que demuestran que detrás de las bases de datos, la estadística y las publicaciones existen además historias. Desgraciadamente la red fenológica está desapareciendo porque no se incorporan nuevos observadores. Precisamente ahora, en que la valía incalculable de programas a largo plazo está más que demostrada, están a punto de perderse tantos años de continuidad. Quiero agradecer asimismo la colaboración prestada durante mi búsqueda de datos fenológicos por numerosos ayuntamientos (Barrado, Betanzos, Cabeza la Vaca, Cabrianes, Castellví de la Marca, Gualba, Ledesma, Ordes, Pizarra, Sant Celoni, Tarifa, Torà y Tortosa) y personas (R. Barred, M. Bueno, J. de la Fuente, F. García, R. Ibáñez, J. Junyent, M. Miralles, J. Molet, J. Salichs, G. Solé y A. Zaldierna), pese a lo infructuoso de casi todos los casos. Agradezco también al Instituto Nacional de Meteorología, con especial mención al Servicio de Aplicaciones Meteorológicas, por haber puesto a mi plena disposición sin coste económico alguno todos los datos de fenología y meteorología requeridos gracias a los diferentes convenios firmados entre esta institución y el CSIC y la UB. Otros tres culpables de que me encuentre escribiendo estas líneas han sido mis directores de tesis. Con Xavier empecé a dar mis primeros pasos en el mundillo de la investigación allá por agosto del 2001, cuando todavía ni me había licenciado. Finalmente me dio la oportunidad de solicitar una beca predoctoral del programa FPU (ref. AP2002-1439), sin el soporte económico de la cual hubiesen sido impensables estos últimos cuatro años dedicados plenamente a esta tesis. Del mismo modo le agradezco a Lluís el haberse embarcado sin ni siquiera conocerme en aquel proyecto inicial, que desde entonces ha cambiado un poquito. Gracias por tus consejos que tanto me han ayudado siempre y que tanto valoro y por saberte siempre dispuesto pese a las distancias. Juanjo, yo tampoco imaginaba aquel ya lejano 8 de septiembre de 2003 en que nos conocimos de casualidad que la cosa acabaría en “matrimonio” y con “hijos”. Gracias por haberme dado la oportunidad de trabajar contigo y de permanecer en el Museo durante los últimos dos años. También gracias a él pude acceder a fuentes de datos que sin duda han ayudado al desarrollo de esta tesis. Gracias en especial tengo que dar a Jorge M. Lobo. Su ayuda ha sido decisiva en los análisis de los patrones espaciales al introducirme en el mundo del GIS. Y como
no, gracias por estar siempre disponible para resolver mis dudas, las científicas y las que no, con tan buen sentido del humor. También debo dar gracias a Luis M. Carrascal, ya no sólo por presentarme a Juanjo, sino por estar siempre dispuesto a resolver cualquier duda, por haberme hecho aprender algo de estadística (cosa especialmente meritoria en mi caso) y por alguna que otra discusión a esas horas en que ya no queda nadie por el Museo. Debo dar las gracias también a Pilar López por haberme hecho un hueco en su cuarto, primero, y a Juanto Fargallo por cederme su sitio en la once-once, después, durante los primeros meses en que estuve en el Museo; que para los que hemos estado allí sabemos lo que un vale sitio. A los que por mucho que pueda escribir aquí nunca seré capaz de expresar suficientemente mi gratitud es a mis compañeros y compañeras del Museo. Gracias por haberme hecho sentir como en casa desde el primer día que llegué. Judith, yo sí que no sé por donde empezar. Darte las gracias para mi no es suficiente. De todos modos, gracias por tu amistad, gracias por tu confianza, gracias por tu apoyo, gracias por tu comprensión, gracias por tus ánimos y gracias por tu energía inagotable durante todos los días de estos últimos dos años, porque para eso hay que ser verdaderamente paciente. Elisa, gracias por tu perenne estado de buen humor y por esas lecciones de cultura musical a bordo de tu coche. Josué, gracias por ser tan segoviano, por compartir la pasión por la ciencia y por tener ciertas manías en común. Ismael, gracias también por compartir pasiones y fobias, pero sobretodo gracias por ser el único pajarero en compartir la afición de forma tan enfermiza como yo, aunque todavía tengamos pendiente el falaropo picogrueso. Luisa, gracias por haberte pasado a los pájaros (el grupo necesitaba un toque femenino), seguro que se te darán bien. Gustavo, gracias por haberme hecho creer que en la 218 estaba criando un cascanueces. Leticia, gracias por ser la única en compartir ciertos puntos de vista sobre la vida en general. Gema, gracias por ser el alma de la fiesta, y Isabel gracias por tu “mudansa”. Pablo, gracias por tantas y tan seguro que fructíferas discusiones sobre las cigüeñas de nuestros amores. Y como no, gracias a Aurelio, Raquel, Mari José, César Luis, Pedro, Juan (los dos), Ana, Natalia, Cris, Lucía, Elena, Noemí, Tere, Marianne, Mon, los Ventogrillos, y a quien me deje, por ser todos tan majetes! Debo acordarme también de la gente del “depar”, sobretodo del grupo de ictiología de Adolfo de Sostoa, gracias al cual pude gozar de recursos que las penurias en las que empecé me impedían. El mayor responsable de que esté escribiendo estas líneas fue Sergio. Haber empezado juntos este viaje, amigo, es algo que nunca olvidaré y que, desgraciadamente, ya nunca te podré agradecer. Te echo mucho de menos loco. Es lo suyo, que te dé las gracias Nuno, por ser tan currante y haberme prestado tu reciente experiencia en mi recta final de preparación de la tesis. Miquel me ayudó con la informatización de los datos en los inicios por lo que le estoy muy agradecido, aunque más gracias te doy por todas esas boletadas compartidas, las habidas y por haber. Gracias también a Eva, Clara y Fredi por compartir tantas horas de despacho. También agradezco a Domingo Rodríguez el estar siempre dispuesto a resolver cualquier duda, y a Santi Mañosa por haber soportado pacientemente todas mis dudas burocráticas. También le doy las gracias a él y a Jacint Nadal por haberme ofrecido su apoyo, cuando pedí becas. Gracias por estar siempre ahí a todos los amigos con los que compartí durante cinco años algo más que la carrera. Néstor y Jordi me han ayudado con algún que otro tedioso papeleo. Con Toni he compartido algunas dudas informáticas, entre otras tantas. Jesús, gracias por responder siempre a tantos y tantos mails y por compartir nuestra peculiar visión del mundo. Sam y Nuria, como yo, tampoco imaginaban que les acompañaría en su aventura tricantina. A Nuria y Urtzi les doy gracias por haberme alojado en sus casas mientras buscaba la mía. Sam gracias por haberme aguantado estos años, por esas discusiones científicas al filo de la media noche y porque finalmente el caos no ha vencido al orden. Y ahora que cito Tres Cantos, es obligado
que me acuerde de Sergio Tostón, que a su modo también es un gran ornitólogo, aunque ni él mismo lo sepa. Tengo que darles las gracias a mis padres por haberme hecho de mecenas durante mis años de estudiante pese a que no se creyesen demasiado eso de que mirando pajaritos pudiese convertirme en un hombre de provecho. Y gracias también a mi hermana, por haberme ayudado con el inglés en más de una ocasión, por hacerme algún que otro papeleo y por haber impreso la primera copia de esta tesis. También quiero darle las gracias a Javi Quesada, a quien conocí justo cuando empezaba a dar mis primeros pasos en el mundillo de la ornitología en el verano de 2001. Por haberme ayudado más de lo que cree con sus consejos, por haberme permitido acompañarle en sus tareas de campo (¡contigo anillé mi primer pájaro!) y por tantas y tan largas discusiones sobre ciencia en general y biología en particular. No debo olvidarme de darle las gracias a Xavi Saloni amigo desde hace ya tantos años y que de tantas crisis informáticas me ha salvado. Debo darle gracias a SEO/Birdlife, en especial a Blas Molina, por haberme cedido los datos del último censo nacional de cigüeña blanca que usé en el capítulo 3, así como a la Oficina de Anillamiento, por los datos sobre recuperaciones. J. Peñuelas revisó una primera versión del capítulo 5, aportando valiosos comentarios y sugerencias, y V. Kosarev me indicó donde encontrar los datos climáticos que buscaba. También doy gracias a todos aquellos autores que han tenido la deferencia de enviarme sus publicaciones, con especial mención a T.H. Sparks y Y. Yom-Tov por su interés en mi labor. Acabo estos agradecimientos acordándome también de los referees, aunque en esta ocasión para bien, porque gracias a los comentarios de algunos de ellos he aprendido mucho a la par que me han ayudado a mejorar los trabajos.
TABLE OF CONTENTS
GENERAL SYNTHESIS Introduction
2
Objectives
23
Results and discussion
26
Conclusions
35
Resum
37
References
58
CHAPTER 1: Environmental and geographical constraints on common swift and barn swallow migratory patterns throughout the Iberian Peninsula
69
CHAPTER 2: Geographic variation in onset of singing among populations of two migratory birds
99
CHAPTER 3: Spatial patterns of white stork migratory phenology in the Iberian Peninsula
127
CHAPTER 4: Climate change and bird phenology: a long-term study in the Iberian Peninsula
161
CHAPTER 5: Do changes in climate patterns in wintering areas affect the timing of the spring arrival of trans-Saharan migrant birds?
187
CHAPTER 6: Species-specific effects of ecological conditions and climate in wintering and pass areas on spring arrivals of some trans-Saharan birds
207
General Synthesis
2
General Synthesis
INTRODUCTION Bird migration: Being in the right place at the right time Every year millions of migrant birds move between two different areas, often thousands of kilometres apart. Migration can entail several weeks or even months of travelling, which may include crossing ecological barriers such as mountains, deserts and seas. In the case of the trans-Saharan bird migration system, there are around 185 species involved (Moreau, 1972), which breed in the Palaearctic and leave that region to overwinter in Africa, south of the Sahara Desert (Moreau, 1952). These characteristics make migration one of the most fascinating natural phenomena and it is not surprising that it has been a subject of interest for the human observer since ancient times. Migratory birds, like many other animal taxa, have developed this mobility strategy in response to the periodically and predictably fluctuating conditions of environments that they inhabit. Most of the environments of our planet are subjected to the seasonality resulting from the Earth’s rotation around its axis, which changes the relative position of the sun. This change in the solar energy received during the annual cycle is the ultimate cause for the seasonal variations in climate and vegetation. Migratory birds move between two regions to take advantage of the optimum environmental conditions occurring at each location at different times of the year (Alerstam et al., 2003). In the case of trans-Saharan species, abundant food resources are utilized during the spring in the European breeding grounds and harsh winter conditions are avoided by moving to the Afrotropics (Coppack & Both, 2002). In this way, these species live under better environmental conditions than if they spent the entire year in the breeding or wintering grounds. Consequently, populations of these species can be larger as a result of the exploitation of abundant resources at certain times of the year that could otherwise not be exploited by resident species (Morel, 1973; Salewski & Jones, 2006). Bird migration is based on three principles: •
Physiological adaptations to cope with challenges encoutered during the migratory period (e.g. long flights without refuelling).
Introduction
•
3
Navigation mechanisms to ensure correct routes between origin and destination sites.
•
Endogenous rhythms to ensure that the beginning and end of each life-history stage occur at predictable times.
Endogenous rhythms or internal clocks are the response of many organisms (not only migratory birds) to environmental fluctuations. In the case of birds, many features of migration, as well as many other basic features of their annual cycle, are endogenously preprogrammed and have a strong genetic basis (Berthold, 1996). The normal season progression of migratory disposition, moult or reproductive propensity persists even in a constant experimental environment for many bird species (Gwinner & Helm, 2003). In spite of this internal rhythmicity, there must be environmental cues that synchronize their onsets with the natural progression of seasons. Among these potential cues, the most reliable natural calendar is the photoperiod. In fact, photoperiod acts as the most important synchronizer of circannual rhythms and accelerates or inhibits individual migration processes (Gwinner 1996; Berthold, 1996). The life cycle of a migratory bird alternates for several stages during its annual cycle (Fig. A). This succession alternates vital functions in the optimum way to ensure survival and to maximize fitness of individuals. Therefore, breeding, moulting and migration are placed at that time of the year which guarantees the best adjustment between individual requirements and environmental offer. Individual success is thus based on the adequate beginning and end of each stage, i.e. on the adequate phenology. If one phase is delayed, this implies that the subsequent phase must also be delayed (e.g. Ellegren, 1990). Alternatively, both phases can overlap, which may impose trade-offs on resource allocation (e.g. Pérez-Tris et al., 2001; Morales et al., 2006). When synchronization between life cycle events and required environmental conditions disappears, then we should expect serious negative consequences for individuals (e.g. Kolunen & Peiponen, 1990). Therefore, an adequate phenology is the cornerstone for the correct functioning of life cycles. Phenology can be applied to the timing of any aspect of the life cycle of an
4
General Synthesis
Figure A Life cycle of a migratory bird. Several stages follow one another in the best way to ensure survival of maximize fitness of individuals according to fluctuating environmental conditions. (Adapted from Coppack & Both, 2002).
organism: its migration, its reproduction, as well as its moulting. Any periodical phenomena can be monitored and consequently its temporal variability studied. A bit of history on phenology Phenology (greek: phaenisthai - to appear; logos -science) is the study of the timing of recurring natural events in relation to climate (Schnelle, 1955). It involves recording the dates of events such as the flowering, leafing and fruiting of plants, the appearance of insects, or the arrival, departure and nesting of birds. The annual recurrence of these biological events has traditionally been of great concern for people, because it defines the timing of seasons rather than calendar date. The study of the timing of the naturally recurring events has a long history. The oldest known phenological record is from Japan. The blossoming date of cherry Prunus suberitella has been observed and noted between the years 814 and 1864. Similarly, blossom dates since 16th century from China have survived until today (Hameed & Gong, 1994). In Europe, phenology has a history going back to the early 1700s and is probably the longest written biological data in existence. The oldest surviving European records are those of Robert Marsham from Norfolk, UK, in 1736 (Margary, 1926; Sparks & Carey,
Introduction
5
1995). Phenological observations were collected by the Marsham family generation after generation over nearly two centuries generating an extraordinarily long record. The first described methodology for phenological observations was published as early as the mid-1700s by Carl von Linné (Lehikoinen et al., 2004). A few years later, the first phenological network with a systematic scheme was established in Sweden. As of the mid-1800s, phenology had become universally popular and most European countries had begun monitoring schemes, usually with an emphasis on plant phenology and often coordinated by meteorological services. Given an economy almost totally reliant on agriculture at that time, this emphasis on plant phenology is not surprising. The earliest phenologists from the 18th and 19th centuries following the tradition of Linné were interested in characterizing natural or rather climatic regions by defining phenological differences between landscape units and recording them in phenological plant calendars (Schaber, 2002). However, a clear applied interest could be in the basis of the regional or national phenological networks. A better understanding of seasons could help to improve agricultural practices by means of the best selection of crop varieties cultivated in each region, frost warnings, forecasting of phenophases to better organize field work, timing of biocide application or creation of phenological maps (Defila & Clot, 2001). The impact of weather on agriculture is obvious and plant phenology is subject to this impact as well. Phenology is a discipline traditionally shared by biology and climatology. As a good indicator of the seasons’ course, it was included as another parameter by meteorological services in their monitoring schemes. This fact means that phenological records enjoy a geographical and temporal amplitude unattainable for any other biological parameter. This is made possible by the fact that phenological networks do not rely on scientific specialists. The succession of the seasons is perceptible to anyone, and thus anyone can make a record of these common and well-known natural events. Unfortunately, in spite of the huge numbers of records stored to date by these phenological networks, there are few studies that have comprehensively analyzed them (e.g. Huin & Sparks, 1998; Menzel et al., 2001; Ahas et al., 2002; Schaber, 2002).
6
General Synthesis
The unavailability of powerful tools for data management (e.g. computers) until recent decades has been a handicap for this purpose during the majority of phenological history. Present climate change and the role of phenology Phenology has been traditionally considered a pastime of natural historians, farmers, clerics and other amateur people rather than a science. Fortunately (or unfortunately), phenology has now discarded this image due to recent climate change. During recent decades, scientists have shown a renewed interest in this ancient discipline as the value of phenological data in climate change research has been recognized (Cannell et al., 1999; Menzel, 2002; Donnelly et al., 2004; EEA, 2004). The ability of organisms’ phenology to detect climatic change is in fact predicted, since life cycles must be perfectly synchronized with seasonal succession which is governed by climate. Therefore, it is expected that organisms’ phenology will change in concordance with climatic changes in order to be optimally adjusted to new environmental conditions. The Earth’s climate has continuously changed promoting responses by organisms, which must adapt or perish. If this is the case, why is present climate change a cause for concern? Current and projected climate change has three main features that distinguish it from past climatic change: •
Anthropogenic origin. The increase of greenhouse gases due to human activities is widely accepted as the primary cause of the increase in temperatures.
•
Global conditions markedly warmer. Over the past century, mean world temperature increased by about 0.6 ºC and is predicted to increase further by between 1.4 and 5.8 ºC by the end of the present century (McCarthy et al., 2001).
•
Extremely rapid increase of temperatures with changes of large magnitude. The present rate of increase in temperatures is much faster (10 times) than any other recorded in the recent geological past
Introduction
7
and the magnitude is comparable to the transition between glacial and interglacial periods. A growing number of studies (Walther et al., 2005) have shown evidences of climate change effects on a wide range of biological mechanisms in a wide variety of species over a vast range of environments, both terrestrial and aquatic (Harrington et al., 1999; Sparks & Crick, 1999; McCarty, 2001; Peñuelas & Filella, 2001; Sparks & Menzel, 2002; Sparks & Smithers, 2002; Walther et al., 2002; Parmesan & Yohe, 2003; Root et al., 2003; Root et al., 2005). Among these biological effects are biodiversity loss (e.g. Pounds et al., 2006), poleward range expansion (e.g. Parmesan et al., 1999), changes in altitude (e.g. Klanderud & Birks, 2003), contractions of range distribution (e.g. Wilson
et
al.,
2005),
morphological
changes
(e.g.
Yom-Tov,
2001),
advancement of reproduction time (e.g. Crick et al., 1997), changes in reproductive success (e.g. Moss et al., 2001), changes in population dynamics (e.g. Sæther et al., 2000), changes in sexual characters (e.g. Møller & Szép, 2005), acceleration of development (e.g. Roy & Sparks, 2000), alteration of migratory timing (e.g. Sparks, 1999), mismatching between trophic levels (e.g. Stenseth & Mysterud, 2002) and alteration of interspecific relationships (e.g., Stireman et al., 2005). Therefore, impacts of climate change on organisms are various and widely demonstrated. This wide-ranging impact should be expected as climate is probably the most important environmental factor affecting ecosystems and life cycle functioning. Hence, it can be predicted that the amount of biological evidence demonstrating the effects of climate change will continue to grow as more studies are carried out and as climate continues to change. Among these many biological aspects affected by climate change, phenology arises as the first to offer clear evidence of changes which are frequently measured and reported. Some of the reasons that make phenology an important bioindicator of climate change are: •
Phenological events are very sensitive to climate. The beginning and ending of life cycle stages of organisms must be perfectly synchronized with climatic seasonality.
8
General Synthesis
•
Phenological events are cheap (rely on geographically widespread networks of voluntary observers) and easy (low-tech approach using simple observation) to record. Huge amounts of reliable data can be potentially produced at low cost and methodology is easy to standardize and apply via observational networks.
•
Phenological events have been recorded for many decades and even centuries. We have data prior to the recent climate change that can be used as a reference for original conditions.
•
Phenological events offer evidence of organisms’ responses to climatic changes. Furthermore, they are excellent vehicles through which a changing climate can be clearly demonstrated to the general public given that phenology is a very simple concept to understand.
Birds are probably the animal taxon with the most studies reporting evidence of climate change effects. This is due to the long tradition of ornithology that has favoured well-established monitoring programmes in recent decades (e.g. Zalakevicius et al., 2006) during which time the highest levels of warming were detected, or even over the last century (e.g. Butler, 2003; Lehikoinen et al., 2004). The effects of climate change on birds have been reported in a wide range of biological aspects such as geographical distribution, population numbers, morphological characters, sexual selection, reproductive phenology, reproductive success and migratory phenology (see Crick, 2004). Migratory phenology has received special attention due to the popularity of this phenomenon both among ornithologists and naturalists. The arrival and departure dates of birds are a classic indicator of seasonal change due to the conspicuousness of birds and the ease with which the first and last sightings of individuals of a certain species each season can be recorded. Long-term monitoring programmes recording data on bird migratory phenology can have different origins: •
Individual initiative (e.g., Margary, 1926; Lehikoinen et al., 2004; Gordo & Sanz, 2005).
Introduction
•
9
Phenological networks managed by meteorological services (e.g. Huin & Sparks, 1998; Sparks & Braslavská, 2001; Gordo & Sanz, 2006).
•
Events traditionally recorded by ornithologists in bird observatories (e.g. Mason 1995; Loxton et al., 1998; Loxton & Sparks, 1999).
•
Complex monitoring programmes of bird migration in certain localities usually linked to ringing activities (e.g. Sokolov et al., 1998; Hüppop & Hüppop, 2003; Sparks et al., 2005).
Most of the studies resulting from these long-term monitoring programmes have reported earlier dates for spring arrivals of migrants during recent decades. Many examples can be found in literature for central and northern European countries, as well as for North America (see Table A). These advancements in bird migratory phenology have been attributed to climate change and especially to global warming. The increase in temperatures has advanced spring in European and North American breeding grounds (e.g. Schwartz et al., 2006) and this could enhance migration through these areas due to increased food availability and improved weather conditions for travel (Ahola et al., 2004; Both et al., 2005; Hüppop & Winkel, 2006; but see Jonzén et al., 2006). Due to the benefits of an early arrival for individuals (e.g. occupancy of best territories, increased chances to obtain a mate, or higher survival of fledglings), populations are advancing their return dates to breeding areas to best adapt and profit from the new climatic situation. However, the absence of change, or even delay, in the arrival dates recorded in some cases could be an indicator of the existence of opposite environmental pressures within the life cycle of a migratory bird (e.g. Inouye et al., 2000; Gordo et al., 2005) and/or certain inflexibility of endogenous rhythms that control life cycle events (e.g. Both & Visser, 2001). There are fewer studies that have analyzed autumn migration, (Sokolov et al., 1999a; Bairlein & Winkel, 2001; Sparks & Braslavská, 2001; Sparks &
10
General Synthesis
Country
Studies
Island
Boyd, 2003
Norway
Barrett, 2002; Forchhammer et al., 2002; Jonzén et al., 2006
Sweden
Stervander et al., 2005; Jonzén et al., 2006
Finland
Ahola et al., 2003; Lehikoinen et al., 2004; Vähätalo et al., 2004; Sparks et al., 2005; Jonzén et al., 2006
Estonia
Ahas et al., 1999
Lithuania
Zalakevicius, 2001; Zalakevicius et al., 2006
Russia
Sokolov et al., 1998; Sokolov et al., 1999a; Sokolov et al., 1999b; Sokolov, 2000; Sokolov, 2001; Sokolov & Kosarev, 2003; Gilyazov & Sparks, 2002; Sparks et al., 2005; Sokolov, 2006
Poland
Czyżowicz & Konieczny, 2001; Tryjanowski et al., 2002; Ptaszyk et al. 2003; Kaňuščák et al., 2004; Mitrus et al., 2005
Slovakia
Sparks & Braslavská, 2001
Czech Republic
Hubálek 2003; Hubálek 2004
Germany
Gatter, 1992; Bezzel & Jetz, 1995; Bailein & Winkel, 2000; Fischer & Witt, 2002; Hüppop & Hüppop, 2003; Witt, 2004; Sparks et al., 2005; Reichholf, 2005; Hüppop & Winkel, 2006
Netherlands
Both & Visser, 2001; Both et al., 2005
UK
Mason 1995; Loxton et al., 1998; Loxton & Sparks, 1999; Sparks, 1999; Jenkins & Watson, 2000; Sparks & Mason, 2001; Browne & Aebischer, 2003; Cotton, 2003; Sparks & Mason, 2004; Sparks et al., 2005
Switzerland
Jenni & Kéry, 2003
Italy
Jonzén et al., 2006
Spain
Peñuelas et al., 2002; Gordo et al., 2005; Gordo & Sanz, 2005; Rodríguez-Teijeiro et al., 2005; Gordo & Sanz, 2006
USA
Bradley, 1999; Inouye et al., 2000; Wilson et al., 2000; Butler, 2003; Strode, 2003; Ledneva et al., 2004; Marra et al., 2005
Canada
Lane & Pearman, 2003; Mills, 2005; Murphy-Klassen et al., 2005
Table A Studies that have analyzed temporal trends in bird migratory phenology for the last decades in Europe and North America. See references section for the complete reference of each study.
Mason, 2001; Gilyazov & Sparks, 2002; Cotton, 2003; Jenni & Kéry, 2003; Witt, 2004) and evidences of delays or advances are more equivocal than for spring. This could be due to some peculiarities of autumn migration. Birds move southwards without urgency to start reproduction as in spring. Furthermore, there is a mixing of juveniles and adults which may belong to different
Introduction
11
populations. Moreover, in many species autumn departures are more furtive which hinders a precise detection of this phenomenon. Finally, the increase of temperatures is not homogeneous throughout the year, and in some regions is especially slight or even non-existent for autumn (Gordo & Sanz, 2005). Hence, if there are no changes in the timing of the autumn season, migratory birds should not change this phase of their migration. Few studies have analyzed changes in migratory phenology for southern Europe (but see Jonzén et al., 2006) in spite of the relevance of the Mediterranean region for trans-Saharan migrants both as a breeding and passing area (Moreau, 1961). The pioneering study of Peñuelas et al. (2002) showed a delay in arrival dates in six common trans-Saharan species from a locality in NE Iberia during the last fifty years. However, the remainder of spring phenological events (e.g. flowering or leaf unfolding) have advanced in the same locality and period (Comas, 1999; Peñuelas et al., 2002). Using the same set of observations, Gordo et al. (2005) showed that this apparently counteradaptative migratory behaviour was due to the usually overlooked effect of climate in wintering grounds. Arrivals could be delayed due to the impaired ecological
conditions
in
the
wintering
Sahelian
areas
(Dallinga
&
Schoenmakers, 1987; Saino et al. 2004) as a result of persistent droughts in that area in recent decades (Dai et al., 2004). The effects of climate change could be complex and especially dramatic in migratory species which are doubly vulnerable because face changing conditions in both the wintering and breeding grounds. Two other studies (Gordo & Sanz, 2005; Rodríguez-Teijeiro et al., 2005) analyzed a time-series of migratory phenology for the same species from two localities, also from NE Iberia, and showed temporal trends in accordance with the hypothetical effect of climate change; that is, birds advanced their first arrival dates in recent decades. This disagreement could be due to the environmental and observational peculiarities of each study locality. A detailed examination of results reported in the studies cited in Table A also reveals the same phenomenon for several species (e.g. cuckoo Cuculus canorus). Therefore, more caution is desirable when generalizing results from single
12
General Synthesis
localities. Only studies based on extensive phenological networks that monitor several bird populations can offer a general view. In the same way, it is unclear how we should interpret these phenological changes, both advances and delays, without coupled measures of changes in reproductive success or survival of those individuals in most cases. It is necessary to compare the observed shift with how much a species is expected to shift to match the change in its environment caused by climate change (Visser & Both, 2005). Phenological studies in Spain Spain lags behind in the extensive tradition in phenological recording that exists in other European countries. To the author’s knowledge, the first phenological records regarding bird migration were published by Cavanilles in 1802. This author offers precise dates for the arrival date to Madrid of some common trans-Saharan migrants, such as the white stork Ciconia ciconia, the barn swallow Hirundo rustica, the common swift Apus apus and the house martin Delichon urbica. In the case of the white stork, he recorded a valuable series over six consecutive years between 1796 and 1802. Interestingly, the mean arrival date in these records is the 29th of January, which is almost identical to the mean value in our current database for Spain as a whole over the last sixty years (see Fig. 5.1). This is further evidence supporting the potential comparability of phenological records. The arrival date of a certain species is unique and unequivocal. Therefore, this simple measurement is perfectly comparable between observers, years and localities. Other anecdotic records can be found in some pioneering ornithological reports for Spain and Portugal (e.g. Saunders, 1871; Irby, 1895; Tait, 1924), which are also valuable as they offer arrival and departure dates prior to recent climate change. The first attempt to establish phenological studies in Spain was in 1883, thanks to Miguel Merino, director of the astronomic observatory of Madrid (Anon., 1943). However, this attempt to establish a systematic network of observatories was unsuccessful, as were some others over the following decades. For example, between 1913 and 1916 many of this type of record
Introduction
13
appeared published in the “Anuario del Observatorio Central Meteorológico” but without a classification or systematic reporting. There are phenological records on Catalonia and Balearic Islands dating from the end of the 19th century. Several local or regional initiatives carried out by meteorological associations (e.g. Xarxa Meteorològica de Catalunya i Balears) or institutes (e.g. Observatori de l’Ebre, Escoles Pies de Sabadell) incorporated phenology as another parameter in their climatic monitoring schemes. However, the first systematic records were carried out during the period from 1921 to 1939 thanks to the Servei Meteorològic de Catalunya (SMC; Fontseré & Campany, 1936). The dense meteorological network constituted in Catalonia at that time also incorporated phenology, especially of plants. Observational rules and events to be recorded followed very similar standards to those offered by other phenological networks from other countries. The only peculiarity was the list of selected species to be monitored, which was adapted to the most representative animal and plant species of Mediterranean regions. Unfortunately, most of the information recorded during those years together with previous documents which date back to the 19th century disappeared in 1939 during the Spanish Civil War. The few surviving records from that time have allowed the demonstration that arrivals dates were similar to the present (Gordo & Sanz, 2005). However, this fact must not diminish our concern about the potential hazards of climate change on migratory birds, and in general, on biodiversity in the Mediterranean region (e.g. Hódar et al., 2003; Peñuelas & Boada, 2003; Wilson et al., 2005; for an extensive review see Moreno, 2005). In 1942, the Servicio Meteorológico Nacional (SMN, former name of the present INM) requested that volunteer observers establish a phenological network in Spain (Anon., 1942). More than 300 people responded to this call. In 1943, the observational rules and the list of species and events to record (Anon., 1943) were distributed among the first volunteer observers, and the phenological network produced its firsts records. Most of these volunteers were already linked to the SMN as many were those in charge of meteorological stations. In some cases, these volunteers had been observers in the old
14
General Synthesis
Number of localities
500 400 300 200 100
1950 1960 1970 1980 1990 2000
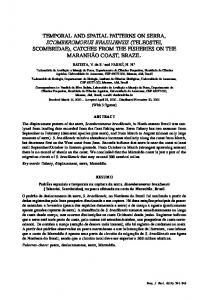
Year Figure B Annual number of localities in the phenological network of the Instituto Nacional de Meteorología that reported phenological data for the five studied birds during the period 19442004.
SMC network. Observational rules and the list of species and events were almost identical to those previously used by the SMC and thus similar to those used in other countries. This phenological network is still functioning with the same rules and list of species today. This fact is basic to ensure the homogeneity of stored data over the last six decades. Just one decade later, the phenological network involved several hundred observers spread throughout Spain. A noteworthy number of observers was maintained until the beginning of the 1970s (Fig. B). Since then, the number of observers has decreased and the continuity of the phenological network is currently endangered. Spanish authorities should make an effort to prevent the disappearance of a legacy of such enormous value in light of the demonstrated usefulness of phenology as a bioindicator of climate change (e.g. Canell et al., 1999; EEA, 2004). New technologies offer new opportunities to revive old phenological networks based on voluntary observers (e.g. Collison & Sparks, 2003). In parallel to the phenological network of the INM, in 1970 the Sociedad Española de Ornitología (SEO) constituted the Comisión de Fenología. The aim of this group was to organize all data received up until that time (e.g. Bernis,
Introduction
15
1962) and to coordinate future data reception from members of SEO about any aspect of bird migration in Spain (Fernández-Cruz & Sáez-Royuela, 1969). However, this initiative of SEO lacks the systematic approach for data collection adopted by the INM phenological network, despite including more species. More data compiled by Spanish ornithologists has been published periodically in the “Noticiero Ornitológico” of the Spanish ornithological journal Ardeola and other publications (e.g. Bernis, 1962; Bernis, 1966; Bernis, 1967; Bernis, 1970; Bernis, 1971; Santos & Tellería, 1977; Gómez-Tejedor & De Lope, 1993; Bermejo et al., 2002). The functioning of the Spanish phenological network Since its foundation, the primary task of the INM was to classify and store received data from volunteers. The INM system is strongly hierarchical (Fig. C). Anyone can become a volunteer observer. Once one makes a request to their
Observation Record in notebook Elaboration of postal card Consignment to regional office Consignment to central services Figure C Schematic representation of data transference from observer to final files of the Instituto Nacional de Meteorología.
corresponding regional INM office to be a volunteer, they receive free of charge a notebook for phenological observations postcards on which to submit the data (Fig. D) and a guide to the species (Fig. E; updated versions: Anon., 1989; García-Pertierra & Pallarés, 1991; Pallarés, 1996). Volunteers must send postcards with their observations every month to their corresponding regional offices. The information contained on a postcard is simple: locality, province,
16
General Synthesis
Figure D Examples of former and actual models of postcards used by observers to send data to regional agencies of the Instituto Nacional de Meteorología.
observer name, month, year, species and dates when a certain event was observed in each one (Fig. D). There are several types of postcards (designated A, B, C, etc) specifically designed for each event (flowering, fruiting, bird migration, etc). When data arrive to central services (in most cases several months after collection), they were transcribed to paper (until 1988; Fig. F) or
Introduction
17
Figure E Cover and example plate of the first guide of species for the phenological network (Anon., 1943). For each species a collection of common names (indicating provinces), description and approximated period for its phenophases was provided.
computerized (since 1988) documents. Thus, most of the records used in the current thesis were computerized from original manuscript files and other publications of the SMN (see below). The hierarchical functioning of the system transforms data processing as a slow process and increases the risk of errors as data must be transcribed several times before its ultimate storage in INM files. The present thesis represents the first attempt to explore all data stored in INM files over the last sixty years. The use of data by the INM services has been scarce. The greater part of the phenological records was published between 1944 and 1976 in the “Boletín Climatológico Mensual”. This monthly publication of the Sección de Climatología of the SMN contained phenological data classified by events, provinces and localities. Simultaneously, between 1943 and 1956 the data was also published by the Sección de Climatología of the SMN in annual volumes of the “Observaciones Meteoro-Fenológicas”. This
18
General Synthesis
Figure F Example page of the Instituto Nacional de Meteorología central services file where phenological records were transcribed until 1988.
publication compiled annual summaries with both meteorological and phenological data. Furthermore, rough maps of isophenes for some selected phenophases (e.g. barn swallow arrival) were included. The INM has also published the “Calendario Meteoro-Fenológico” since 1943 (named “Anuario Meteorológico” since 1982). It contains phenological maps since 1945 together with the rules and the list of the species for phenological observations. This publication was sent annually to all volunteers. The only attempt to analyze data for several years can be found in two publications of the INM that offer rough descriptive statistics (earlier, later and mean week) and phenological maps for some selected phenophases and localities (Anon., 1982; Anon., 1983). The phenological avian database resulting from the INM files from 1944 to 2004 for arrivals and departures of white storks Ciconia ciconia, cuckoos Cuculus canorus, common swifts Apus apus, barn swallows Hirundo rustica and nightingales Luscinia megarhynchos contains a total of 44,037 records
Introduction
19
belonging to 1,395 Spanish localities. Approximately 8,900 additional records, mainly for the period between 1988 and 2004, can be found for arrivals and departures of a wide range of species, both trans-Saharan (e.g. Coturnix coturnix, Streptopelia decaocto, Merops apiaster, Upupa epops, Delichon urbicum, Oriolus oriolus) and wintering birds (e.g. Grus grus, Vanellus vanellus, Motacilla alba, Turdus philomelos, Erithacus rubecula, Sturnus vulgaris). Characteristics of the studied trans-Saharan bird species White stork, cuckoo, common swift, barn swallow and nightingale constitute a small, but highly heterogeneous, sample of trans-Saharan bird species. The breeding range of the nominate subspecies of the white stork C. c. ciconia (Order Ciconiiformes, Family Ciconiidae) spreads across Europe, North Africa and Middle East. The European population is divided into two subpopulations: western and eastern (Bernis, 1959). Storks from the western population breed in West and Southwest Europe and in Northern Africa. These western European populations migrate southwest to Gibraltar and overwinter in West Africa (Fig. 6.2; Fiedler, 2001). Birds from the eastern population breed in central and east Europe and migrate through the Middle East to overwinter in East Africa (Van den Bossche, 2002). Most of the individuals (>90%) from the western population occur in the Iberian Peninsula, Morocco and Algeria. This is one of the most popular migratory birds due to its use of man-made structures for nest construction, such as roofs or poles, but it can also be found in trees and cliffs. It is basically a gregarious species, commonly feeding in groups (Alonso et al., 1994; Mullié et al., 1995), nesting colonially (Molina & Del Moral, 2005) and assembling in great flocks when migrating towards winter quarters (Bernis, 1974). White storks have one brood a year at about the end of March. The 2 to 6 eggs are incubated for 33 to 34 days. The fledging period varies between 58 and 64 days. It eats a wide variety of animal species depending on locality and prey availability (mostly earthworms, insects, amphibians, reptiles and rodents). In Spain, white storks select as preferred habitats open areas with dry or wet grasslands, crops and areas near rivers or wetlands which reflect the foraging preferences of this species (Carrascal et al., 1993).
20
General Synthesis
The Iberian and NW African populations of the cuckoo constitute the nominate subspecies C. canorus bangsi (Order Cuculiformes, Family Cuculidae). Its unmistakable song can be heard during the spring throughout almost all of the Iberian Peninsula being ubiquitous in all types of forest habitats. However, its winter distribution (only two European ringing recoveries) and behaviour within the Afrotropics are poorly known due to the combination of retiring habits and confusion with the African species Cuculus gularis. According to morphological measurements of collected individuals, Moreau (1972) located wintering quarters of the subspecies bangsi in western parts of West Africa. Its breeding system has traditionally been of great interest. It is a parasitic species, with females laying their eggs in the nests of other species. Host parents care and feed young cuckoos. Over 100 different host species have been recorded in Europe. A few hours after hatching, the young cuckoo ejects the host’s eggs or young and claims all parental care for itself. Once out of the nest (fledging period 19 days), young cuckoos continues to be fed by foster parents for up to 6 weeks. Post-fledging dispersal of young begins in July. Southward autumn migration begins in early August, earlier in adults than in juveniles (Seel, 1977). Its habitat distribution is largely determined by choices of principal host species and the presence of food supplies (mostly caterpillars). There are few Spanish towns or cities in which the nominate subspecies of the common swift A. a. apus (Order Apodiformes, Family Apodidae) does not breed (Martí & Del Moral, 2003). This wide distribution is due to man-made infrastructure which offers a suitable nesting place for this species in any hollow or cavity. There is no information about wintering distribution of Spanish populations. Ringing recoveries for other European populations point to Zaire, Tanzania, Zimbabwe and Mozambique as the main wintering areas. There are also scattered winter records across West Africa (Gambia, Liberia, Cameroon, Nigeria, and Mali). Highly gregarious through the year, the common swift forms breeding colonies and feeds on aeroplankton in noisy groups over towns and cities but also in peripheral habitats. Its lifestyle is essentially aerial with wellknown movements in bad weather conditions which can involve flying distances of hundreds of kilometres in a few days (e.g. Koskimies, 1947). Common swifts
Introduction
21
have one brood a year from about mid-May. The 1 to 4 eggs are incubated for 19 to 27 days. The fledging period is also highly variable (37-58 days) according to weather conditions during rearing of the young. Once out of the nest, young swifts are entirely independent. All individuals migrate soon after young have fledged. The nominate subspecies of the barn swallow H. r. rustica (Order Passeriformes, Family Hirundinidae) is one of the most widespread and abundant trans-Saharan birds in the Palaeartic. It breeds almost in all territories in the Iberian Peninsula (Martí & Del Moral, 2003). It overwinters in most regions of Africa, south of the Sahara Desert, though some individuals are recorded annually in winter in southern Spain. According to ringing recoveries, the primary wintering area for Spanish populations is the Guinean Gulf (see Fig. 6.2). Swallows occupy all types of habitats, although they are especially abundant in pastures, meadows and farm crops. Open man-made structures (e.g. barns, porches) provide suitable nest-sites and also favour their presence. This species is entirely dependent on a constant supply of small flying insects taken in flight in lower airspace near the ground or other surface. Barn swallows usually have two (sometimes three) broods a year from March. The 2 to 7 eggs are incubated for 11 to 19 days. The fledging period varies between 18 and 23 days. Fledged individuals become independent some weeks later. Out of the breeding season, this species is highly gregarious. Individuals form large roosts both during autumn migration and the wintering period (e.g. Curry-Lindahl, 1963). The nominate subspecies of the nightingale L. m. megarhynchos (Order Passeriformes, Family Turdidae) breeds throughout the Iberian Peninsula with the exception of the northern coast where an Eurosiberian climate prevails (Martí & Del Moral, 2003). Western European populations winter between the Sahara and rainforest regions from West Africa to Uganda (no Spanish ringing recovery) where it frequents savanna woodland, thorny scrub, humid forest edges and clearings, tangles of small trees, bushes and rank herbage fringing watercourses. Males defend their territories both in wintering and breeding grounds with their varied and loud songs, otherwise impossible to detect due to
22
General Synthesis
the extremely furtive habits of this species. Like the cuckoo, the nightingale is mostly solitary. Males arrive earlier than females and show marked fidelity to their site from year to year. This species selects areas with a dense bramble or any other bush cover in regions with mosaics of natural vegetation and crops, in riverside forests, cattle pastures, and even in urban parks. Diurnal song is mainly reserved for the interaction with other males, while nocturnal song attracts potential mates (Amrhein et al., 2002). Nightingales have two broods a year from late April. The 2 to 6 eggs are incubated for 13 days. The fledging period is short, only 11 days. Young become independent 2 to 3 weeks after leaving the nest. Its food supplies are mainly terrestrial invertebrates, especially beetles and ants; although in late summer it also feeds on berries. Nightingales leave Spanish breeding areas between the end of August and the end of September.
Objectives
23
OBJECTIVES The phenological avian database of the Instituto Nacional de Meteorología presents the opportunity to study the phenology of five heterogeneous trans-Saharan bird species from an unmatched spatial and temporal perspective for the Mediterranean region. Three main axes have structured the investigations carried out in the present thesis: spatial patterns, temporal trends and the factors underlying both. The specific objectives were: 1.
To describe the spatial variability observed throughout Spain in the phenology of the five study species; that is, to determine where species arrive earlier, depart later and stay longer.
2.
To model previously described spatial patterns for migratory phenology of each species by means of several types of environmental and geographical explanatory variables.
3.
To offer an interpretation from an evolutionary ecology perspective of the previously obtained models according to the particular characteristics of each species and to consequently determine the existence of potential common rules for bird migration throughout the Iberian Peninsula.
4.
To determine the existence of significant temporal trends during the last six decades towards the advancement or delay in arrival and departure dates, as well as in the total duration of the stays for the five study species in the Iberian Peninsula as a whole.
5.
To evaluate the role of the climate change in such changes.
6.
To assess the effect of interannual fluctuations in ecological conditions in wintering grounds, pass areas and breeding sites on spring migratory phenology. These aims were achieved in five chapters. In Chapter 1, the spring
colonization patterns of common swifts Apus apus and barn swallows Hirundo rustica were studied (Objective 1). Multiple regression was utilized to obtain
24
General Synthesis
predictive models for arrival dates from a set of forty topographical, climatic, river basin, geographical and spatial predictive variables (Objective 2). Both species are similar in their morphology, flight performance and ecological requirements, but barn swallows arrive around one month earlier than common swifts. This study system allows the determination of the relative influence of: constant (on our time scale) characteristics of Iberian Peninsula geography and topography; changes in ecological conditions during the course of spring; and/or the influence of the evolutionary history of each species on their migration patterns (Objective 3). In Chapter 2, the geographical variability in the singing onset of two migratory species, the cuckoo Cuculus canorus and the nightingale Luscinia megarhynchos, was studied (Objective 1). Partial least square regression was employed to determine the environmental syndrome most related to the observed variability in singing phenology (Objective 2). This study system is alternative and complementary with that described in Chapter 1. Here, two different species are subjected to the same ecological scenario due to their similar migratory timing. Differences or similarities can only be justified on the basis of the species unique characteristics or the existence of environmental constraints in the Iberian Peninsula, respectively (Objective 3). In Chapter 3, spatial patterns for arrivals, departures and stays of the Spanish white stork Ciconia ciconia populations were described (Objective 1). Multiple regression models were again used to evaluate the modelling ability of different predictive variables (Objective 2). This study system allows the determination of the influence of environmental variables for the same species in different phenological phases of its life cycle, and thus whether each event is affected by unique variables or by common environmental predictors (Objective 3). As this species is a large and soaring bird, its spring arrivals offer a very different study model to test whether results found in previous chapters are also fulfilled in this case (Objective 3). In Chapter 4, all records for the five species studied were employed as a whole to determine the existence of temporal trends on bird migratory phenology during the last sixty years in the Iberian Peninsula (Objective 3). In
Objectives
25
this chapter, potential relationships with climatic variables, both from breeding and wintering quarters, were also explored (Objectives 5 and 6). In Chapter 5, a preliminary assessment regarding the influence of the climate of African wintering grounds on spring arrival was conducted for a single locality from NE Spain (Objective 5 and 6). There, temporal trends for spring arrivals were opposite to those expected on the basis of the advancement of spring events in the breeding site. Therefore, an alternative origin for these trends from the generally purposed global warming of breeding grounds should be tested. For this purpose, meteorological data from all of Africa was used, which allows for the simultaneous determination of the relative importance of wintering vs breeding grounds and, within Africa, the relative importance of each of the main climatic regions both in the short and long-term. Finally, in Chapter 6, a more complete and comprehensive exploration of the potential factors underlying temporal changes in spring migratory phenology was conducted (Objectives 5 and 6). This chapter employed only the last twenty years of phenological records for the whole of Spain and related them both to wintering and pass area conditions under a hypothetical framework for bird migratory phenology. These conditions were assessed both by means of satellite measurements of vegetation productivity and by meteorological data.
26
General Synthesis
RESULTS AND DISCUSSION Spatial patterns of migratory phenology of trans-Saharan birds from the Iberian Peninsula The spatial structure of the common swift and barn swallow arrivals was stronger than in the rest of the studied species. Their patterns of spring colonization were clear (Fig 1.1): first individuals arrive to the south-western corner of the Iberian Peninsula and later progress north-eastward. This progression is only disrupted by the mountainous region of the Iberian System where arrivals are the latest. In the rest of the cases, a visual inspection of interpolated data (Figs. 2.1 and 3.1a) offered a less obvious picture. This apparent absence of strong spatial structure was confirmed by the lesser model performance (Table 2.2 and 3.2). This can neither be attributed to the environmental and geographical explanatory variables used, nor to a lesser number of employed localities in these cases. In spite of these difficulties, some general rules for the spring colonization of the Iberian Peninsula arise from all obtained models: •
Birds arrive later to northern and higher elevated sites.
•
Birds arrive earlier to drier areas during summer.
•
Birds arrive later to those localities distant from and with a costly route from the Straits of Gibraltar.
•
The southwestern corner of Iberia is the earliest arrival area, while Turia basin is the latest one to be colonized.
•
Climatic variables showed the best modelling ability among all types of employed explanatory variables.
These general rules for the spring colonization of the Iberian Peninsula are especially obvious in the final models of the common swift and barn swallow (Tables 1.2 and 1.3). They included almost the same variables, showed almost the same explanatory capacity and produced consequently very similar predictive maps for their spring arrivals (Fig. 1.6). In species like the common swift and barn swallow (i.e. species specialized for feeding on flying insects),
Results and Discussion
27
the environment plays a key role in determining the spatial migratory patterns. Migration through Spain is not equally probable in all directions once the Mediterranean is crossed. There is an optimum route with the least cost to reach a certain site. These routes are often longer than a direct flight from the Gibraltar area (Fig 1.3). This fact explains why south-eastern Iberia is colonized much later than would be expected according to its climatic conditions and proximity to Gibraltar. Therefore, the unavoidable configuration of the Iberian Peninsula constrains spring colonization patterns in these two species. In the case of the singing onset of the cuckoo and nightingale, final best models for both species were able to explain only about 27% of the observed variability among localities (Table 2.2). The lower model performance may be due to the detection methodology of first individuals. The singing onset is determined by arrival date but also by male choice of singing activity after its arrival to the breeding area. These latter choices are influenced by other variables independent from migration. For example, population density was an important explanatory variable, especially in the case of the cuckoo (Table 2.2). However, the sign of the relationship between singing onset and cuckoo population density confounded predictions (Sparks et al., 2001; Tryjanowski & Sparks, 2001; Tryjanowski et al., 2005), since earlier onset was detected in marginal areas of its distribution with a low density of individuals. This relationship may be result of the parasitic reproduction of this species. We suggest that cuckoos suffer from increased intra-specific competition in those areas with a low density of potential host pairs. Here, selective pressures for earlier arrivals would be higher. Final best predictive models for the cuckoo and nightingale offered a different picture (Fig. 2.3). According to singing onset dates, the cuckoo colonizes most parts of Spain in a first and early migratory wave, whereas the nightingale does so in a second and later wave. Therefore, the specific migratory component seems to be more important than the potential environmental constraints, since both species migrate through Iberia around similar dates and thus are exposed to a similar ecological scenario.
28
General Synthesis
Finally, a visual inspection of maps for interpolated arrival, departure and stay data of white storks (Fig. 3.1) points towards the absence of strong spatial patterns. The conspicuousness of this species makes it difficult to attribute this fact to the inaccuracy of recorded dates (Tryjanowski et al., 2005). In the case of spring arrivals, the best final model was able to capture about 34% of variability among localities. White storks arrive later to northern and eastern sites
with
moist
summers.
Therefore,
the
southwestern-northeastern
progression axis throughout Iberia also appears in this large and soaring bird. The density of breeding pairs (measured as the number of nests in a 20 km radius around a UTM) also has a negative effect on the arrival date (Fig. 3.3). We suggest that this is more likely due to the competence for nest occupancy than to a real bias from density-dependence in arrival dates (Dallinga & Schoenmakers, 1987; Sasváry et al., 1999; Tryjanowski et al., 2004; but see Wuczyński, 2005). Spatial patterns for departures and lengths of stay of white storks were extremely weak. The absence of spatial autocorrelation in residuals of the best final models (Fig. 3.4), as well as in the rest of the studied cases (Figs. 1.5 and 2.2), signifies that no important spatially structured explanatory variables have been excluded (Cliff & Ord, 1981; Legendre & Legendre, 1998; Keitt et al., 2002). Therefore, no other variables, on our working scale, would help to improve model predictions of all species. In the particular case of departures and stays of the white stork, there is clearly an absence of spatial patterns. Departure decisions are strongly influenced by social behaviour in this species dependent on collective decisions influenced by unique local environmental conditions of each year rather than macrogeographic gradients. In the case of the length of stay, it was well-modelled both by arrival and departure median dates for the same UTM. This is not surprising since the length of the stay was calculated from these phenological measures. However, it must be noted that the total duration of the stay was more dependent on the departure date. Interestingly, the aridity index and the precipitation in summer were the only climatic variables included in white stork models. Summer climatic variables appeared repeatedly as very important explanatory variables for
Results and Discussion
29
spatial patterns of all species (e.g. Fig. 1.4). These variables, together with the aridity index, are closely related to the productivity during the most unfavourable season in Mediterranean regions (i.e. summer). This fact suggests that for Mediterranean populations of trans-Saharan birds the limiting summer conditions could be modulating life cycle stages for the rest of the year. Temporal trends in migratory phenology of trans-Saharan birds from the Iberian Peninsula The first arrival date of all species, with the exception of the nightingale Luscinia megarhynchos, showed significant temporal trends during the study period from 1944 to 2004 (Fig. 4.1). The white stork Ciconia ciconia showed the steepest advancement. This species arrives at present about 30 days earlier than just 20 years ago. The common swift Apus apus and the barn swallow Hirundo rustica showed similar temporal fluctuations (Fig. 4.1). Their arrivals were markedly delayed at the beginning of the 1970s. Since then, a trend toward advancement has been recorded. The cuckoo Cuculus canorus and the nightingale showed little inter-annual fluctuations in their spring arrivals (Fig. 4.1). They were always heard for the first time during the first two weeks of April. Only the cuckoo showed a significant relationship with the year and its quadratic term: its singing onset was delayed until the beginning of the 1980s and has advanced since then. All species with significant temporal changes in their arrival dates showed trends toward advancement in recent decades (Table 4.1). This result concurs with previous studies reporting changes attributed to climate change (Loxton et al., 1998; Sokolov et al., 1998; Tryjanowski et al., 2002; Butler, 2003; Hüppop & Hüppop, 2003; Lehikoinen et al., 2004; Zalakevicius et al., 2006) with special regard to the increase in temperatures. In the particular case of the white stork, its significant advancement should be interpreted on the basis of the increasing number of wintering individuals in the Iberian Peninsula in recent years (Molina & Del Moral, 2005), which may return to their breeding localities earlier. This change in migratory behaviour is probably due to guaranteed food availability during winter as the result of access to rubbish dumps and the
30
General Synthesis
expansion of the population of the invasive red swamp crayfish Procambarus clarkii (Tortosa et al., 1995; Tortosa et al., 2002; Peris 2003). Milder winters in recent decades may also enhance wintering survival of non-migrant individuals (Mata et al., 2001). If we focus in the other three species (cuckoo, common swift and barn swallow), the advancement in arrival date recorded in recent decades should be better interpreted as a trend toward re-establishing the timing of migration after an anomalous period of delayed arrivals during the 1970s and 1980s. In fact, arrival dates at present are similar to those recorded in the 1940s. In the case of the common swift and barn swallow, the strong delay recorded in the years 1970-72 was due to the synergistic effect of exceptional climatic circumstances both in wintering and breeding areas (Fig. 4.4). Extremely dry winters in Africa were followed by extremely cold springs in Spain. Almost two decades were necessary again achieve similar arrival dates to those recorded previously to these three years. This fact could be an indication of the serious consequences of punctual but extreme climatic events for birds (e.g. Winstanley et al., 1974; Bosch & Fiedler, 2000; Hernán-Vargas et al., 2006). Common interdecadal fluctuations were found for the autumn departure of the white stork, common swift and barn swallow (Fig. 4.2). All species tended to depart earlier until the mid-1960s. Then, departures were later year after year until the mid-1980s. During the last two decades a clear trend toward earlier departures has been recorded. However, these fluctuations were only significant for the barn swallow (Table 4.1). This species has advanced its departure during the study period. The length of stay showed all possible temporal responses in the three previous species (Fig. 4.3). It increased markedly in the white stork, it did not show significant temporal changes in the common swift, and it was shorter in the barn swallow. This heterogeneity arose from the unique temporal trends in arrivals and departures dates of each species. The length of stay merits further attention in future studies in light of the apparent species-specific responses and the potential implications for bird survival and reproductive success of any change in this part of the life cycle.
Results and Discussion
31
Factors related to temporal changes in bird migratory phenology Results obtained in Chapters 4, 5 and 6 point towards climate as the most plausible underlying mechanism for temporal fluctuations in bird migratory phenology. In Chapter 5, arrivals of six analyzed species for a single locality from NE Spain were better associated to climate from Africa than to climate from the same locality. All species have delayed their arrival dates since 1952 (Fig. 5.3), as opposed to results reported in most previous studies (see Table A). This change in migratory behaviour was unexpected since other spring events (such as flowering, leaf unfolding or insect appearance) advanced during the same period (Comas, 1999; Peñuelas et al., 2002). Rainfall in Africa was included in final multiple regression models in all species, with special regard to western coast and Sahel regions (Fig. 5.1; Table 5.2). Furthermore, in most cases arrivals were better associated to long-term effects of climatic variables, i.e. to climatic patterns during the twelve months prior to departures from wintering grounds (Table 5.1). This study suggested that climatic variability in wintering grounds should be taken into account as a potential factor which can affect arrivals to breeding grounds. This effect of conditions in Africa should be especially notable in populations monitored in southern European regions since they arrive just after the crossing of the Sahara Desert. When we used phenological time-series of arrivals for Spain as a whole (Chapter 4), we obtained significant relationships both with temperatures from Iberia and with precipitation from the Sahel area (Table 4.2). These two rough climatic measurements are good proxies of the environmental conditions in breeding and wintering areas, respectively. Warmer springs in Spain advance arrivals due to the advancement of the spring in the breeding grounds (Peñuelas et al., 2002; Stefanescu et al., 2003; Gordo & Sanz, 2005) that increases chances for foraging and survival of early individuals which could progress through Spain more quickly. Winters preceded by rainy seasons with scarce precipitation were associated with later arrivals to Iberia in the following spring for some species (Fig. G). The potential factors acting during wintering and migratory periods that can affect the arrival time of birds to their breeding areas (Fig. 6.1) are too
General Synthesis
Arrivals of barn swallow
32
12 10 8 6 4 2 0 -2 -4 -6 -8 -10
r = -0.643 P < 0.001
-100
-50
0 50 Sahel Index
100
Figure G Scatterplot of the barn swallow mean residual for arrivals for Spain as a whole against the Sahel Index in the preceding rainy season. Solid line represents the best fitted linear model. The correlation (r) and its significance (P) are also given.
numerous to be assessed simply through correlations with a simplistic measurement as the Sahel Index (but see, Stenseth & Mysterud, 2005). Moreover, the potential impact of the conditions in the pass areas was not tested in Chapter 4, although it has been demonstrated that these sites can play a key role in bird migration in spite of the fact that they represent generally small areas and are visited over relatively short time intervals within the life cycle of migratory birds (Ahola et al., 2004; Both et al., 2005; Newton, 2006). The potential effect of wintering and pass areas on spring migratory phenology was evaluated in Chapter 6 by means of NDVI satellite measurements, a direct measurement of the ecological conditions in a certain area (Nicholson et al., 1990). Results agree with primary conclusions obtained in Chapter 4 and the hypothesis purposed in Chapter 5. The white stork, cuckoo and barn swallow were strongly related by NDVI measured in the wintering areas (Table 6.2). Birds arrived earlier after winters with more vegetation productivity in potential African wintering quarters. In the case of the white stork, no effect has been found with the Sahel Index. The arrival dates of the nightingale were again unaffected by any environmental variable. This fact, together with the absence
Results and Discussion
33
of temporal trends, suggests that the migration and singing onset phenology of this species may be strongly fixed by endogenous rhythms. The study conducted in Chapter 6 demonstrates the importance of an accurate selection of the variables used to evaluate the effects of ecological conditions over bird migratory phenology. The potential number of predictors to be included in this kind of analysis is virtually infinite (e.g. Ahola et al., 2005; Zalakevicius, 2006) and thus the risks of spurious correlations and pseudoreplicative results are increased. Only those types of variables during certain time periods with a clear functional hypothesis for the studied species should be taken into account. Results obtained for several species belonging to several populations in Chapters 4 and 6 reinforce previous studies about the influence of conditions in wintering areas on spring migratory phenology (see Chapter 5; Dallinga & Schoenmakers, 1987; Saino et al., 2004; Rodríguez-Teijeiro et al., 2005). Low values of the Sahel Index are closely related to low values of NDVI (Tucker et al., 1991) because in dry regions, such as the Sahel, vegetation productivity is constrained by water availability (Nicholson et al., 1990; Herrmann et al., 2005). Poor ecological conditions in wintering grounds can reduce survival of individuals, impair quality of moulted feathers and make difficult the acquisition of adequate pre-migratory body condition. Fewer numbers of individuals with low quality feathers and with low fat reserves may delay the detection of the first individuals (Fig 6.1) since there are few chances to observe early individuals, there is less competence for early arrival among males, flight performance is impaired, and the number and/or duration of previous stopovers would be greater (Winstanley et al., 1974; Loske, 1990; Szép, 1995; Foppen et al., 1999; Salewski et al., 2002; Boano et al., 2004; Møller, 2004; Ottoson et al., 2005). Departure dates were less strongly related to climatic variables than arrivals (Table 4.2). This was unexpected since clear interdecadal fluctuations occurred during the last six decades (Fig 4.2). The best predictor for departure dates was temperature at breeding time. This suggests some kind of long-term effect of climatic conditions mediated through life cycle phases previous to autumn migration (Lack, 1958; Ellegren, 1990; Sokolov 2000; Bojarinova et al.
34
General Synthesis
2002). In any case, it is difficult to offer hypotheses for the observed temporal changes in departure dates when a few or even no variables (e.g. common swift) are related to them. Results for the Iberian populations as a whole do not help to clarify the heterogeneous picture offered by previous studies about the potential impacts of climate change on autumn migration (Gatter, 1992; Bezzel & Jetz, 1995; Sokolov et al., 1999a; Bairlein & Winkel, 2001; Jenni & Kéry, 2003; Witt, 2004; Gordo & Sanz, 2005). The absence of clear evidence of climate change on temporal trends of autumn migration could be due to some unfavourable characteristics of departure dates: 1) Mixture of juveniles, males and females; 2) Less urgency to reach wintering quarters; 3) More probable misidentifications between local breeders and pass individuals; 4) The lesser conspicuousness of the phenomena.
Conclusions
35
CONCLUSIONS 1.
Phenological data gathered from volunteer networks provide a sensitive tool for the assessment of spatial and temporal variability of bird migration timing.
2.
Spring colonization patterns always showed a southwestern-northeastern progression axis throughout Iberia. Birds always arrived later to northern localities, at high altitude, with rainy summers and far from Gibraltar. Thus, unavoidable environmental and geographical configuration of the Iberian Peninsula shapes some general sketches for its spring colonization in all studied migratory species.
3.
Apus apus and Hirundo rustica showed a strong resemblance in their spring colonization patterns, despite migrating in different periods. These similarities are due to the high dependency on fixed abiotic variables (i.e. environmental and geographical predictors) that constrain migratory patterns for species with similar morphology, ecological requirements and flight performance.
4.
Alternatively, Cuculus canorus and Luscinia megarhynchos showed different spatial patterns in the singing onset, despite migrating during the same period and thus being subjected to the same environmental influences. These differences are due to the differences in biology and ecological requirements of both species. Moreover, singing onset could be affected by other environmental factors acting on singing decisions after individual arrival.
5.
The spring colonization pattern of the white stork follows the above mentioned general migratory sketches, while departures and stays do not show any spatial structure.
6.
Trans-Saharan birds from the Iberian Peninsula showed significant interdecadal fluctuations in their migratory phenology during the last sixty years. C. canorus, A. apus, H. rustica and L. megarhynchos arrive at
36
General Synthesis
present at similar dates to those recorded at the beginning of the study period (1940s). Thus, the advancement reported since the mid-1970s is better interpreted as a return to former arrival dates after an abnormally delayed period. 7.
The significant advancement (40 days) recorded in C. ciconia arrivals should be interpreted on the basis of the observed trend toward settlement of Iberian populations.
8.
Climate both in wintering and breeding grounds affected arrival dates. Wet winters in arid regions in Africa and warm springs in Spain were linked consistently to advanced arrivals. Therefore, recent climatic changes are the most plausible factors underlying the observed temporal trends in bird phenology. Phenology must be included as a bioindicator in future research about the impacts of climate change in Mediterranean regions.
9.
Both spatial and temporal patterns for autumn migration were less obvious and poorly modelled by potential predictors in all cases. This phenological event merits further attention.
10. A comprehensive analysis for five heterogeneous common transSaharan birds suggests that spatial and temporal patterns of migratory phenology are more complex than previously suggested.
Resum
37
RESUM Introducció Cada any milions d’aus migratòries es mouen entre dues àrees diferents, que normalment es troben a milers de quilòmetres de distància. La migració suposa setmanes o fins i tot mesos de viatge, que poden implicar travessar barreres ecològiques com ara muntanyes, deserts i oceans. En el cas dels ocells trans-saharians, hi ha unes 185 espècies que nidifiquen al Paleàrtic i passen l’hivern al sud del Sàhara. Les característiques de la migració, fan d’aquest fenomen un dels més fascinants de la natura i, per tant, no és sorprenent que hagi estat un tema d’interès per l’observador humà des de fa molt de temps. L’estratègia de moure’s d’una banda a altra de les aus migratòries respon a les fluctuacions que es produeixen als ambients on viuen. La majoria dels ambients del nostre planeta estan sotmesos a l’estacionalitat resultant de la rotació de la Terra al voltant del seu eix. Això provoca canvis en l’energia rebuda al llarg del cicle anual, fet que suposa les variacions estacionals en el clima i la vegetació. Les aus migratòries es mouen entre dues àrees per aprofitar les millors condicions ambientals que es donen a cadascuna d’elles en certs moments de l’any. En el cas de les espècies trans-saharianes, aprofiten l’abundor de la primavera als quarters europeus alhora que eviten el dur hivern marxant cap a latituds tropicals. En conjunt, aconsegueixen viure sota unes condicions ambientals més favorables que si passessin tot l’any en un sol lloc i, en conseqüència, les poblacions poden ser més nombroses. L’èxit de la migració es recolza en tres adquisicions fonamentals: •
Adaptacions fisiològiques per afrontar els reptes que imposa el període migratori.
•
Mecanismes de navegació que assegurin la ruta correcta entre els llocs d’origen i destinació.
•
Ritmes endògens que assegurin l’inici i final de cada estadi del cicle vital en el moment corresponent.
38
General Synthesis
Els ritmes endògens són la resposta adaptativa dels organismes a les fluctuacions ambientals. En el cas dels ocells, moltes altres parts del cicle vital a més de la migració també es troben pre-programades i tenen una forta base genètica, com ho demostra el fet que en moltes espècies es manté la disposició a migrar, a reproduir-se o a mudar tot i estar sotmeses experimentalment a unes condicions ambientals constants. Tot i aquesta ritmicitat interna calen elements ambientals externs que ajudin a sincronitzar-la amb la progressió natural de les estacions. Entre aquests elements el més important és el fotoperíode. El cicle vital d’un ocell migratori alterna diversos estadis al llarg de l’any (Fig. A). Aquesta successió alterna les funcions vitals de la millor manera per assegurar la supervivència de l’individu i maximitzar la seva eficàcia biològica en funció de les fluctuacions ambientals. Per tant, la reproducció, muda o migració estan ubicades en aquell moment de l’any que garanteix que la demanda individual i l’oferta ambiental estaran millor acoblades. L’èxit individual es basa, doncs, en l’adequat inici i final de cada estadi vital, o sigui, en una adequada fenologia. Si una fase es retarda, la següent també ho ha de fer o, alternativament, ambdós estadis s’han de produir simultàniament, fet que imposarà trade-offs en l’assignació de recursos. Quan la sincronització entre els diferents estadis del cicle vital i les condicions ambientals necessàries per dur-los a terme desapareix, llavors cal esperar conseqüències molt greus pels individus. Per tant, una adequada fenologia esdevé la clau per al correcte funcionament dels cicle vitals. La fenologia estudia els fenòmens naturals recurrents, com ara la floració, la sortida de les fulles, l’aparició dels insectes o l’arribada i emigració de les aus. En definitiva, tots aquells fenòmens naturals que defineixen molt millor el pas de les estacions que no pas el calendari astronòmic. Aquesta disciplina té una història molt antiga. Al Japó es poden trobar registres des de el segle IX i a la Xina des del XVI. A Europa la història de la fenologia s’inicià a principis del segle XVIII, essent probablement els registres de caire biològic més antics que existeixen. Per exemple, els registres de Robert Marsham de Norfolk, UK, daten de l’any 1736. Aquesta afecció va ser continuada pels seus
Resum
39
successors durant els dos segles següents. La primera metodologia descrita per fer observacions fenològiques la va publicar Carl Von Linné a mitjans del segle XVIII. Tot just uns quants anys més tard va començar a funcionar una xarxa fenològica a Suècia. Des de mitjans del segle XIX es troben xarxes fenològiques a la majoria de països europeus. Aquestes solen estar coordinades per serveis meteorològics de caire estatal i fan especial èmfasi a la fenologia de les plantes. A diferencia dels primers naturalistes, que seguien la tradició linneana, aquestes xarxes tenen un clar interès aplicat. Volen ajudar a millorar les pràctiques agrícoles a través d’un coneixement fi de la fenologia vegetal. La fenologia ha estat una disciplina tradicionalment compartida per la biologia i la climatologia. Donat que és un bon indicador del pas de les estacions es va incloure ben aviat com un paràmetre més a controlar a les xarxes meteorològiques. Aquest fet ha permès que els registres fenològics gaudeixin d’una cobertura geogràfica i temporal inimaginable per a qualsevol altre paràmetre biològic. Això ha estat possible gràcies a que les xarxes fenològiques estan basades en gent no especialitzada. Hom és capaç de percebre el pas de les estacions, i per tant qualsevol pot enregistrar aquests esdeveniments tan ben coneguts. Per desgràcia, tot i les enormes quantitats de registres acumulats per aquestes xarxes fenològiques encara hi ha pocs estudis que n’hagin fet un anàlisi acurat. La manca d’eines, com per exemple ordinadors, fins no fa gaire per gestionar fàcilment tantes dades, ha estat un obstacle insalvable per a aquest objectiu durant la major part de la història. Gràcies al canvi climàtic (o malauradament per culpa d’ell, segons es vegi) la fenologia s’ha tret del damunt aquesta imatge de passatemps per naturalistes que tenia fins no fa gaire. Els científics tornen a tenir mot interès en aquesta disciplina perquè s’ha demostrat el valor que té en la recerca sobre el canvi climàtic. La capacitat dels organismes per a detectar canvis climàtics era d’esperar, ja que els cicles vitals han d’estar perfectament sincronitzats amb la successió de les estacions, i aquesta està determinada pel clima. Per tant, és d’esperar que la fenologia dels organismes canviï en sintonia amb els canvis climàtics per adaptar-se de la millor manera possible a les noves condicions.
40
General Synthesis
El clima de la Terra ha canviat contínuament i aquests canvis han implicat respostes per part del organismes per tal d’adaptar-se. Llavors, per què ens ha de preocupar el canvi climàtic actual? Perquè té tres característiques que el diferencien de qualsevol altre que se’n tingui constància: •
Origen humà. S’accepta que el principal responsable del l’increment de les temperatures és l’augment dels gasos d’efecte hivernacle.
•
Condicions globals notablement més càlides. El segle passat les temperatures van incrementar 0,6 ºC i s’espera un increment d’entre 1,4 i 5,8 ºC per al final d’aquest segle.
•
Velocitat i magnitud dels canvis extraordinària. L’increment de les temperatures serà de l’ordre del que s’ha produït entre períodes glacials i interglacials, però a una velocitat 10 cops superior.
Un nombre d’estudis cada cop més gran està demostrant l’existència d’efectes del canvi climàtic en tota mena de paràmetres biològics, en una àmplia varietat d’espècies d’arreu del món i tant de medis terrestres com aquàtics. Es poden destacar entre aquests efectes: pèrdues de biodiversitat, expansió cap els pols dels rangs de distribució, canvis en altitud en les distribucions,
retracció
dels
rangs
de
distribució,
canvis
morfològics,
avançament del moment de la reproducció, canvis en l’èxit reproductiu, canvis en la dinàmica de poblacions, canvis en els caràcters sexuals, acceleració del desenvolupament, alteració dels períodes migratoris, desajustaments entre nivells tròfics o alteració d’altres tipus de relacions interespecífiques. No ens ha de sorprendre que els impactes del canvi climàtic siguin tan amples perquè el clima és probablement el factor més important que afecta el funcionament dels ecosistemes i dels cicles vitals. Per tant, cal esperar que les evidències incrementaran conforme el canvi climàtic continuï i es duguin a terme més estudis. D’entre tot aquest ventall d’aspectes biològics afectats pel canvi climàtic, la fenologia va ser un dels primers en oferir evidències i probablement és el més estudiat. Els motius pels quals la fenologia esdevé un bioindicador important del canvi climàtic són:
Resum
41
•
La fenologia és molt sensible al clima.
•
La fenologia és barata i fàcil d’enregistrar.
•
La fenologia s’estudia des de fa dècades o segles.
•
La fenologia no té problemes amb la homogeneïtat de registres i és fàcilment estandaritzable entre xarxes d’observadors.
•
La fenologia és una evidència real que els éssers vius responen al canvi climàtic.
Els ocells probablement són el grup animal que ha rebut més atenció per part de la comunitat científica. Això és degut a la llarga tradició que té l’ornitologia com a disciplina, fet que ha afavorit l’existència de programes de seguiment durant les últimes dècades, que és quan s’ha produït el major increment de les temperatures. Els efectes del canvi climàtic als ocells ha estat demostrat en aspectes ben diversos de la seva biologia, com ara: la distribució geogràfica, abundància de les poblacions, caràcters morfològics, selecció sexual, fenologia reproductiva, èxit reproductiu o fenologia migratòria. La fenologia migratòria ha rebut especial atenció, donada la seva popularitat. L’arribada i emigració dels ocells constitueix un indicador clàssic de les estacions. Els programes de seguiment a llarg termini sobre fenologia migratòria tenen el seu origen en: 1) iniciatives personals; 2) xarxes meteorològiques; 3) observatoris ornitològics; 4) programes de seguiment més complexos habitualment associats a l’anellament. La majoria dels estudis que han analitzat canvis a llarg termini en la fenologia han demostrat que les dates d’arribades s’estan avançant durant les darreres dècades. Aquest canvi en el comportament migratori s’ha atribuït al canvi climàtic i especialment a l’increment de temperatures. La primavera s’ha avançat als quarters de cria paleàrtics fet que facilita la migració a través d’aquestes àrees gràcies a la major abundància de menjar i a unes condicions meteorològiques menys adverses. Com arribar d’hora té molts beneficis, les poblacions han avançat les dates de retorn a les àrees de cria per tal d’aprofitar de la millor manera la nova situació. Per contra, l’absència de canvis o fins i tot una arribada més tardana detectada en certs casos podria estar indicant
42
General Synthesis
l’existència de pressions ambientals oposades dintre dels cicles vitals dels ocells migratoris a més d’una certa inflexibilitat dels ritmes endògens que controlen els diferents estadis del cicle vital per adaptar-se a la nova situació. Pel que fa a la migració de la tardor hi ha pocs estudis que l’hagin analitzat
amb
profunditat,
oferint
evidències
tant
d’avançament
com
d’ajornament de la mateixa. Això podria ser degut a les peculiaritats d’aquest període migratori respecte al primaveral: hi ha menys urgència per arribar als quarters d’hivernada, hi ha una barreja d’individus de diferents edats, sexes i procedències, i a més sol atreure menys l’atenció dels observadors. Per altra banda, l’increment de les temperatures no s’està produint de forma homogènia dintre de l’any, essent escàs o pràcticament nul als mesos de tardor. Hi ha pocs estudis que hagin analitzat canvis en la fenologia migratòria en el sud d’Europa, tot i que la regió mediterrània és fonamental per a les aus trans-saharianes. L’estudi pioner de Peñuelas et al. (2002) va demostrar que s’ha produït un ajornament de les arribades durant els últims 50 anys en una localitat mediterrània. En canvi, la resta de fenòmens primaverals es van avançar durant el mateix període. Fent servir les mateixes dades, Gordo et al. (2005) van demostrar que aquest comportament aparentment contra-adaptatiu era degut probablement a l’efecte del clima a les àrees d’hivernada, clima que normalment no s’havia tingut en compte en estudis previs de caire similar. Les arribades podrien ésser més tardanes per l’empitjorament de les condicions ecològiques a les àrees d’hivernada del Sahel on hi ha hagut sequeres persistents durant les darreres dècades. Per tant, els efectes del canvi climàtic poden ser complexos i especialment dramàtics en el cas del ocells migratoris que són doblement vulnerables als canvis perquè s’han d’enfrontar a les condicions tant de les àrees de reproducció com a les de cria. Altres estudis posteriors han tornat a analitzar les mateixes espècies en localitats properes a l’anterior trobant tendències oposades, és a dir han trobat un avançament de les dates d’arribada. Aquests resultats aparentment contradictoris podrien ser el reflex de les peculiaritats ambientals i observacionals de cada localitat d’estudi així com de les pressions ecològiques rebudes per cadascuna de les poblacions. Per tant, cal més cautela a l’hora de
Resum
43
generalitzar els resultats d’una sola localitat. Només aquells estudis basats en una xarxa fenològica capaç de fer un seguiment de moltes poblacions poden oferir resultats més generalitzables. En el mateix sentit, no està clar com s’han d’interpretar aquests canvis (avançament o ajornaments) sense mesures paral·leles en la gran majoria de casos de l’èxit reproductiu o la supervivència dels individus implicats. Cal comparar aquests canvis amb els que serien necessaris per tal de continuar ben acoblats a les fluctuacions ambientals. L’escassetat d’estudis citada és el reflex de una pobre tradició dels estudis de fenologia a la península. Els primers registres que conec pertanyen a Cavanillas (1802), que dóna dates precises de l’arribada de la cigonya blanca Ciconia ciconia, oreneta vulgar Hirundo rustica, falciot Apus apus i oreneta cuablanca Delichon urbicum a Madrid. Curiosament, la sèrie d’anys oferts per la cigonya dóna una data (29 de Gener) pràcticament idèntica a la que es pot obtenir amb el conjunt d’observacions de la base de dades emprada en aquesta tesi (Fig. 5.1), fet que reforça la vàlua esmentada dels registres fenològics donada la seva comparabilitat. La data d’arribada és única, el que fa que esdevingui una mesura fàcil i perfectament comparable entre observadors, anys i localitats. A finals del segle XIX hi ha els primers intents, sense èxit, d’establir una xarxa fenològica a Espanya. De la mateixa època figuren certs registres per Catalunya i les Balears, fruit de nombroses iniciatives regionals. No és, però, fins el període 1921-1939 que es durà a terme el primer registre sistemàtic gràcies al Servei Meteorològic de Catalunya (SMC). La densa xarxa meteorològica constituïda en aquella època a Catalunya va incorporar la fenologia, amb especial atenció a les plantes i seguint una metodologia molt similar a la que ja es practicava a d’altres països. Únicament el llistat d’espècies es va haver d’adaptar a les peculiaritats florístiques i faunístiques de la regió mediterrània. Malauradament la major part de tota aquesta informació recollida pel SMC juntament amb els registres previs que custodiava en els seus arxius va desaparèixer durant la guerra civil. De tota manera, els registres que han perdurat han permès demostrar que les dates d’arribada eren similars a les actuals. Això, però, no hauria de disminuir gens la nostra preocupació
44
General Synthesis
davant de l’actual canvi climàtic pel que fa als ocells i, en general, pel que fa a la biodiversitat de regions mediterrànies. L’any 1942 l’antic Servicio Meteorológico Nacional (SMN), actual Instituto Nacional de Meteorología (INM), va fer una crida en busca de voluntaris per tal d’encetar una xarxa fenològica a Espanya. L’any següent es van distribuir les normes d’observació i el llistat d’espècies entre els primers voluntaris, molts d’ells vinculats ja al SMN encarregant-se d’estacions meteorològiques. Fins i tot, molts observadors de l’antic SMC van passar ara a formar part del SMN. La metodologia proposada i el llistat d’espècies van ser pràcticament idèntics a l’utilitzat pel SMC i, per tant, al d’altres països. La xarxa encara funciona seguint les mateixes regles, fet fonamental per mantenir l’homogeneïtat de les dades acumulades durant seixanta anys. Als pocs anys d’iniciar-se la xarxa ja comptava amb centenars d’observadors (Fig. B), que han anat decreixent poc a poc d’ençà llavors. Paral·lelament a la xarxa fenològica del SMN, l’any 1970 la Sociedad Española de Ornitología (SEO) va crear la Comisión de Fenología, amb l’objectiu de coordinar i organitzar totes les dades fenològiques que ornitòlegs d’arreu d’Espanya enviaven a SEO. Tot i que aplega dades per a multitud d’espècies li manca el funcionament sistemàtic i estandarditzat de la xarxa fenològica del INM. La tasca principal del SMN, primer, i del INM, després, des que es va fundar la xarxa fenològica ha estat emmagatzemar i classificar les dades rebudes. Qualsevol pot ser observador d’aquesta xarxa, simplement ho ha de sol·licitar a la delegació regional del INM que li correspon pel seu lloc de residència. Un cop donat d’alta, l’observador rep una llibreta per a les anotacions fenològiques, una guia de les espècies a observar i els formularis necessaris per tal d’enviar les seves observacions per correu. Aquests formularis s’han d’enviar mensualment a les delegacions, des d’on es reenvien cap a la seu central del INM. Els formularis contenen informació bàsica com ara: localitat, província, nom de l’observador, mes, any, i la data quan es va produir un cert esdeveniment fenològic per a cadascuna de les espècies. Cada esdeveniment fenològic té un formulari concret. Quan aquestes dades arriben
Resum
45
finalment a la seu central, es transcriuen bé a paper (com fins el 1988) o s’informatitzen (com des d’ençà llavors). Aquest funcionament tan jeràrquic converteix el processat de les dades en quelcom lent on hi poden haver errors per culpa de la transcripció tants cops de les dades. La present tesi constitueix el primer intent real d’analitzar en profunditat tota la informació emmagatzemada pel INM durant els darrers seixanta anys. Fins el moment aquestes dades han estat poc explotades. Anualment des de 1943 s’han publicat uns mapes d’isofenes molt grollers per a unes poques fases molt concretes en el “Calendario Meteoro-Fenológico” (anomenat des de 1982 “Anuario Meteorológico”) i en les “Observaciones Meteoro-Fenológicas”. També el mateix INM va publicar un parell de llibres que no eren res més que una interminable llista amb les millors localitats de la xarxa i les dates més primerenques, més tardanes i mitjanes observades per a certes fases juntament amb mapes d’isofenes. La base de dades que ha resultat dels arxius del INM per al període 1944-2004 conté un total de 44037 registres d’arribades i emigracions en 1395 localitats per a cinc espècies: cigonya blanca Ciconia ciconia, cucut Cuculus canorus, falciot Apus apus, oreneta vulgar Hirundo rustica i rossinyol Luscinia megarhynchos. Existeixen a més uns altres 8900 registres més que pertanyen a vàries espècies tant trans-Saharianes com hivernants principalment per al període 1988-2004. Aquestes cinc espècies constitueixen un grup reduït però molt heterogeni. La cigonya blanca es troba àmpliament distribuïda per tota Europa, l’Àfrica del Nord i l’Orient Mitjà. Es poden distingir dos grans grups segons la seva ruta migratòria: occidental (migren per Gibraltar i hivernen a l’Àfrica occidental) i oriental (migren pel Bòsfor i hivernen a l’Àfrica oriental). És una espècie molt antropòfila tant pel que fa a la nidificació com als hàbitats preferits per alimentar-se. De caire molt gregari, se la troba alimentant-se en grups, niant en colònies i migrant cap als quarters d’hivernada en estols. Fa una posta de 2 a 6 ous l’any ja des de finals de Març. Tres mesos després de pondre volen els polls. La seva dieta varia segons les disponibilitats de cada lloc i moment, però inclou tota mena d’animals de mida petita i mitja (des de cucs
46
General Synthesis
fins a rosegadors). Selecciona preferentment hàbitats oberts amb pastures i cultius prop de zones humides on abunden les seves preses. Les poblacions ibèriques i del Magrib del cucut constitueixen una subspècie apart. El seu cant inconfusible es pot sentir a qualsevol mena d’hàbitat forestal de la Península Ibèrica. Per contra, la seva distribució i comportament hivernals són molt desconeguts degut als seus hàbits reservats i la dificultat de distingir-lo de l’espècie africana Cuculus gularis. La seva reproducció de tipus parasític ha estat tradicionalment de molt interès. Les femelles posen els ous en els nius d’altres espècies que s’encarregaran de criar el polls de cucut. A les poques hores d’eclosionar el poll de cucut fa fora del niu la resta d’ous o polls per tal de rebre tota l’atenció. El poll de cucut continuarà essent alimentat pels pares adoptius moltes setmanes després de deixar el niu. La migració de tardor comença ja a l’Agost, amb els adults precedint els joves. La seva distribució entre hàbitats està fortament condicionada per la presència dels seus hostes i d’una abundant font d’aliment, especialment erugues. És rara la localitat ibèrica on no hi niï el falciot. Això és degut a l’enorme oferta de llocs per nidificar que ofereixen per aquesta espècie les infrastructures humanes. No hi ha cap mena de dada per a les àrees d’hivernada de les poblacions espanyoles, tot i que les recuperacions per d’altres poblacions europees assenyalen a països com Zaire, Tanzània, Zimbabwe i Moçambic. També hi ha registres hivernals d’individus per tota l’Àfrica occidental. És una espècie molt gregària durant tot l’any. És molt comú veure estols alimentant-se de plàncton aeri sobre es mateixos pobles i ciutats on nidifica. Es passa gairebé tota la seva vida volant. El mal temps provoca fuites de saó que poden implicar vols de centenars de quilòmetres. Els falciots fan una sola posta de 1 a 4 ous. Els joves deixen el niu al cap de 2 mesos, podent-se retardar fins a 3 en cas que hi hagi hagut mal temps durant el període de cria que hagi dificultat la seva alimentació. L’emigració cap als quarters d’hivernada es produeix tot just després que els joves deixen el niu. L’oreneta vulgar és una de les espècies més abundants i àmpliament distribuïdes de tot el Paleàrtic. En el cas de la Península Ibèrica se la pot trobar
Resum
47
niant també arreu. Se l’ha trobat hivernant arreu d’Àfrica al sud del Sàhara, tot i que alguns individus romanen a l’hivern al sud d’Espanya. La principal àrea d’hivernada de les poblacions espanyoles és als països del Golf de Guinea. Les orenetes ocupen tota mena d’hàbitats, tot i que tenen preferència per les pastures, els prats i els cultius, sense estar mai gaire lluny d’alguna infrastructura humana que els hi proporcioni un lloc per fer el niu. Aquesta espècie depèn completament dels insectes aeris per a la seva alimentació, que captura volant a poca alçada prop de la superfície. Sol fer dues postes de entre 2 i 7 ous des del mes de Març. El polls deixen el niu entre 4 i 6 setmanes més tard, tot i que els pares tindran cura d’ells durant algunes setmanes més. També és un ocell molt gregari fora de l’època de cria, constituint enormes concentracions per dormir tant durant la migració post-nupcial com un cop als quarters d’hivernada. El rossinyol se’l pot trobar per tota la Península Ibèrica, essent cada cop més escàs conforme ens apropem a la regió Cantàbrica. Les poblacions europees occidentals hivernen en la franja delimitada entre el Sàhara i la selva plujosa que va des de l’Atlàntic fins Uganda. Aquí freqüenta la sabana, els matollars espinosos, els marges i clarianes del bosc humit, i les formacions arbustives i herbàcies de les riberes del cursos d’aigua. Els mascles defensen els seus territoris tant a les àrees de cria com de hivernada mitjançant el seu potent i divers cant, que esdevé l’única manera de detectar la presència d’una espècie tan amagadissa. És una espècie principalment solitària. Els mascles són fidels any rera any al mateix territori de cria. Sempre seleccionen llocs amb bona cobertura de bardisses o qualsevol altra mena d’arbust sempre que sigui dens en àrees dominades per mosaics de vegetació natural i cultius, en boscos de ribera, en pastures o fins i tot en parcs urbans. El cant diürn serveix per interactuar amb d’altres mascles, mentre que el més popular cant nocturn per atreure les femelles. Fa dues postes de entre 2 i 6 ous, amb els joves deixant el niu en menys d’un mes. S’alimenta d’invertebrats terrestres, especialment escarabats i formigues, tot i que al final de l’estiu també de petits fruits i baies. El pas post-nupcial principal és entre finals d’Agost i finals de Setembre.
48
General Synthesis
Objectius Els principals eixos que han guiat aquesta tesi han estat tres: patrons espacials, tendències temporals i els factors subjacents a ambdós. Aquests han estat tractats en cinc capítols on s’han acomplert els següents objectius: 1.
Descriure la variabilitat espacial observada en Espanya pel que fa a la fenologia de les cinc espècies. (Capítol 1, 2 i 3).
2.
Determinar les variables ambientals capaces de modelar de la millor manera els patrons anteriors. (Capítol 1, 2 i 3).
3.
Oferir una interpretació sota una perspectiva de l’ecologia evolutiva dels factors prèviament obtinguts tenint en compte les característiques de cada espècie i determinar en conseqüència l’existència de regles en comú per a la migració a través de la Península Ibèrica. (Capítol 1, 2 i 3).
4.
Determinar l’existència de tendències temporals significatives cap a l’avançament o ajornament de les dates d’arribada i emigració així com de la durada total de les estades a les cinc espècies estudiades per al conjunt de la Península. (Capítol 4).
5.
Avaluar la influència del canvi climàtic en aquestes tendències. (Capítol 4, 5 i 6)
6.
Determinar l’efecte de les fluctuacions interannuals en les condicions de les àrees d’hivernada, pas i reproducció en la fenologia migratòria. (Capítol 4, 5 i 6).
Resultats i Discussió L’estructura espacial de les arribades del falciot i l’oreneta vulgar va ser molt més clara que en la resta d’espècies estudiades (Fig. 1.1), amb els primers individus arribant al sud-oest de la península i després progressant cap al nord-est. Aquesta progressió només queda interrompuda per les regions muntanyoses del Sistema Central i Ibèric on l’arribada és la més tardana. A la resta de casos, una inspecció visual va oferir patrons poc clars (Figs. 2.1 i 6.1a). L’absència aparent d’una estructura espacial forta es va confirmar amb l’escassa capacitat explicativa dels models. Això no pot atribuir-se ni al tipus de
Resum
49
variables emprat ni a un menor nombre de localitats en aquests altres casos. Tot i això, es van poder treure una sèrie de regles generals per a la colonització primaveral de la Península Ibèrica: •
Arribada més tardana a localitats de més al nord i a més altitud.
•
Arribada més primerenca a les zones més seques durant l’estiu.
•
Arribada més tardana a aquelles localitats llunyanes de l’Estret de Gibraltar i amb una ruta costosa per arribar-hi.
•
El quadrant sud-oest de la Península és la zona més primerenca, mentre que la conca del Túria és la més tardana.
•
Les variables climàtiques van tenir la millor capacitat explicativa entre tots els tipus de variables ambientals.
Aquestes regles generals per a la colonització de la Península Ibèrica són especialment òbvies en els models finals del falciot i l’oreneta vulgar (Taules 1.2 i 1.3). Els dos van incloure gairebé les mateixes variables, van tenir gairebé les mateixes capacitats explicatives i, en conseqüència, van produir mapes gairebé iguals per a les arribades primaverals (Fig. 1.6). Per tant, es pot concloure que a espècies com el falciot i l’oreneta vulgar (especialitzades en alimentar-se d’insectes aeris) l’ambient juga un paper molt fort a l’hora de determinar els patrons migratoris. La migració a través d’Espanya no és igualment probable en totes les direccions un cop que es creua l’Estret de Gibraltar. Hi ha rutes òptimes amb el menor cost per arribar a un cert lloc, i aquestes rutes poden ser molt més llargues que un vol recte directe (Fig. 1.3). Aquest fet explica perquè el sud-est de la Península es colonitza molt més tard del que seria d’esperar en funció de les seves condicions climàtiques i proximitat a l’Estret. Per tant, la configuració immutable de la Península limita els patrons migratoris d’aquestes dues espècies. En el cas de l’inici del cant en el cucut i el rossinyol, els millors models finals van explicar de l’ordre del 27 % de la variabilitat (Taula 2.2). Aquesta escassa capacitat de predicció podria ser deguda a que l’inici del cant és un fenomen que pot veure’s influenciat per d’altres decisions individuals que depenen de les condicions ambientals de l’àrea de reproducció un cop que
50
General Synthesis
l’individu ja ha arribat. Per exemple, la densitat de població va ser una variable important, especialment en el cas del cucut, tot i que el seu efecte va ser oposat al que caldria esperar, és a dir, més tard a les zones més poblades. Això podria ser resultat del tipus de reproducció d’aquesta espècie. A les zones amb menys parelles per ser parasitades hi hauria més competència intraspecífica i, per tant, les pressions selectives a favor d’arribades primerenques serien més grans. Els millors models per al cucut i el rossinyol van oferir patrons diferents (Fig. 2.3). Segons les dates d’inici del cant, el cucut colonitza la major part d’Espanya a una primera i més primerenca onada migratòria, mentre que el rossinyol ho fa en la segona i més tardana. Per tant, el component migratori específic sembla molt més important que les potencials limitacions ambientals, ja que ambdues espècies migren a través de la Península durant dates similars i, per tant, s’enfronten a un escenari ecològic similar. En la cigonya blanca va ser possible la comparació dels patrons obtinguts entre les tres variables analitzades: arribada, emigració i estada. Una ullada als mapes interpolats (Fig. 3.1) indica una absència de patrons espacials forts. La conspicuïtat d’aquesta espècie fa difícil atribuir aquesta absència de patrons a la imprecisió de les dates registrades. El millor model per a les arribades va explicar un 34 % de la variabilitat entre localitats. Les cigonyes arriben més tard a les localitats del nord i est amb estius més plujosos. Per tant, aquesta espècie tot i ser gran i planadora també mostra aquest eix sudoestnorest de progressió. També va a arribar abans a les zones amb més densitat de nius (Fig. 3.3). Això probablement és degut a la competència per la seva ocupació. Els patrons espacials de les dates d’emigració i de la durada de l’estada van ser molt pobres. L’absència d’autocorrelació espacial als residus dels models finals (Fig. 3.4), així com va passar a la resta d’espècies (Fig. 1.5 i 2.2), significa que no es va passar per alt cap variable ambiental amb estructura espacial. Per tant, cap altre variable, a la nostra escala de treball, podria ajudar a millorar els models obtinguts en totes les espècies. L’emigració està molt influenciada per comportaments socials que depenen probablement més aviat
Resum
51
de decisions col·lectives fruit de les condicions peculiars trobades a nivell local cada any que no pas de gradients macrogeogràfics. Pel que fa a les estades, es van modelar bé mitjançant les dates mitges d’arribada i, especialment, les d’emigració del mateix UTM. L’índex d’aridesa i la precipitació de l’estiu van ser les úniques variables climàtiques incloses en els models de la cigonya blanca. De fet, el clima a l’estiu va aparèixer repetidament com un dels elements predictius més importants dels patrons espacials en tots els casos (Fig. 1.4). Aquestes variables juntament amb l’índex d’aridesa estan íntimament relacionades a la productivitat durant l’estació més desfavorable a les regions mediterrànies, l’estiu, el que suggereix que a les poblacions mediterrànies d’aus transsaharianes les condicions limitants de l’estiu podrien estar modulant els diferents estadis del cicle vital de la resta de l’any. Les primeres arribades van mostrar tendències temporals significatives en totes les espècies durant el període d’estudi (1944-2004), amb excepció del rossinyol Luscinia megarhynchos (Fig. 4.1). La cigonya blanca Ciconia ciconia arriba uns 30 dies abans que tot just fa 20 anys, el que suposa l’avançament més notori. El falciot Apus apus i l’oreneta vulgar Hirundo rustica van tenir fluctuacions temporal similars (Fig. 4.1), amb arribades més tardanes fins a mitjans del anys 70 i avançament de les mateixes des de llavors. El cucut Cuculus canorus i el rossinyol van cantar per primer cop sempre durant les dues primeres setmanes d’Abril (Fig. 4.1). El cucut va tendir a cantar més tard fins a començament dels anys 80, mentre que de les hores ençà ha tendit a cantar més d’hora. Les quatre espècies amb tendències temporals a les seves dates d’arribada han mostrat en tots els casos una tendència a avançar-se en les darreres dècades (Taula 4.1). Aquest fet coincideix amb d’altres estudis que han demostrat l’existència de canvis en relació al canvi climàtic, especialment pel que fa a l’increment de les temperatures. Pel que fa a la cigonya blanca, per entendre el seu avançament cal tenir present l’augment d’individus hivernants als últims anys. Aquest canvi en la conducta migratòria probablement ha estat degut a la disponibilitat d’aliment durant l’hivern gràcies als abocadors i a
52
General Synthesis
l’expansió del cranc de riu americà Procambarus clarkii. Hiverns més temperats durant l’última dècada també han pogut ajudar a la supervivència hivernal dels individus sedentaris. Pel que fa a les altres tres espècies, l’avançament enregistrat durant les últimes dècades s’interpretaria millor com una tornada a les dates normals de migració després d’un període d’arribades tardanes durant els anys 70 i 80. De fet, les dates actuals són similars a les que s’havien vist als anys 40. En el cas particular del falciot i l’oreneta vulgar el retard tan fort que es va produir durant els anys 1970 a 1972 va ser degut a l’efecte sinèrgic d’unes condicions climàtiques excepcionals tant a les àrees de cria com d’hivernada. Hiverns extremadament secs al Sahel van ser seguits de primaveres molt fredes a Espanya. Cal destacar el fet que després d’aquests tres anys han calgut gairebé dues dècades per tornar a les dates prèvies d’arribada, el que podria ser una prova de les conseqüències tan greus que poden tenir els esdeveniments climàtics puntuals però extrems. L’emigració de tardor de la cigonya blanca, el falciot i l’oreneta vulgar va presentar fluctuacions interdecadals comunes (Fig. 4.2). Totes les espècies van tendir a marxar abans fins a mitjans dels 60, després es van retardar any rera any fins els 80, i des de llavors han tendit un altre cop a avançar-se. Aquestes fluctuacions van ser, però, només significatives en el cas de l’oreneta vulgar (Taula 4.1). La durada de l’estada, definida com el nombre de dies transcorreguts entre el primer i últim individus detectats en una certa localitat i any, va mostrar totes les respostes possibles en les tres espècies anteriors (Fig. 4.3). Ha incrementat notablement en la cigonya blanca, no ha variat en el falciot, i s’ha reduït a l’oreneta vulgar. Aquesta heterogeneïtat és el resultat de les tendències temporals peculiars a l’arribada i emigració de cadascuna de les espècies. Donades aquestes respostes tan específiques i les potencials implicacions que pot tenir per a la supervivència i èxit reproductiu qualsevol canvi en aquest paràmetre, caldria parar més atenció en aquesta fase en estudis futurs.
Resum
53
Els resultats obtinguts en els Capítols 4, 5 i 6 assenyalen al clima com al mecanisme
responsable
més
probable
de
les
fluctuacions
temporals
esmentades en la fenologia migratòria de les aus estudiades. En el Capítol 5 l’arribada de sis espècies per a una localitat catalana (Cardedeu) es va associar sempre amb el clima d’Àfrica en comptes del clima d’aquesta mateixa localitat. Totes les espècies van retardar la seva arribada des de 1952 (Fig. 5.3), en contra del que la majoria d’estudis previs han demostrat. Aquest canvi sembla contra-adaptatiu doncs la resta de fenofases primaverals sí es van avançar com a resultat de l’increment de temperatures. Els models de regressió finals per a totes les espècies van incloure les pluges a l’Àfrica, especialment aquelles de les regions occidentals del continent (Taula 5.2). A més en la majoria de casos l’efecte va ser de les variables definides com a llarg termini, es a dir durant els dotze mesos abans de l’inici de la migració pre-nupcial (Taula 5.1). Aquest estudi suggereix que la variabilitat climàtica als quarters d’hivernada hauria de considerar-se com un factor que pot afectar les arribades aquí, ja que els ocells només poden ajustar la seva migració en funció de les condicions que es troben en el moment d’iniciar-la o durant la seva progressió però en cap cas en funció de les condicions del lloc on han d’arribar. L’efecte de l’Àfrica cal esperar que sigui especialment notable al sud d’Europa on els ocells arriben tot just després de creuar el desert del Sàhara. Quan es van analitzar les sèries temporals per a tota Espanya (Capítol 4), es van obtenir relacions significatives tant amb les temperatures de la Península Ibèrica com les precipitacions de l’àrea del Sahel (Taula 4.2). Aquestes dues variables tot i ser tan generals són una bona mesura de les condicions ambientals de les àrees de cria i hivernada, respectivament. Primaveres càlides faciliten arribades més primerenques gràcies a que la primavera està més avançada a les àrees de cria incrementant les possibilitats d’alimentar-se i sobreviure pels individus més primerencs així com d’una progressió més ràpida a través de la península. Hiverns precedits per una estació plujosa a l’Àfrica amb poca precipitació és van associar amb arribades tardanes a la següent primavera a la Península Ibèrica en vàries espècies (Fig. G).
54
General Synthesis
Els factors que potencialment poden afectar durant la hivernada i migració a l’arribada de les aus a les seves àrees de cria són massa nombrosos com per a ser avaluats mitjançant correlacions amb mesures tan grolleres (tot i que vàlides) com l’Índex del Sahel. A més, el potencial efecte de les àrees de pas nord-africanes no s’havia avaluat. El potencial efecte de les àrees de pas i hivernada es va avaluar en el Capítol 6 mitjançant mesures per satèl·lit del NDVI. Els resultats obtinguts estan d’acord amb les conclusions prèviament obtingudes en el Capítol 4 i 5. La cigonya blanca, el cucut i l’oreneta vulgar es van relacionar amb el NDVI de les àrees d’hivernada (Taula 6.2). Les aus arriben abans després d’hiverns amb més producció vegetal als quarters d’hivernada. En el cas de la cigonya blanca, no s’havia trobat efecte de l’Índex del Sahel. El cant del rossinyol tampoc es va veure afectat en aquest cas per cap variable ambiental. Aquest fet juntament amb l’absència de tendències temporals suggereix que la migració i inici del cant en aquesta espècie podrien estar fortament controlats per ritmes endògens. L’estudi dut a terme en el Capítol 6 demostra la importància d’una bona selecció de les variables emprades per tal d’avaluar els efectes de les condicions ecològiques sobre la fenologia migratòria dels ocells. El nombre de variables ambientals que es poden arribar a incloure en els anàlisis és virtualment infinit i, per tant, es veuen incrementats els riscos de correlacions significatives per atzar i la producció de resultats pseudo-replicatius. S’haurien de tenir en compte només certs tipus de variables durant certs períodes de l’any i amb una clara hipòtesi funcional al seu darrera per a les espècies estudiades. Els resultats obtinguts als Capítols 4, 5 i 6 confirmen estudis previs pel que fa a la influència de les àrees d’hivernada. Valor baixos de l’Índex del Sahel estan associats a valors baixos del NDVI perquè en zones àrides com el Sahel la producció vegetal està limitada per la disponibilitat d’aigua. Unes condicions ecològiques pobres als quarters d’hivernada poden reduir la supervivència dels individus, empitjorar la qualitat de les plomes mudades i dificultar l’adquisició de la condició corporal necessària prèvia a la migració. Menys individus, amb pitjor plomatge, amb poques reserves de greix poder afectar negativament la
Resum
55
detecció dels primers individus (Fig. 6.1), ja que hi ha menys probabilitats d’observar individus molt primerencs, hi ha menys competència entre els mascles per arribar d’hora, la capacitat de vol és pitjor, i el nombre i/o durada dels stopovers previs haurà d’incrementar-se. L’emigració va estar poc afectada pel clima (Taula 4.2). Aquest resultat va ser inesperat puix van haver clares fluctuacions interdecadals durant el període d’estudi (Fig. 4.2). L’element que millor va predir les dates d’emigració va ser la temperatura durant l’època de cria, fet que suggereix alguna mena d’efecte a llarg termini de les condicions climàtiques a través de les fases intermèdies del cicle vital. De tota manera, és difícil oferir hipòtesis alternatives quan els canvis observats en les dates d’emigració estan dèbilment relacionades, o fins i tot no ho estan (cas del falciot), amb les variables climàtiques. Per tant, els resultats per a les poblacions ibèriques en conjunt no ajuden a aclarir els resultats heterogenis que ja s’havien trobat al respecte en estudis anteriors. Aquesta absència d’un efecte palès del canvi climàtic sobre les tendències temporals a les dates d’emigració podria ser el reflex d’algunes característiques intrínseques poc favorables d’aquesta mesura: 1) Hi ha barrejats individus juvenils amb adults, mascles i femelles; 2) No existeix una urgència tan gran per arribar als quarters d’hivernada; 3) Són més probables les confusions entre individus locals i individus en pas; 4) És un fenomen menys conspicu. Conclusions 1.
Les xarxes fenològiques de voluntaris constitueixen una metodologia vàlida per obtenir dades amb les que avaluar la variabilitat espacial i temporal de la migració de les aus.
2.
Els patrons de colonització primaveral van seguir sempre un eix sudoestnordest, amb arribades més tardanes al nord, a localitats més elevades, amb estius més plujosos i llunyanes de Gibraltar. Per tant, la configuració de la Península Ibèrica marca en trets molt generals la colonització a les espècies estudiades.
56
3.
General Synthesis
El falciot i l’oreneta vulgar van tenir patrons de colonització, tot i migrar en diferents períodes, molt similars. Aquestes similituds van ser donades per la seva dependència de factors ambientals fixos que limiten la migració en espècies amb morfologia, requeriments ecològics i tipus de vol com el seu.
4.
Per contra, el cucut i el rossinyol van tenir patrons diferents en l’inici del cant, tot i migrar durant el mateix període i, per tant, estar sotmesos a influències ambientals similars. Aquestes diferències són degudes a les peculiaritats específiques en la biologia i ecologia d’ambdues espècies. Per altra banda, l’inici del cant pot estar influenciat per d’altres factors que actuen sobre les decisions individuals de quan cantar.
5.
La colonització primaveral de la cigonya blanca segueix les regles generals, mentre que els patrons d’emigració i estada van estar escassament estructurats espacialment. La durada de l’estada depèn més de la data a la qual els individus decideixen marxar.
6.
Les aus trans-Saharianes van mostrar fluctuacions significatives interdecadals a la seva fenologia migratòria durant els darrers 60 anys. El cucut, el falciot, l’oreneta vulgar i el rossinyol arriben actualment a dates similars a les registrades als anys 40. Per tant, l’avançament que s’ha produït des dels 70 cal veure’l com una tornada a les dates inicials després d’un període de retard.
7.
L’avançament enorme observat en la cigonya blanca (40 dies) s’ha d’interpretar tenint en compte la tendència observada en els darrers anys cap a la sedentarització de les poblacions ibèriques.
8.
El clima de les àrees d’hivernada i cria va afectar l’arribada. Hiverns humits a les regions àrides de l’Àfrica occidental i primaveres càlides a Espanya
es
van
associar
repetidament
amb
arribades
més
primerenques. El canvi climàtic és, per tant, el responsable més
Resum
57
probable d’aquestes tendències temporals. La fenologia s’ha d’incloure com un bioindicador del canvi climàtic també en regions mediterrànies. 9.
Els patrons tant espacials com temporals per a la migració de tardor van ser menys clars i pitjor modelats en tots els casos. Aquesta fase mereix més atenció.
10. Un anàlisi detallat per a cinc espècies trans-Saharianes suggereix que els patrons espacials i temporals per a la fenologia migratòria són molt més complexos del que s’havia proposat.
58
General Synthesis
REFERENCES Ahas R, Aasa A, Menzel A, Fedotova VG, Scheifinger H (2002) Changes in European spring phenology. International Journal of Climatology, 22, 1727-1738. Ahola M, Laaksonen T, Sippola K, Eeva T, Rainio K, Lehikoinen E (2004) Variation in climate warming along the migration route uncouples arrival and breeding dates. Global Change Biology, 10, 1610-1617. Alerstam T, Hedenström A, Åkesson S (2003) Long-distance migration: evolution and determinants. Oikos, 103, 247-260. Alonso JA, Alonso JC, Carrascal LM, Muñoz Pulido R (1994) Flock size and foraging decisions in central place foraging white storks, Ciconia ciconia. Behaviour, 129, 279-292. Amrhein V, Korner P, Naguib M (2002) Nocturnal and diurnal singing activity in the nightingale: correlations with mating status and breeding cycle. Animal Behaviour, 64, 939-944. Anonymous (1942) Las observaciones fenológicas, indicaciones para su implantación en España. Sección de Climatología – Servicio Meteorológico Nacional, Madrid Anonymous (1943) Atlas de plantas para las observaciones fenológicas. Sección de Climatología – Servicio Meteorológico Nacional, Madrid. Anonymous (1982) La fenología de aves para España. Sección de Meteorología Agraria y Fenología – Instituto Nacional de Meterología, Madrid. Anonymous (1983) Algunas fases fenológicas del almendro, vid, abeja y mariposa de la col en España. Sección de Meteorología Agraria y Fenología – Instituto Nacional de Meterología, Madrid. Anonymous (1989) Normas e instrucciones para las observaciones fenológicas. Sección de Meteorología Agraria y Fenología – Instituto Nacional de Meterología, Madrid. Bairlein F, Winkel W (2001) Birds and climate change. In: Climate of the 21st Century: Changes and Risks (eds Lozan JL, Graßl H, Hupfer P), pp. 278-282. Scientific Facts, GEO, Hamburg. Barrett RT (2002) The phenology of spring bird migration to north Norway. Bird Study, 49, 270277. Bermejo A, De la Puente J, Pinilla J (2002) Fenología, biometría, y parámetros demográficos del zarcero común (Hippolais polyglotta) en España central. Ardeola, 49, 75-86. Bernis F (1959) La migracion de la cigüeñas españolas y de las otras cigüeñas 'occidentales'. Ardeola, 5, 9-80. Bernis F (1962) Del noticiero fenológico 1961 y 1962 selección de aves migrantes y estivales. Ardeola, 8, 151-188. Bernis F (1966) Aves migradoras ibéricas. Vol. I, Fasc. 1º - 4º. Sociedad Española de Ornitología, Madrid. Bernis F (1967) Aves migradoras ibéricas. Vol. I, Fasc. 5º. Sociedad Española de Ornitología, Madrid. Bernis F (1970) Aves migradoras ibéricas. Vol. II, Fasc. 6º. Sociedad Española de Ornitología, Madrid. Bernis F (1971) Aves migradoras ibéricas. Vol. II, Fasc. 7º - 8º. Sociedad Española de Ornitología, Madrid. Bernis F (1973) Migración de Falconiformes y Ciconia spp. Por Gibraltar, verano otoño 19721973. Primera parte. Ardeola, 19, 151-224. Berthold P (1996) Control of bird migration. Chapman & Hall, London.
References
59
Bezzel E, Jetz W (1995) Verschiebung der Wegzugperiode bei der Monchsgrasmucke (Sylvia atricapilla) 1966-1993 – Reaktion auf die Klimaerwarmung. Journal für Ornithologie, 136, 83-87. Boano G, Bonardi A, Silvano F (2004) Nightingale Luscinia megarhynchos survival rates in relation to Sahel rainfall. Avocetta, 28, 77-85. Bojarinova JG, Rymkevich TA, Smirnov OP (2002) Timing of autumn migration of early and latehatched Great Tits Parus major in NW Russia. Ardea, 90, 401-409. Bosch S, Fiedler W (2002) Absturz mit leerem Magen: Mauersegler Apus apus waeherend einen Schlechtwetterperiode im Juli 2000 am Bodensee. Ornithologische Mitteilungen, 55, 244-248. Both C, Bijlsma RB, Visser M (2005) Climatic effects on timing of spring migration and breeding in a long-distance migrant, the pied flycatcher Ficedula hypoleuca. Journal of Avian Biology, 36, 368-373. Both C, Visser ME (2001) Adjustment to climate change is constrained by arrival date in a longdistance migrant bird. Nature, 411, 296-298. Boyd H (2003) Spring arrival of passerine migrants in Iceland. Ringing & Migration, 21, 193-201. Bradley NL, Leopold AC, Ross J, Huffaker W (1999) Phenological changes reflect climate change in Wisconsin. Proceedings of the National Academy of Sciences USA, 96, 97019704. Browne SJ, Aebischer NJ (2003) Temporal changes in the migration phenology of turtle doves Streptopelia turtur in Britain, based on sightings from coastal bird observatories. Journal of Avian Biology, 34, 65-71. Butler CJ (2003) The disproportionate effect of global warming on the arrivals dates of shortdistance migratory birds in North America. Ibis, 145, 484-495. Cannell MGR, Palutikof J, Sparks TH (1999) Indicators of climate change in the UK. Department of the Environment, Transport and the Regions, London. Carrascal LM, Bautista LM. Lázaro E (1993) Geographical variation in the density of the white stork Ciconia ciconia in Spain - influence of habitat structure and climate. Biological Conservation, 65, 83-87. Cliff AD, Ord JK (1981) Spatial Processes. Models and Applications. Pion, London. Collison N, Sparks TH (2003) The science that redefines the seasons. Recent results from the UK Phenology Network. British Wildlife, 14, 229-232. Comas P (1999) Avançament de la primavera i ajornament de la tardor. Ajuntament de Cardedeu, Cardedeu. Coppack T, Both C (2003) Predicting life-cycle adaptation of migratory birds to global climate change. Ardea, 90, 369-377. Cotton PA (2003) Avian migration phenology and global climate change. Proceedings of the National Academy of Sciences USA, 100, 12219-12222. Crick HQP (2004) The impact of climate change on birds. Ibis, 146, 48-56. Crick HQP, Dudley C, Glue DE, Thomson DL (1997) UK birds are laying eggs earlier. Nature, 388, 527-527. Curry-Lindahl K (1963) Roosts of Swallows (Hirundo rustica) and House Martins (Delichon urbica) during the migration in Tropical Africa. Ostrich, 34, 99-101. Czyżowicz W, Konieczny K (2001) Terminy przylotów i odlotów wybranych gatunków ptaków w okolicach wsi Brzózka (powiat Wolów) w latach 1947-1985. Ptaki Slaska, 13, 126-129. Dai A, Lamb PJ, Trenberth KE, Hulme M, Jones PD, Xie PP (2004) The recent Sahel drought is real. International Journal of Climatology, 24, 1323-1331.
60
General Synthesis
Dallinga JH, Schoenmakers S (1987) Regional decrease in the number of white storks (Ciconia c. ciconia) in relation to food resources. Colonial Waterbirds, 10,167-177. Defila C, Clot B (2001) Phytophenological trends in Switzerland. International Journal of Biometeorology, 45, 203-207. Donnelly A, Jones MB, Sweeney J (2004) A review of indicators of climate change for use in Ireland. International Journal of Biometeorology, 49, 1-12. EEA (2004) Impacts of Europe's changing climate. An indicator-based assessment. European Environment Agency, Copenhagen. Ellegren H (1990) Timing of autumn migration in bluethroats Luscinia svecica svecica depends on timing of breeding. Ornis Fennica, 67, 13-17. Fernández-Cruz M, Sáez-Royuela R (1969) Comisión de fenología: encuesta sobre primeras llegadas y paso primaveral (año 1970). Ardeola, 15, 51-78. Fiedler W (2001) Large-scale ringing recovery analysis of European White Storks (Ciconia ciconia). Ring, 23, 73-79. Fischer S, Witt K (2002) Arrival dates of migrating songbirds in Berlin over a 26 year period. Berliner Ornithologischer Bericht, 12, 145-166. Fontseré E, Campany M (1936) Primers resultats del conjunt de les observacions fenològiques a Catalunya. Notes d'Estudi, 63, 191-227. Foppen R, ter Braak CJF, Verboom J, Reijnen R (1999) Dutch Sedge Warblers Acrocephalus schoenobaenus and West-African rainfall: empirical data and simulation modelling show low population resilience in fragmented marshlands. Ardea, 87, 113-127. Forchhammer MC, Post E, Stenseth NC (2002) North Atlantic Oscillation timing of long- and short-distance migration. Journal of Animal Ecology, 71, 1002-1014. García-Pertierra M, Pallarés M (1991) Atlas de plantas y aves para las obsevaciones fenológicas. Instituto Nacional de Meterología, Madrid. Gatter W (1992) Zugzeiten und Zugmuster im Herbst: Einfluß des Tribhauseffekts auf den Vogelzug? Journal für Ornithologie, 133, 427-436. Gilyazov A, Sparks TH (2002) Change in the timing of migration of common birds at the Lapland Nature Reserve (Kola Peninsula, Russia) during 1931-1999. Avian Ecology and Behaviour, 8, 35-47. Gómez-Tejedor H, De Lope F (1993) Sucesión fenológica de las aves no passeriformes en el vertedero de Badajoz. Ecología, 7, 419-427. Gordo O, Brotons L, Ferrer X, Comas P (2005) Do changes in climate patterns in wintering areas affect the timing of the spring arrival of trans-Saharan migrant birds? Global Change Biology, 11, 12-21. Gordo O, Sanz JJ (2005) Phenology and climate change: a long-term study in a Mediterranean locality. Oecologia, 146, 484-495. Gordo O, Sanz JJ (2006) Climate change and bird phenology: a long-term study for the Iberian Peninsula. Global Change Biology, 12, 1993-2004. Gordo O, Sanz JJ (2006) Temporal trends in phenology of the honey bee Apis mellifera (L.) and the small white Pieris rapae (L.) in the Iberian Peninsula (1952 - 2004). Ecological Entomology, 31, 261-268. Gwinner E (1996). Circadian and circannual programmes in avian migration. Journal of Experimental Biology, 199, 39-48. Gwinner E, Helm B (2003). Circannual and circadian contributions to the timing of avian migration. In: Avian migration (ed Berthold P, Gwinner E, Sonnenschein E), pp 81-95. Springer-Verlag, Berlin
References
61
Hameed S, Gong GF (1994) Variation of spring climate in lower-middle Yangtze-river valley and its relation with solar-cycle length. Geophysical Research Letters, 21, 2693-2696. Harrington R, Woiwod I, Sparks TH (1999) Climate change and trophic interactions. Trends in Ecology and Evolution, 14, 146-150. Herrmann SM, Anyamba A, Tucker CJ (2005) Recent trends in vegetation dynamics in the African Sahel and their relationship to climate. Global Environmental Change, 15, 394404. Hódar JA, Castro J, Zamora R (2003) Pine processionary caterpillar Thaumetopoea pityocampa as a new threat for relict Mediterranean Scots pine forests under climatic warming. Biological Conservation, 110, 123-129. Huin N, Sparks TH (1998) Arrival and progression of the swallow Hirundo rustica through Britain. Bird Study, 45, 361-370. Hüppop O, Hüppop K (2003) North Atlantic Oscillation and timing of spring migration in birds. Proceedings of the Royal Society of London-Series B, 270: 233-240. Hüppop O, Winkel W (2006) Climate change and timing of spring migration in the long-distance migrant Ficedula hypoleuca in central Europe: the role of spatially different temperature changes along migration routes. Journal of Ornithology, 147, 344-353. Inouye DW, Barr B, Armitage KB, Inouye BD (2000) Climate change is affecting altitudinal migrants and hibernating species. Proceedings of the National Academy of Sciences USA, 97, 1630-1633. Irby LH (1895) The ornithology of the Straits of Gibraltar. 2nd ed. Porter, London. Jenni L, Kéry M (2003) Timing of autumn bird migration under climate change: advances in long-distance migrants, delays in short-distance migrants. Proceedings of the Royal Society of London-Series B, 270, 1467-1471. Jonzén N, Lindén A, Ergon T, Knudsen E, Vik JO, Rubolini D, Piacentini D, Brinch C, Spina F, Karlsson L, Stervander M, Andersson A, Waldenström J, Lehikoinen A, Edvardsen E, Solvang R, and Stenseth NC (2006) Rapid advance of spring arrival dates in longdistance migratory birds. Science, 312, 1959-1961. Kaňuščák P, Hromada M, Tryjanowski P, Sparks TH (2004) Does climate at different scales influence the phenology and phenotype of the River Warbler Locustella fluviatilis? Oecologia, 141, 158-163. Keitt TH, Bjørnstad ON, Dixon PM, Citron-Pousty S (2002) Accounting for spatial pattern when modelling organism-environment interactions. Ecography, 25, 616-625. Klanderud K, Birks HJB (2003) Recent increases in species richness and shifts in altitudinal distributions of Norwegian mountain plants. The Holocene, 13, 1-6. Kolunen H, Peiponen VA (1991) Delayed autumn migration of the Swift Apus apus from Finland in 1986. Ornis Fennica, 68, 81-92. Koskimies J (1947) On movements of the Swift, Micropus a. apus L., during the breeding season. Ornis Fennica, 24, 106-111. Lack D (1958) The return and departure of swifts Apus apus at Oxford. Ibis, 100, 477-502. Lane RK, Pearman M (2003) Comparison of spring return dates of mountain bluebirds, Sialia currucoides, and tree swallows, Tachycineta bicolor with monthly air temperatures. Canadian Field-Naturalist, 117, 110-112. Ledneva A, Miller-Rushing AJ, Primack RB, Imbres C (2004) Climate change as reflected in a naturalist's diary, Middleborough, Massachusetts. Wilson Bulletin, 116, 224- 231. Legendre P, Legendre L (1998) Numerical ecology. 2nd ed. Elsevier, Amsterdam.
62
General Synthesis
Lehikoinen A, Sparks TH, Zalakevicius M (2004) Arrival and departure dates. Advances in Ecological Research, 35, 1-31. Loske KH (1990) Spring weights and fat deposition of Palaeartic passerine migrants in Senegal. Ringing & Migration, 11, 23-30. Loxton RG, Sparks TH (1999) Arrival of spring migrants at Portland, Skokholm, Bardsey and Calf of Man. Bardsey Observatory Report, 42, 105-142. Loxton RG, Sparks TH, Newnham JA (1998) Spring arrivals dates of migrants in Sussex and Leicestershire (1966-1996). The Sussex Bird Report, 50, 181-196. Máñez M, Tortosa FS, Barcell M, Garrido H (1994) La invernada de la cigüeña blanca en el suroeste de España. Quercus, 105, 10-12. Margary ID (1926) The Marsham phenological record in Norfolk, 1736-1925, and some others. Quarterly Journal of the Royal Meteorological Society, 52, 27-52. Marra PP, Francis CM, Mulvihill RS, Moore FR (2005) The influence of climate on the timing and rate of spring bird migration. Oecologia, 142, 307-315. Martí R, Del Moral JC (2003) Atlas de las aves reproductoras de España. Dirección General de Conservación de la Naturaleza-Sociedad Española de Ornitología, Madrid. Mason CF (1995) Long-term trends in the arrival dates of spring migrants. Bird Study, 42, 182189. Mata AJ, Caloin M, Michard-Picamelot D, Ancel A, Le Maho Y (2001) Are non-migrant white storks (Ciconia ciconia) able to survive a cold-induced fast? Comparative Biochemistry and Physiology A – Molecular and Integrative Physiology, 130, 93-104. McCarthy JJ, Canziani OF, Leary NA, Dokken DJ, White KS (eds) (2001) Climate change 2001: impacts, adaptation, and vulnerability. Cambridge University Press, Cambridge. McCarty JP (2001) Ecological consequences of recent climate change. Conservation Biology, 15, 320-331. Menzel A (2002) Phenology: its importance to the global change community. Climatic Change, 54, 379-385. Menzel A, Estrella N, Fabian P (2001) Spatial and temporal variability of the phenological seasons in Germany from 1951 to 1996. Global Change Biology, 7, 657-666. Mills A (2005) Changes in the timing of spring and autumn migration in North American migrant passerines during a period of global warming. Ibis, 147, 259-269. Molina B, Del Moral JC (2005) La Cigüeña Blanca en España. VI Censo Internacional (2004). SEO/Birdlife, Madrid. Møller AP (2004) Protandry, sexual selection and climate change. Global Change Biology, 10, 2028-2035. Møller AP, Szép T (2005) Rapid evolutionary change in a secondary sexual character linked to climatic change. Journal of Evolutionary Biology, 18, 481-495. Morales J, Moreno J, Merino S, Sanz JJ, Tomás G, Arriero E, Lobato E, Martínez-de la Puente J (2006) Early moult improves local survival and reduces reproductive output in female pied flycatchers. Ecoscience, in press. Moreau RE (1952) The place of Africa in the Palaeartic migration system. Journal of Animal Ecology, 21, 250-271. Moreau RE (1961) Problems of Mediterranean-Saharan migration. Ibis, 103, 373-427 and 580623. Moreau RE (1972) The Palaearctic-African bird migration systems. Academic Press, London. Morel GJ (1973) The Sahel zone as an environment for Palaeartic migrants. Ibis, 115, 413-417.
References
63
Moreno JM (ed) (2005) Evaluación preliminar de los impactos en España por efecto del cambio climático. Ministerio de Medio Ambiente, Madrid. Moss R, Oswald J, Baines D (2001) Climate change and breeding success: decline of the capercaillie in Scotland. Journal of Animal Ecology, 70, 47-61. Mullié WC, Brouwer J, Scholte P (1995) Numbers, distribution and habitat of wintering White Storks in the eastcentral Sahel in relation to rainfall, food and anthropogenic influences. In: Proceedings of the International Symposium on the White Stork (Western Population), Basel Switzerland, 7-10 April 1994 (eds Biber O, Enggist P, Marti C, Salathé T), pp 219240. Schweizerische Vogelwarte Sempach, Switzerland. Murphy-Klassen HM, Underwood TJ, Sealy SG, Czyrny AA (2005) Long-term trends in spring arrival dates of migrant birds at Delta Marsh, Manitoba, in relation to climate change. Auk, 122, 1130-1148. Newton I (2006) Can conditions experienced during migration limit the population levels of birds? Journal of Ornithology, 147, 146-166. Nicholson SE, Davenport ML, Malo AR (1990) A comparison of the vegetation response to rainfall in the Sahel and east Africa, using normalized difference vegetation index from NOAA AVHRR. Climatic Change, 17, 209–241. Ottosson U, Waldenström J, Hjort C, McGregor R (2005) Garden Warbler Sylvia borin migration in sub-Saharan West Africa: phenology and body mass changes. Ibis, 147, 750-757. Pallarés MA (1996) Atlas de aves y plantas de las Islas Canarias. Instituto Nacional de Meterología-Ministerio de Obras Públicas, Transporte y Medio Ambiente, Madrid. Parmesan C, Ryrholm N, Stefanescu C, Hill JK, Thomas CD, Descimon H, Huntley B, Kaila L, Kullberg J, Tammaru T, Tennent WJ, Thomas JA, Warren M (1999) Poleward shifts in geographical ranges of butterfly species associated with regional warming. Nature, 399, 579-583. Parmesan C, Yohe G (2003) A globally coherent fingerprint of climate change impacts across natural systems. Nature, 421, 37-42. Peñuelas J, Boada M (2003) A global change-induced biome shift in the Montseny mountains (NE Spain). Global Change Biology, 9, 131-140. Peñuelas J, Filella I (2001) Responses to a warming world. Science, 294, 793-794. Peñuelas J, Filella I, Comas P (2002) Changed plant and animal life cycles from 1952 to 2000 in the Mediterranean region. Global Change Biology, 8, 531-544. Pérez-Tris J, De la Puente J, Pinilla J, Bermejo A (2001) Body moult and autumn migration in the barn swallow Hirundo rustica: is there a cost of moulting late? Annales Zoologici Fennici, 38, 139-148. Peris S (2003) Feeding in urban refuse dumps: Ingestion of plastic objects by the White Stork (Ciconia ciconia). Ardeola, 50, 81-84. Pounds JA, Bustamante MR, Coloma LA, Consuegra JA, Fogden MPL, Foster PN, La Marca E, Masters KL, Merino-Viteri A, Puschendorf R, Ron SR, Sánchez-Azofeifa GA, Still CJ, Young BE (2006) Widespread amphibian extinctions from epidemic disease driven by global warming. Nature, 439, 161-167. Ptaszyk J, Kosicki J, Sparks TH, Tryjanowski P (2003) Changes in the timing and pattern of arrival of the white stork (Ciconia ciconia) in western Poland. Journal für Ornithologie, 144, 323-329. Reichholf JH (2005) Wirkt sich die Klimaerwaermung auf die Erstantkunft des Kuckucks Cuculus canorus aus? Ornithologische Mitteilungen, 57, 40-45. Rodríguez-Teijeiro JD, Gordo O, Puigcerver M, Gallego S, Vinyoles D, Ferrer X (2005) African climate warming advances spring arrival of the common quail Coturnix coturnix. Ardeola, 52, 159-162.
64
General Synthesis
Root TL, MacMynowski DP, Mastrandrea MD, Schneider SH (2005) Human-modified temperatures induce species changes: Joint attribution. Proceedings of the National Academy of Sciences USA, 102, 7465-7469. Root TL, Price JT, Hall KR, Schneider SH, Rosenzweig C, Pounds JA (2003) Fingerprints of global warming on wild animals and plants. Nature, 421, 57-60. Roy DB, Sparks TH (2000) Phenology of British butterflies and climate change. Global Change Biology, 6, 407-416. Sæther BE, Tufto J, Engen S, Jerstad K, Rostad OW, Skåtan JE (2000) Population dynamical consequences of climate change for a small temperate songbird. Science, 287, 855-856. Saino N, Szép T, Romano M, Rubolini D, Spina F, Møller AP (2004) Ecological conditions during winter predict arrival date at the breeding quarters in a trans-Saharan migratory bird. Ecology Letters, 7, 21-25. Salewski V, Falk KH, Bairlein F, Leisler B (2002) Numbers, body mass and fat scores of three Palearctic migrants at a constant effort mist netting site in Ivory Coast, West Africa. Ardea, 90, 479-487. Salewski V, Jones P (2006) Paleartic passerines in Afrotropical environments: a review. Journal of Ornithology, 147, 192-201. Santos T, Tellería JL (1977) Guión orientativo sobre la fenología de las aves estivales ibéricas. SEO, Madrid. Sasvári L, Heigyi Z, Hahn I (1999) Reproductive performance of white storks Ciconia ciconia breeding at low and high densities. Folia Zoologica, 48, 113-122. Saunders H (1871) A list of the birds of southern Spain. Ibis, 3(1), 205-225. Schaber J (2002) Phenology in Germany in the 20th century: methods, analyses and models. PhD Thesis, University of Postdam. Schnelle F (1955) Pflanzen-Phänologie. Akademische Verlagsgesellschaft Geest und Portig, Leipzig. Schwartz MD, Ahas R, Aasa A (2006) Onset of spring starting earlier across the Northern Hemisphere. Global Change Biology, 12, 343-351. Seel DC (1977) Migration of the northwestern european population of the cuckoo Cuculus canorus, as show by ringing. Ibis, 119, 309-320. Sokolov LV (2000) Spring ambient temperature as an important factor controlling timing of arrival, breeding, post-fledging dispersal and breeding success of Pied Flycatchers Ficedula hypoleuca in Eastern Baltic. Avian Ecology and Behaviour, 5, 79-104. Sokolov LV (2001) Climatic influence on year-to-year variation in timing of migration and breeding phenology in passerines on the Courish Spit. Ring, 23, 159-166. Sokolov LV (2006) Influence of the global warming on the timing of migration and breeding of passerines in the 20th century. Zoologichesky Zhurnal, 85, 317-342 Sokolov LV, Kosarev VV (2003) Relationship between timing of arrival of passerines to the Courish Spit and the North Atlantic Oscillation index (NAOI) and precipitation in Africa. Proceedings of the Zoology Institute-Russian Academy of Sciences, 299, 141-154. Sokolov LV, Markovets MY, Morozov YG (1999a) Long-term dynamics of the mean date of autumn migration in passerines on the Courish Spit of the Baltic Sea. Avian Ecology and Behaviour, 2, 1-18. Sokolov LV, Markovets MY, Shapoval AP, Morozov YG (1998) Long-term trends in the timing of spring migration of passerines on the Courish Spit of the Baltic Sea. Avian Ecology and Behaviour, 1, 1-21.
References
65
Sokolov LV, Markovets MY, Shapoval AP, Morozov YG (1999b) Long-term monitoring of spring migration time in passerines in the Courish Spit (the Baltic Sea). 2. Influence of temperature on migration terms. Zoologichesky Zhurnal, 78, 1102-1109. Sparks TH (1999) Phenology and the changing pattern of bird migration in Britain. International Journal of Biometeorology, 42, 134-138. Sparks TH, Bairlein F, Bojarinova JG, Hüppop O, Lehikoinen E, Rainio K, Sokolov LV, Walker D (2005) Examining the total arrival distribution of migratory birds. Global Change Biology, 11, 22-30. Sparks TH, Braslavská O (2001) The effects of temperature, altitude and latitude on the arrival and departure of the swallow Hirundo rustica in the Slovak Republic. International Journal of Biometeorology, 45, 212-216. Sparks TH, Carey PD (1995) The response of species to climate over two centuries: an analysis of the Marshman phenological record 1736-1947. Journal of Ecology, 83, 321-329. Sparks TH, Crick HQP (1999) The times they are a-changing? Bird Conservation International, 9, 1-7. Sparks TH, Mason CF (2001) Dates of arrivals and departures of spring migrants taken from Essex Bird Reports 1950-1998. Essex Bird Report, 1999, 154-164. Sparks TH, Mason CF (2004) Can we detect change in the phenology of winter migrant birds in the UK? Ibis, 146, 57-60. Sparks TH, Menzel A (2002) Observed changes in seasons: an overview. International Journal of Climatology, 22, 1715-1725. Sparks TH, Roberts DR, Crick HQP (2001) What is the value of first arrival dates of spring migrants in phenology? Avian Ecology and Behaviour, 7, 75-85. Sparks TH, Smithers RJ (2002) Is spring getting earlier? Weather, 57, 157-166. Stefanescu C, Peñuelas J, Filella I (2003) Effects of climatic change on the phenology of butterflies in the northwest Mediterranean Basin. Global Change Biology, 9, 1494-1506. Stenseth NC, Mysterud A (2002) Climate, changing phenology, and other life history traits: Nonlinearity and match-mismatch to the environment. Proceedings of the National Academy of Sciences USA, 99, 13379-13381. Stenseth NC, Mysterud A (2005) Weather packages: finding the right scale and composition of climate in ecology. Journal of Animal Ecology, 74, 1195-1198. Stervander M, Lindström Å, Andersson A (2005) Timing of spring migration in birds: long-term trends, North Atlantic Oscillation and the significance of different migration routes. Journal of Avian Biology, 36, 210-221. Stireman JO, Dyer LA, Janzen DH, Singer MS, Lill JT, Marquis RJ, Ricklefs RE, Gentry GL, Hallwachs W, Coley PD, Barone JA, Greeney HF, Connahs H, Barbosa P, Morais HC, Diniz IR (2005) Climatic unpredictability and parasitism of caterpillars: Implications of global warming. Proceedings of the National Academy of Sciences USA, 102, 1738417387. Strode PK (2003) Implications of climate change for North American wood warblers (Parulidae). Global Change Biology, 9, 1137-1144. Szép T (1995) Relationship between West African rainfall and the survival of the central European adult Sand Martin Riparia riparia population. Ibis, 137, 162-168. Tait WC (1924) The birds of Portugal. Whiterby, London. Tortosa FS, Caballero JM, Reyes-López J (2002) Effect of rubbish dumps on breeding success in the White Stork in southern Spain. Waterbirds, 25, 39-43.
66
General Synthesis
Tortosa FS, Máñez M, Barcell M (1995) Wintering white storks (Ciconia ciconia) in South West Spain in the years 1991 and 1992. Vogelwarte, 38, 41-45. Tryjanowski P, Kuźniak S, Sparks TH (2002) Earlier arrival of some farmland migrants in western Poland. Ibis, 144, 62-68. Tryjanowski P, Kuźniak S, Sparks TH (2005) What affects the magnitude of change in first arrival dates of migrant birds? Journal of Ornithology, 146, 200-205. Tryjanowski P, Sparks TH (2001) Is the detection of the first arrival date of migrating birds influenced by population size? A case study of the red-backed shrike Lanius collurio. International Journal of Biometeorology, 45, 217-219. Tryjanowski P, Sparks TH, Ptaszyk J, Kosicki J (2004) Do White Storks Ciconia ciconia always profit from an early return to their breeding grounds? Bird Study, 51, 222-227. Tucker CJ, Dregne HE, Newcome WW (1991) Expansion and contraction of the Sahara desert from 1980 to 1990. Science, 253, 299-301. Vähätalo AV, Rainio K, Lehikoinen A, Lehikoinen E (2004) Spring arrival of birds depends on the North Atlantic Oscillation. Journal of Avian Biology, 5, 210-216. Van den Bosche W (2002) Eastern European White Stork populations: migration studies and elaboration of conservation measures. Bundesamt für Naturschutz, Bonn. Visser ME, Both C (2005) Shifts in phenology due to global climate change: the need for a yardstick. Proceedings of the Royal Society of London-Series B, 272, 2561-2569. Walther GR, Hughes L, Vitousek P, Stenseth NC (2005) Consensus on climate change. Trends in Ecology and Evolution, 20, 648-649. Walther GR, Post E, Convey P, Menzel A, Parmesan C, Beebee TJC, Fromentin JM, HoeghGuidberg O, Bairlein F (2002) Ecological response to recent climate change. Nature, 416, 389-395. Wilson RJ, Gutiérrez D, Gutiérrez J, Martínez D, Agudo R, Montserrat VJ (2005) Changes to the elevational limits and extent of species ranges associated with climate change. Ecology Letters, 8, 1138-1146. Wilson WH, Kipervaser D, Lilley SA (2000) Spring arrival dates of Maine migratory breeding birds: 1994-1997 vs. 1899-1911. Northeastern Naturalist, 7, 1-6. Winstanley D, Spencer R, Williamson K (1974) Where have all the Whitethroats gone? Bird Study, 21, 1-14. Witt K (2004) Erst-und Letztbeobachtungen des Mauerseglers (Apus apus) in Berlin. Berliner Ornithologischer Bericht, 14, 186-192. Wuczyński A (2005) The turnover of White Storks Ciconia ciconia on nests during spring migration. Acta Ornithologica, 40, 83-85. Yom-Tov Y (2001) Global warming and body mass decline in Israeli passerine birds. Proceedings of the Royal Society of London-Series B, 268, 947-952. Zalakevicius M (2001) Bird migration and the climate: a review of the studies conducted in Lithuania in the context of climate change. Acta Zoologica Lituanica, 11, 200-218. Zalakevicius M, Bartkeviciene G, Raudonikis L, Junalaitis J (2006) Spring arrival response to climate change in birds: a case study from eastern Europe. Journal of Ornithology, 147, 326-343.
Chapter 1
Environmental and geographical constraints on common swift and barn swallow migratory patterns throughout the Iberian Peninsula
Oscar Gordo1,2, Juan José Sanz2, Jorge M. Lobo3 1
Departament de Biologia Animal (Vertebrats), Universitat de Barcelona.
2
Departamento de Ecología Evolutiva, Museo Nacional de Ciencias Naturales (CSIC).
3
Departamento de Biodiversidad y Biología Evolutiva, Museo Nacional de Ciencias Naturales (CSIC).
Journal of Biogeography (submitted)
70
Chapter 1
ABSTRACT Aims Still poorly identified, the main migratory pathways for most trans-Saharan species pass through the Iberian Peninsula which acts as a gateway to the European-African migratory system. Arrival patterns in this region for the common swift (Apus apus) and barn swallow (Hirundo rustica), of similar morphology and flight capabilities, were described and the environmental and geographical factors best explaining them were examined, in a search for common ecological constraints on these two migratory species. Location Latitude ranged from 36.02ºN-43.68ºN; longitude from 9.05ºW-3.17ºE; altitude from 0-1595 m a.s.l. for 482 common swift and 812 barn swallow Spanish localities, spread widely over the Iberian breeding grounds of both species. Methods Our dataset, covering the years 1960-1990, consisted of 3206 arrival dates for common swifts and 6036 for barn swallows. Forty topographical, climatic, river basin, geographical and spatial variables were used as explanatory variables in general regression models (GRM). GRM included polynomial terms up to cubic functions in all variables when they were significant. A backward stepwise selection procedure was applied in all models until only significant terms remained. GRM were applied in two steps. First, we searched for the best model in each one of the previous five types of variables. To cope with the unavoidable correlation between explanatory variables, the relative importance of each type of variables was assessed by hierarchical variance partitioning. Secondly, we searched for that model able to explain the maximum amount of the observed variability of arrival date. To obtain this model all significant explanatory variables were subjected jointly to a GRM. Spatial variables were then added to this model to take any remaining spatial structure in the data into account. Moran’s I autocorrelation coefficient was used to check for spatial autocorrelation. Results Both species arrived earlier to the southwestern Iberian Peninsula, where summers are warmer and drier. From there, both species follow the main southern Iberian river basins towards the northeast, however several mountainous regions impede the colonization of eastern Iberia. Best models for each type of variable explained 19%-47% of variability in common swift arrival dates and 14%-44% in barn swallow arrival dates. Variance partitioning indicated that climatic and geographical variables best explained variability. Best predictive models built with all variables accounted for 52% of variability in common swift arrival dates and 50% in those of the barn swallow. Residuals from both models were not spatially autocorrelated, an indication that all major spatially structured variation had been accounted for. Main conclusions Spring colonization is highly dependent on Iberian Peninsula geographical configuration. This spatial constraint forces both species to converge very closely in their spring migration, since common swifts and barn swallows undergo a trade-off between optimum migratory pathways and territories ecologically suitable for breeding.
Migration of common swifts and barn swallows
71
INTRODUCTION The migration of trans-Saharan birds northwards in spring and southwards in autumn has long been recognized as one of the most remarkable biological phenomena (Moreau, 1972). Millions of individuals of some 200 European bird species overwinter south of the Sahara in Africa, then fly to breeding grounds in Europe, to afterwards return to Africa, year after year. For western European populations, the Iberian Peninsula plays two prominent roles, as the first European territory reached during the spring migration and the last left by migrants prior to their autumn return flight to Africa (Moreau, 1956; Pérez-Tris & Santos, 2004). The onset of migration by long-distance migratory birds is triggered by photoperiod through endogenous rhythms (Berthold, 1996; Gwinner, 1996), an environmental cue enabling birds to be in the right place at the right time (Coppack & Both, 2002). Migratory arrival and departure date variation (e.g., Lehikoinen et al., 2004; Sparks et al., 2005), an adjustment in timing to specific environmental conditions at each place and time, has been of interest to many authors throughout the last century. The pioneering studies of Sliwinsky (1938) and Southern (1938 a,b, 1939, 1940, and 1941) described spring European colonization patterns for nine trans-Saharan birds. Both authors mapped isophenes, lines connecting points of equal arrival dates, a technique used first by Middendorff (1855) to help visualize the movement of the migratory wave through a given territory. Both Sliwinsky and Southern pointed out the paucity of data from southern Europe, and in particular, from the Iberian Peninsula. Unfortunately, most trans-Saharan bird migratory patterns on the scale of the Iberian Peninsula are still unexplored (Pérez-Tris & Santos, 2004; but see Gordo & Sanz, 2006). Based on arrival data for Gibraltar only, Southern claimed that the earliest European arrivals occurred in southwestern Europe, about two weeks earlier than in similar Eastern European latitudes. Most later studies focussed on particular countries and species (Zabłocka, 1959; De Smet, 1970; Monteanu
&
Grischtschenko
Maties, et
al.,
1978; 1995;
Beklová
et
al.,
Grishchenko,
1983;
2001;
Munteanu
1985;
Grishchenko
2002;
Grishchenko, 2003) and applied the methodology used by Sliwinsky and
72
Chapter 1
Southern decades earlier to describe broad geographical patterns of the progression of migration. Applying GIS techniques, Huin and Sparks (1998 and 1999) mapped more comprehensively the arrival and progression through Britain of four migratory birds, but did not investigate potential environmental or geographical factors underlying the spatial patterns observed. Therefore, studies have yet to go beyond mere description of migration progression through large territories. Huin and Sparks (1998 and 2000) offered evidence of the effect of climate on migratory arrival dates. Temperatures in both Britain and in Spanish and French pathways affected the timing of recorded arrivals year after year; warmer years, with their earlier spring providing greater food availability sooner, corresponded with rapid northward progression and earlier arrivals. Such early migrant bird arrival dates in response to increasing temperatures have been reported repeatedly during recent decades (Crick, 2004). Therefore, an accurate knowledge of the factors governing migratory phenology, both temporally and spatially, would be critical in providing a better assessment of the potential hazards to migratory birds posed by current and future climate change (Møller et al., 2004). This study examines spatial patterns of spring migration through the Iberian Peninsula of the common swift (Apus apus) and barn swallow (Hirundo rustica), two of the most abundant and widespread species in this region (Martí & Del Moral, 2003). Their specialized feeding on airborne insects has led both species to develop very similar migration strategies and requirements (Cramp, 1985; Cramp 1988), though their timing of migration both in the spring and autumn are quite different. The common swift arrives in Spain, on average, in April and departs in August (Bernis, 1970), whereas the barn swallow arrives in March and departs in September (Bernis, 1971). Therefore, we can compare how similar species with similar requirements have evolved to offer the best response to the same spatial scenario (the Iberian Peninsula) but under different ecological conditions, since the barn swallow arrives at the beginning of spring and the common swift at its end.
Migration of common swifts and barn swallows
73
The main aims of this study are to describe the spatial patterns of spring arrivals and to ascertain the principal environmental and geographical constraints on the arrival dates of common swifts and barn swallows. Specifically,
we
examine
the
variability
explained
by
each
climatic,
topographical, river basin, geographical and spatial group of explanatory variables. Our data on two ecologically similar species are a basis from which to compare their migratory pathways through the same territory and determine the relative influence of: constant (on our time scale) characteristics of Iberian Peninsula geography and topography; changes in ecological conditions during the course of spring; and/or the influence of the evolutionary history of each species on their migration patterns.
MATERIAL AND METHODS Bird arrival dates Arrival dates for the common swift and barn swallow were obtained from the Spanish Instituto Nacional de Meteorología phenological database gathered by a volunteer observer network set up several decades ago, as in other European countries (e.g., UK, Huin & Sparks, 1998), to improve the understanding of the timing of seasons and thus, agricultural practices (García, 1963; Gordo & Sanz, 2006). Volunteers apply standard observation rules to record phenological events of plants and animals from a list of common species (Anon., 1943). The characteristics of these events include: i) broad distribution of species throughout Spain (volunteers can observe everywhere in the country), ii) considerable abundance (phenological observation unconstrained by number of individuals), iii) unmistakable morphology and/or behaviour (increased data reliability) making them ideal for phenological monitoring and ensure data homogeneity, independent of the observer. Spring migratory phenology of both species was measured as the date of the first sighted individual in each study site and year. The first sighted individual thus is interpreted as the first nesting individual arriving at a certain locality. This observation method produces data with very few undetectable misidentifications, as there is little probability of mistaking passing individuals,
74
Chapter 1
on their way to more northerly or higher areas, for nesting individuals (Slagsvold, 1973). Another potential source of error would be misidentification of species. Their similarity in feeding habits and body shape does not extend to their different colouring, behaviour and voice (Cramp, 1985; Cramp, 1988), nor to their very different migratory calendar; barn swallows arrive on average nearly one month (23.8 days) before common swifts (see Fig. 1.1). All collected and computerized original records (9239, from 829 localities; see Fig. 1.1 for species details), from 1960 to 1990, correspond to the period for which meteorological data is also available for each UTM (see below). Dates were transformed to Julian days (1 = first of January); 1 day was added after 28 February to take leap-years into account. For both species, the median value (less influenced by extreme observations and thus a better estimate of tendencies within date distributions) for all records from the same 100 km2 UTM cell (Fig. 1.1) was selected. As some UTM cells contained more than one locality, the final number of records (UTM cells) available for calculations was smaller than the number of original localities (see Fig. 1.1). The difference in number of records from each UTM could have biased median values, but coefficients of Spearman rank correlation of median values with number of records did not indicate such a bias (Common swift: rS = 0.026; Barn swallow: rS = -0.072). Explanatory variables A set of 40 explanatory variables, used to model migratory arrival dates of the study species (Table 1.1), fall into topographic, climatic, river basin, geographic, and spatial groups. For each 100 km2 Iberian Peninsula UTM cell (n = 6063) seven topographic and eighteen climatic variables were extracted using IDRISI 32 Geographic Information System (Clark Labs, 2001). Topographical variables were obtained from a Digital Elevation Model (Clark Labs, 2000). Altitude range, together with slope, aspect (mean direction of slope) and its diversity were calculated from mean, minimum and maximum altitude of all 100 1-km2 pixels (in each UTM). Climate variables, courtesy of the Instituto Nacional de Meteorología, were rainfall and mean, maximum and
Migration of common swifts and barn swallows
75
20 55
Records
3203
Number of localities
90
482
Number of UTM
125
459
Mean ± SD
108.67 ± 24.13
120
160 Number of UTM
100 80 60 40 20 0
20
40
60
80
100
120
140
160
Median of first arrival date
a)
20 55
Records
90 125
6036
Number of localities
812
Number of UTM
750
Mean ± SD
85.26 ± 21.75
160 140
Number of UTM
160
120 100 80 60 40 20 0
b)
20
40
60
80
100
120
140
160
Median of first arrival date
Figure 1.1 Median common swift (a) and barn swallow (b) arrival dates. Maps of the geographic distribution of recorded data in Spain (square = UTM). Scale colour bar in Julian day (1 = 1 January). The number of records, localities and UTMs, together with the mean value and the standard deviation (SD) for all records are also specified for each species. The histogram with the distribution of observations is also shown (scale of x-axis in Julian days).
76
Chapter 1
Variables Topographical MIA MEA MXA AR SLP ASP DASP Climatic SPR SUR AUR WIR AI SPMIT SUMIT AUMIT WIMIT SPMET SUMET AUMET WIMET SPMXT SUMXT AUMXT WIMXT ATR Basins MIÑ CAN DUE EBR CAT TAJ GDN TUR GDQ SEG Geographical DSG CSG DIR Spatial X Y
Description Minimum altitude (m) Mean altitude (m) Maximum altitude (m) Altitude range (m) Slope (degrees) Aspect (degrees) Diversity of aspects Spring rainfall (L) Summer rainfall (L) Autumn rainfall (L) Winter rainfall (L) Aridity index Spring minimum temperature (ºC) Summer minimum temperature (ºC) Autumn minimum temperature (ºC) Winter minimum temperature (ºC) Spring mean temperature (ºC) Summer mean temperature (ºC) Autumn mean temperature (ºC) Winter mean temperature (ºC) Spring maximum temperature (ºC) Summer maximum temperature (ºC) Autumn maximum temperature (ºC) Winter maximum temperature (ºC) Annual temperature range (ºC) Miño Cantabrian Duero Ebro Catalan Tajo Guadiana Turia Guadalquivir Segura Distance to Straits of Gibraltar (km) Cost from Straits of Gibraltar Distance to rivers (km) Longitude (m) Latitude (m)
Table 1.1 Topographical, climatic, river basin, geographical and spatial variable groups used in general regression models along with their acronym, complete description and units (in brackets).
Migration of common swifts and barn swallows
77
Cantabrian C oast
2
1
3
5 4
6
9 8 7
10
11
¿ N
Straits of Gibraltar
Figure 1.2 Topographic map of the Iberian Peninsula with the main geographic features cited in text. River basins are numbered (codes: 1-Miño, 2-Cantabrian, 3-Duero, 4-Ebro, 5-Catalan, 6-Tajo, 7-Southwestern (not included in analyses), 8-Guadiana, 9-Turia, 10-Guadalquivir, 11Segura) and their boundaries marked by solid lines. The main rivers in each basin are shown as dashed lines.
minimum temperatures during each of the spring, summer, autumn and winter seasons, together with annual temperature variation and an aridity index, expressed as AI = 1/(P/T + 10) x 100 where P is the mean annual precipitation and T the mean annual temperature. The geographical group of variables included: distance from each UTM cell to the Straits of Gibraltar, distance to the closest major Iberian river (Fig. 1.2) and the cost of dispersion from the Straits of Gibraltar. Cost from the Straits of Gibraltar was calculated considering a friction surface image (a variable that impedes or facilitates movement through space) and the COSTGROW algorithm module of IDRISI 32 software (Eastman, 2001). The friction surface
78
Chapter 1
Figure 1.3 Map of the cost of moving from the Straits of Gibraltar along valleys through the Iberian Peninsula. This cost surface was obtained from the costgrow algorithm module of idrisi 32 software, taking the product of altitude x distance-to-rivers as friction surface. Darker UTMs are those with the more costly pathway from the Straits of Gibraltar. The black dot represents the target point, the Straits of Gibraltar, while white dots are destination points arbitrarily selected throughout the Iberian Peninsula. Black squares are the localities with the latest barn swallow arrivals. Lines representing the lowest-cost route linking the target point with destination points were calculated by the pathway module of IDRISI 32 software.
image was the product of (standardized) altitude x (standardized) distance-torivers (see Fig. 1.3). This product accounts for the varying effect of the altitude on probable routes of dispersion along major Iberian rivers (low vs. high valleys). The surface generated by COSTGROW represents the cost of dispersion from a source point, the Straits of Gibraltar, along valleys followed as routes of migration, the friction surface. Finally, a 0-1 code, identifying UTM falling within (1) or outside (0) of major Iberian river basins (Fig. 1.2) was included in the model as a categorical predictor. Spatial variables, the central latitude and longitude of each UTM cell, were included in models as a third degree polynomial (Trend Surface Analysis TSA; see Legendre & Legendre, 1998), as an aid to the incorporation of effects
Migration of common swifts and barn swallows
79
caused by otherwise unaccounted-for historical, biotic or environmental variables (Legendre & Legendre, 1998). Latitude and longitude were standardized (mean=0 and standard deviation=1), as were all other continuous explanatory variables, in order to eliminate measurement scale effects. Statistical analyses The relationship of arrival date to explanatory variables was analyzed by means of General Regression Models (GRM) using STATISTICA (StatSoft, 2001), in two steps. Firstly, the explanatory variables from the same group (topographical, climatic, river basin, geographical and spatial) were backward stepwise ranked according to their explanatory capacity, and each statistically significant linear, quadratic or cubic variable term was included in final group models. Next, all significant explanatory variables so obtained were jointly backward stepwise selected to yield a complete model from all groups. Then the nine terms of the third degree polynomial of central latitude and longitude were incorporated into this complete model, and another backward stepwise selection eliminated non-significant variables. Predicted scores of this complete model were mapped and examined. Arrival dates were examined for possible spatial structure after accomplishing GRM by calculating Moran’s I autocorrelation coefficient with a Bonferroni-corrected significance level (Sawada, 1999) against ten classes separated by a lag distance of 60 km (from 60 to 600 km). Autocorrelation of residuals from a regression model of arrival times developed from the various groups
of
explanatory
variables
was
checked
because
such
spatial
autocorrelation would indicate that one or more important spatially structured explanatory variables may have been left out (Cliff & Ord, 1981; Legendre & Legendre, 1998; Keitt et al., 2002). The inherent correlation of environmental variables hinders the estimation of their explanatory power. To ascertain the relative importance of each type of explanatory variable a hierarchical variance partitioning was implemented (Birks, 1996; MacNally, 2000; MacNally, 2002). The 2k (k = 5, types of explanatory variables) possible models were constructed and the average of the variability explained by each type of variable was calculated.
80
Chapter 1
RESULTS Factors related to variability in common swift arrival dates Median values of first arrival dates were earlier in UTM in the southern Iberian Peninsula and near the Mediterranean coast (Fig. 1.1a). Common swifts arrived last in the Northern Plateau and in the Iberian System (see Fig. 1.2). The earliest and latest arrival dates were separated by 132 days (end January to the beginning of June), longer than previously reported (Bernis, 1951; Bernis, 1970), a result of the broader temporal and spatial range of our data. The distribution, slightly skewed to the left (Skewness = -1.052, t458 = 9.233, P < 0.001), had a larger proportion of early arrivals than in a normal distribution. As distribution skewness does not usually have an appreciable effect on the F statistic
(StatSoft,
2001),
all
analyses
were
performed
with
original
untransformed data. Climatic and geographical models were the most explanatory (Table 1.2). Of the climatic variables, summer rainfall and mean temperature as well as the aridity index were retained in the final model. The signs of variables pointed towards earlier arrivals in areas with drier and warmer summers (Fig. 1.4). Of the geographical variables, both distance to- and cost of dispersion from- the Straits of Gibraltar were related with common swift arrivals (Table 1.2), later in localities remote from the Straits of Gibraltar and reached by an expensive pathway. While the general relevance of geographical variables highlighted the importance of the spatial configuration of the territory, the cubic function of the distance to the Straits of Gibraltar was particularly relevant to common swift arrivals. Modelling of this variable alone accounted for 41.83% of variability (F3,455 = 110.77, P < 0.001). The topographical model was the least relevant (Table 1.2). Its prediction of later arrival in high altitude plains concurs exactly with observations in the Northern Plateau, one of the areas where individuals arrive latest. On the other hand, the final model of the five river basin variables explained a notable
Migration of common swifts and barn swallows
Group of variables Topography
Model 2
3
100.61 + 12.13MIA + 6.49MIA - 2.99MIA 3.73SLP
81
R 2adj 18.57
F 27.11
4, 454
Pure R 2adj 2.40
d.f.
Climate
114.84 + 11.58SUR - 11.88SUR 2 + 2.96SUR 3 + 11.26AI - 13.24SUMET - 2.27SUMET 2
43.33
59.36
6, 452
7.44
Basins
111.11 + 9.46DUE - 24.25GDN + 12.53TUR 34.88GDQ - 18.09SEG
37.93
56.97
5, 453
5.45
Geography
113.50 + 16.32DSG - 8.16DSG 2 - 2.86DSG 3 + 4.42CSG
44.87
94.19
4, 454
6.57
Space
112.67 + 13.23X - 5.71X 2 + 21.60Y - 5.01Y 2 4.33Y 3 - 11.92XY
47.37
69.69
6, 452
9.23
Complete model
110.09 - 3.45SLP - 12.52SUR + 4.56SUR 2 11.46SUMET - 2.84SUMET 2 + 8.57TUR + 10.55DSG - 5.74DSG 2 + 2.95CSG
49.69
51.27
9, 449
Complete model + spatial terms
114.44 - 5.70SLP - 9.44SUMET - 2.19SUMET 2 9.56GDN - 21.29GDQ - 17.17SEG + 10.77X 3.83X 2 -8.17XY
51.96
56.04
9, 449
Table 1.2 Best regression models of common swift spring arrivals. The regression equation, 2 2 adjusted R (R adj), F-test (F) and degree of freedom (d.f.) are shown for each type of variable, the complete model and the complete model with spatial terms. The effect of each type of 2 variable alone, according to hierarchical partitioning of variance, is indicated by the pure R adj column. All models were significant at P < 0.0001 and included only significant variables at P < 0.05. See Table 1 for explanatory variable acronyms.
160
Swift arrival date (Julian day)
Swift arrival date (Julian day)
160 140 120 100 80 60 40
0
50
100
150
200
250
Summer rainfall (L)
300
350
140 120 100 80 60 40
12
14
16
18
20
22
24
26
28
Summer mean temperature (ºC)
Figure 1.4 Illustrative scatterplots of the most relevant climatic variables and the common swift arrival date. The continuous line is the best fitted polynomial model.
amount of original data variability (Table 1.2). The negative effect of Guadalquivir, Guadiana and Segura basins (see Fig. 1.2) fully agrees with the previously mentioned earlier arrivals in southern Iberia (Fig. 1.1a).
82
Chapter 1
0.5
Topography Climate Basins Geography Complete Complete + space
Swift
0.4 0.3 0.2 0.1 0 -0.1 -0.2
Moran’s I
-0.3 -0.4 -0.5 0.5
Swallow
0.4 0.3 0.2 0.1 0 -0.1 -0.2 -0.3 -0.4 -0.5
0
100
200
300
400
500
600
Separation distance (km)
Figure 1.5 Spatial autocorrelation of model residuals for each type of variable and for the final model of all variables. Isotropic correlograms represent the variation in the scores of Moran's I spatial autocorrelation statistic with the increase in the separation distance between 10 x 10 km UTM cells, using a lag distance of 60 km and an active lag of 600 km.
Backward stepwise selection of all significant variables from the five groups (Table 1.2) together produced a final model that explained around 50% of total variability. Spatial variables, by themselves highly relevant, accounted for around 47% of total variability (Table 1.2), indicating that common swift spring arrival is highly spatially structured. The slight increase in the percentage of explained variability, to 52%, due to the inclusion of spatial terms, after the environmental and geographic variables, shows that some spatial structure in the data had not been explained by the environmental and geographical variables. Residuals from models for each type of variable (other than topography and river basin; Fig. 1.5) were not significantly spatially autocorrelated, nor were those from the complete final model.
Migration of common swifts and barn swallows
83
50 70 90 110 130
a)
40 60 80 100 120
b) Figure 1.6 Map of predicted common swift (a) and barn swallow (b) arrivals according to the best final complete model. Scale colour bar in Julian day (1 = 1 January).
84
Chapter 1
The small average percentage of variability accounted for by each type of variable (see Pure R2adj in Table 1.2) indicates that most of the variability is due to the high degree of variable collinearity (e.g., warmest areas are also the driest). In any case, the groups of explanatory variables from which the best models were developed also accounted for greater fractions of variability by themselves. These models point towards earlier spring arrivals of common swifts in southernmost localities, with low altitudes, higher temperatures and little precipitation. The map drawn from the final model (Fig. 1.6a) displays the spring migratory spatial pattern of this species, where an earlier arrival region appears in the southernmost river basins. Later arrivals occurred on the Cantabrian coast, in the Northern Plateau and the mountainous region of the Iberian System, while arrivals seem to be earlier in the north-eastern corner of the Iberian Peninsula and the Ebro basin than in some neighbouring regions. Factors related to variability in barn swallow arrival dates A pattern of earliest arrivals in the southwestern Iberian corner (Fig. 1.1b) can be seen in the geographical variation in data. The distribution of dates was normal (SW-W = 0.997; P = 0.106), with earliest and latest first arrival dates between 29 January and 28 May. The early arrivals coincide with those reported in the literature, while the later ones extend the migratory period by nearly one month (Saunders, 1871; Bernis, 1971). Climatic and geographical models for this species were also the most explanatory (Table 1.3). The climatic model for barn swallow arrivals, while including a positive quadratic function of temperature range, highlighted the role of summer rainfall and maximum temperatures. A model including only the quadratic function of this latter summer variable accounted for 33.38% (F2,747 = 188.66, P < 0.001) of barn swallow arrival date variability. A quite similar picture to that described for the common swift emerged, of earliest arrivals where summer temperatures are highest and rainfall lowest; arrivals were especially early where conditions are most arid and temperatures less variable throughout the year.
Migration of common swifts and barn swallows
Group of variables
Model 2
85
R 2adj 13.52
F 30.29
4, 745
Pure R 2adj 2.34
d.f.
Topography
80.82 - 6.00MIA + 8.09MIA + 11.62MEA 4.94MEA 2
Climate
86.29 + 9.85SUR - 2.31SUR 2 + 8.83AI 16.91SUMXT - 3.44SUMXT 2 + 6.80ATR + 2.40ATR 2
43.10
82.06
7, 742
8.52
Basins
90.11 + 8.99CANT - 16.82TAJ - 24.65GDN + 8.59TUR - 24.65GDQ
31.23
69.02
5, 744
4.82
Geography
87.70 + 12.02DSG - 2.26DSG 2 - 2.73DSG 3 + 11.92CSG - 5.01CSG 2 + 0.77CSG 3
41.21
88.50
6, 743
7.07
Space
83.54 + 21.38X - 3.89X 2 - 2.54X 3 + 9.52Y -7.9XY + 2.97X 2Y - 2.19XY 2
43.57
83.62
7, 742
9.75
Complete model
82.93 + 7.06SUR - 1.52SUR 2 + 7.57AI 14.78SUMXT - 1.89SUMXT 2 + 5.77ATR + 2.65ATR 2 + 9.81TUR - 6.37GDN + 3.23CSG
48.24
70.81
10, 739
Complete model + spatial terms
80.09 - 6.36SUMXT - 2.07SUMXT 2 + 3.93ATR + 5.69TUR + 3.59CSG + 9.60X - 2.24X 2 + 7.27Y + 3.74Y 2 - 7.33XY
49.91
75.62
10, 739
Table 1.3 Best regression models of barn swallow spring arrivals. The regression equation, 2 2 adjusted R (R adj), F-test (F) and degree of freedom (d.f.) are shown for each type of variable, the complete model and the complete model with spatial terms. The effect of each type of 2 variable alone, according to hierarchical partitioning of variance, is indicated by the pure R adj column. All models were significant at P < 0.0001 and included only significant variables at P < 0.05. See Table 1 for explanatory variable acronyms.
The geographical model explained a slightly smaller percentage of variability than did the climatic one (Table 1.3), included only the cubic function of two variables (distance to- and cost of dispersion from- the Straits of Gibraltar) and highlighted the importance of the geographical configuration of the Iberian Peninsula. This configuration shapes the most probable migration routes, probably limited to only one optimum pathway through the territory. Topographical and river basin variables seemed to have a smaller influence (Table 1.3). High altitude localities were colonized later, while arrivals were clearly earlier in the Guadiana and Guadalquivir basins (see Fig. 1.2), nearest to the Straits of Gibraltar. The correlation of many of the explanatory variables caused their real contribution to the percentage of variability accounted for them to be much smaller than such a percentage accounted for by the model developed from them alone (Table 1.3). While geographical and climatic variables contributed most, spatial variables were also highly explicative by themselves due to the
86
Chapter 1
most, spatial variables were also highly explicative by themselves due to the spatial structure in barn swallow arrival dates. However, the inclusion of spatial variables after considering the remaining environmental and geographic variables increased the explained variability by only 1.66% in the complete final model (see Table 1.3). The inclusion of four climate variables in these final models highlights their relevance. While residuals of the various models developed from each type of variable were spatially autocorrelated (Fig. 1.5), both complete stepwise models were not significantly autocorrelated at any lag distance, evidence that any important spatially structured variation had been included (Fig. 1.5). The geographical pattern (Fig. 1.6b) reflected earlier barn swallow arrivals in the southwestern Iberian corner, with its high temperatures and little precipitation, and mainly, along the Guadiana and Guadalquivir basins. They arrive much later in the mountainous zones of southeastern (Sierra Nevada), northwestern (Cantabrian Mountains) Iberian Peninsula, but mainly in those of the Iberian System.
DISCUSSION Final models for both species were similar in their explanatory capacity and variable composition. Absence of autocorrelation in the final models, as well as the irrelevance of spatial variables (added to the models after environmental and geographical variables), indicated that most of the arrival date variability was explained well enough by the environmental and geographical variables selected. Even though the correlation of the five types of variables employed reduces the reliability of causal factor identification, climatic and geographical variables still seemed to be especially relevant. Just as the occurrence of breeding common swifts and barn swallows in Spain correlates most strongly with both temperature and rainfall (Martí & Del Moral, 2003), so do earlier arrivals at the end of winter in areas of less rainfall and higher temperatures during the summer (see Fig. 1.2). Distance to- and cost of dispersion from- the Straits of Gibraltar were also very important in explaining migrant bird arrival dates. Arrivals were later at localities more distant and more
Migration of common swifts and barn swallows
87
costly to reach from the Straits. Lowest-cost routes much longer than a straight line can be seen on the map drawn from the variable (friction surface) used to calculate the cost of dispersion from the Straits of Gibraltar (see Fig. 1.3). The Cantabrian Mountains, Iberian System and Sierra Nevada (darker areas in Fig. 1.3) form a nearly continuous geographical barrier, raising the cost of routes traversing them and impeding direct flight to the eastern Iberian Peninsula from the first colonized areas from southwestern Spain. Thus the lowest-cost route for common swifts and barn swallows becomes a longer journey across the Iberian Peninsula, leading to delayed arrivals in the eastern breeding grounds. The greater cost of eastern localities is reflected in a longitudinal gradient in arrival dates. The combination of the latitudinal and longitudinal gradients derived from climatic and geographical variables leads to a southwestern to northeastern gradient for both species, disrupted only by the Catalan and Ebro basins (see Fig. 1.2). Earlier arrivals to northeastern Spain suggest that there may be a direct crossing of the Mediterranean Sea from North Africa via the Balearic Islands (Moreau, 1953; Bernis, 1962; Bernis, 1971; Spina & Pilastro, 1998), although migration along the Spanish Mediterranean coast is also possible. Thus, there is evidence of very strong environmental constraints on the spring migration of these two species, which determine their similar spatial patterns. These common patterns for spring colonization suggest the existence of some environmental constraints due to the inevitable spatial configuration of the Iberian Peninsula beyond possible preferential migratory routes for each species linked with the particular evolutionary history or ancient geographical distribution of each. As avian migration is strongly influenced by endogenous programmes which in turn have a genetic basis (Berthold, 1996), so too could common swift and barn swallow genes impose routes different for each species, as a result of their different phylogenetic origins. However, the similarity (due to abiotic constraints; see Fig. 1.3) of the pattern of their spring migration through the Iberian Peninsula (see Fig. 1.6) would be in accordance with the adaptability to environmental conditions of migratory patterns (Berthold et al. 1992; Pulido et al. 1996). The similarity of their ecological niche should imply that both species
88
Chapter 1
search for similar
ecological conditions during migration and, as a
consequence, have similar migration patterns. There is a trade-off between the need for conditions ecologically suitable for reproduction at the beginning of spring and for pathways of lowest cost from the Straits of Gibraltar to breeding localities (see Fig. 1.3). This trade-off becomes especially evident in the case of the barn swallow, which arrives earlier in northern latitudes in the west than in the east of the Iberian Peninsula, due to its spatial configuration. After leaving Africa and reaching Iberia, individuals do not seem to advance northwards in all directions. They first occupy western areas along the southernmost river basins (Guadalquivir, Guadiana and Tajo) which empty into the Atlantic on the western side of the Iberian Peninsula (see Fig. 1.6b). Furthermore, more migrants are seen to pass through the Straits of Gibraltar on days with easterly winds (Nisbet et al., 1961; Bernis, 1962; Hilgerloh, 1993), which would favour a drift of individuals towards the west. The early dates recorded in southwestern Iberia could be attributed to swallows wintering in that area, but their small numbers (Bernis, 1971; Cramp, 1988) make them irrelevant to the massive spring colonization of migrants each year. Some mountainous systems (Sierra Nevada and Iberian System, see Fig. 1.2) seem to act as effective barriers to the eastward migration of barn swallows across the Guadalquivir, Guadiana and Tajo basins. A direct crossing of the sea from North Africa to the southeastern Spanish Mediterranean coast does not seem to be undertaken by many individuals (Bernis, 1971, but see Glainville & Walker, 1962); the Straits of Gibraltar provides the main access to Europe for this species (Moreau, 1953; Bernis, 1962). As a consequence the colonization of southeastern Iberia is delayed despite its proximity to Gibraltar and early onset of conditions suitable for breeding. In the case of the common swift, this difference between arrival dates in western and eastern parts of the southern Iberian Peninsula is not so marked, though it also exists (see Fig. 1.6a). Probably the greater mobility of this species (Koskimies, 1947; Lack, 1955; Lack 1958; Bernis, 1970) helps it to more easily overcome geographical barriers. Such barriers limit pathways to spring breeding grounds and constrain the migratory patterns of our study species. The importance of the combination of
Migration of common swifts and barn swallows
89
altitude, distance to the Straits of Gibraltar and disposition of river basins implies that migration of these species through the Iberian Peninsula is partly determined by the location of the main dispersion routes to the most distant Iberian localities (Fig. 1.3). A single optimum pathway, the least costly route, could even be used by populations passing through the Iberian Peninsula migrating towards northern breeding areas. The first barn swallows arrive to their breeding grounds in southwestern UK during the last week of March (Huin & Sparks, 1998). By this date, only half of our study localities have received barn swallows (see Fig. 1.1b). Ringing recoveries demonstrate that British barn swallows pass through the Iberian Peninsula both in spring and autumn. Barn swallows migrating during the day and near the land surface, feeding on airborne insects, are easily observable. Hence, it is very unlikely that the observers from the Spanish phenological network skip over passing individuals. Therefore, early barn swallows from northern European populations must travel only through areas already colonized by Iberian breeders, where ecological conditions have become suitable for both reproduction and migration (Stresemann, 1948; Slagsvold, 1973). As we have shown, summer climate parameters seem to strongly influence arrival dates. This was unexpected, since summer conditions affect individuals only some months after their arrival to breeding grounds. However, summer climatic conditions in the Mediterranean region are of the most limiting ecological conditions for organisms (Richardson, 1965; Carbonell & Tellería, 1999; Garcia & Arroyo, 2001; Fortuna, 2003). Summer, and especially August, in most of the Iberian Peninsula is a difficult time for individual survival, as a result of high temperatures and scarce (or nonexistent) precipitations. The shape of the arrival date relationship with summer climate (see Fig. 1.4) reflects the occurrence of earlier arrival dates in areas with warmer and drier summers. This pattern can readily be seen to be due to the very temperate winters in these areas (Font Tullot, 1983) and, consequently, to ecological conditions suitable for reproduction at the beginning of the year (Isenmann et al., 1990; Sanz, 2002). Earlier arrival in such places would lessen individual exposure to
90
Chapter 1
life-threatening summer conditions, allowing them to profit from their precocity. However, the spatial constraint again comes to the fore in this context of temperatures. The southeastern corner of Spain exhibits similar temperature scores to the southwestern corner, but the latter is colonized about one month earlier. Such a difference in arrival times cannot be attributed to a later onset of the summer season in this region, but rather to the difficulty in reaching the southeast of the Iberian Peninsula from Gibraltar, the main point of access. The effect of this geographical asymmetry, and of its concomitant shorter period prior to the onset of summer conditions, on the reproduction of eastern populations should be of considerable interest. Earlier migration along the Atlantic Iberian coast is possible due to its mild climate and the particular spatial configuration of the Iberian Peninsula. Once individuals cross the sea from Africa to Europe, they find it easier to migrate upstream, along the Guadalquivir and Guadiana basins, than eastward, where the Sierra Nevada rises. Final model explanation, for both species, of only about half of the variability in observed arrival dates could be due to the conditions encountered by individuals during the non-breeding season (Marra et al., 1998; Sillett et al., 2000; Newton, 2006). Each Spanish population might overwinter in different African regions and/or reach the Iberian Peninsula by different routes. Hence, regardless of the similarity in environmental and geographical conditions between neighbouring Spanish localities, later arrivals observed at one locality could be due to population migration from more distant wintering quarters or to longer migratory routes. Unfortunately this hypothesis cannot be verified, since at present the precise location of the wintering quarters of Spanish common swift and barn swallow populations is unknown. There is no information on the whereabouts of the common swift outside of the breeding season. In the case of the barn swallow, ringing recoveries do not seem to support a clearly segregated wintering area for each population, nor even strong individual fidelity to the same wintering grounds (Loske, 1986; Møller & Hobson, 2004). In our opinion, the variability unexplained by models should be due mainly to the nature of data; first arrival dates are subject to several well-known biases (Sparks et al., 2001; Tryjanowsky et al., 2005). In our case, some of
Migration of common swifts and barn swallows
91
them (e.g., aberrant behaviour of first individuals) are absent from the median values per locality with which we worked. However, the density-dependence of the first arrival date cannot be tested because the number of breeding pairs in each study locality is unknown. Arrival dates for larger populations could be earlier than for smaller ones, as the probability of earlier observation increases with population size. Another potential problem comes from the number of records (i.e. years) per locality. As we explained, bias due to the number of records should not be cumulative, because localities were sampled randomly throughout the study period. However, a potentially large amount of noise is introduced into data. The probability of sampling in non-representative years (unusually late or early arrivals for given environmental and geographical conditions) increases as the number of records decreases. In conclusion, the first arrival date produces huge amounts of data from which to study migration through and colonization of large territories. Unfortunately, this measurement is subject to potential biases which reduce the resolution of results to that of broad patterns.
REFERENCES Anonymous. (1943) Atlas de plantas para las observaciones fenológicas. Servicio Meteorológico Nacional – Sección de Climatología, Madrid. Beklová M, Pikula J, Sabatka L (1983) Phenological maps of bird migration. Prirodovedne Prace Ustavu Ceskoslovenske Akademie Ved v Brne, 17, 1-48. Bernis F (1951) Sobre el Vencejo común, Micropus apus apus (L.) y su migración en España (especialmente España Central). Boletín de la Sociedad Española de Historia Natural, 49, 15-40. Bernis F (1962) Sobre migración de nuestros passeriformes transaharianos. Ardeola, 8, 41-119. Bernis F (1970) Aves migradoras ibéricas. Vol. II, Fasc. 6º. Sociedad Española de Ornitología, Madrid. Bernis F (1971) Aves migradoras ibéricas. Vol. II, Fasc. 7º y 8º. Sociedad Española de Ornitología, Madrid. Berthold P (1996) Control of bird migration. Chapman & Hall, London. Berthold P, Helbig AJ, Mohr G, Querner U (1992) Rapid microevolution of migratory behavior in a wild bird species. Nature, 360, 668-669. Birks HJB (1996) Statistical approaches to interpret diversity patterns in the Norwegian mountain flora. Ecography, 19, 332-340. Carbonell R, Tellería JL (1999) Feather traits and ptilochronology as indicators of stress in Iberian Blackcaps Sylvia atricapilla. Bird Study, 46, 243-248. Clark Labs (2000) Digital Elevation Model. Clark Labs, Worcester.
92
Chapter 1
Clark Labs (2001) Idrisi 32 Release 2. GIS software package. Clark Labs, Worcester. Cliff AD, Ord JK (1981) Spatial Processes. Models and Applications. Pion, London. Coppack T, Both C (2003) Predicting life-cycle adaptation of migratory birds to global climate change. Ardea, 90, 369-377. Cramp S (ed) (1985) The Birds of the Western Palaearctic, Vol. IV. Oxford University Press, Oxford. Cramp S (ed) (1988) The Birds of the Western Palaearctic, Vol. V. Oxford University Press, Oxford. Crick HQP (2004) The impact of climate change on birds. Ibis, 146, 48-56. De Smet WMA (1970) Studie over de trek van de Koekoek - Cuculus canorus L. Tweede deel: De lentetrek van de koekoek doorheen Europa. Ontleding van eigen gegevens. Gerfaut, 60, 148-187. Eastman JR (2001) Idrisi 32 release 2. Manual version 32.20. Clark University, Worcester. Font Tullot I (1983) Climatología de España y Portugal. Instituto Nacional de Meteorología, Madrid. Fortuna MA (2003) Dependencia hídrica de la comunidad ornítica acuática de la laguna de Manjavacas: la importancia de la desecación estival. Oxyura, 11, 85-98. García JT, Arroyo BE (2001) Effect of abiotic factors on reproduction in the centre and periphery of breeding ranges: A comparative analysis in sympatric harriers. Ecography, 24, 393402. García L (1963) La fenología. Boletín Climatológico Mensual - Febrero, 1963, 3-9. Glainville D, Walker C (1962) Migración primaveral en Almería, año 1960. Ardeola, 8, 131-141. Gordo O, Sanz JJ (2006) Climate change and bird phenology: a long-term study for the Iberian Peninsula. Global Change Biology, 12, 1993-2004. Grischtschenko V, Serebryakow V, Galinska I (1995) Phanologie des Weißstorchzuges (Ciconia ciconia) in der Ukraine. Vogelwarte, 38, 24-34. Grishchenko VN (2001) Phenology of autumn migration of the roller in Ukraine. Berkut, 10, 111114. Grishchenko VN (2002) Phenology of autumn migration of the hoopoe in Ukraine. Berkut, 11, 257-259. Grishchenko VN (2003) Timing of autumn departure of Swallows and Martins in Ukraine. Berkut, 12, 122-127. (in Russian). Gwinner E (1996). Circadian and circannual programmes in avian migration. Journal of Experimental Biology, 199, 39-48. Hilgerloh G (1993) Überqueren Transsaharazieher auf dem Frühjahrszug den Atlantik zwischen Marokko und Spanien? Journal für Ornithologie, 134, 447-452. Huin N, Sparks TH (1998) Arrival and progression of the swallow Hirundo rustica through Britain. Bird Study, 45, 361-370. Huin N, Sparks TH (1999). Spring arrival patterns of the Cuckoo Cuculus canorus, Nightingale Luscinia megarhynchos and Spotted Flycatcher Muscicapa striata in Britain. Bird Study, 47, 22-31. Isenmann P, Ales E, Moreno O (1990) The timing of breeding and clutch size of blue tits (Parus caeruleus) in an evergreen Holm oak habitat in southern Spain. La Terre et al Vie, 45, 177-181. Keitt TH, Bjørnstad ON, Dixon PM, Citron-Pousty S (2002) Accounting for spatial pattern when modelling organism-environment interactions. Ecography, 25, 616-625.
Migration of common swifts and barn swallows
93
Koskimies J (1947) On movements of the Swift, Micropus a. apus L., during the breeding season. Ornis Fennica, 24, 106-111. Lack D (1955) The summer movements of Swifts in England. Bird Study, 2, 32-40. Lack D (1958) Swifts over the sea at night. Weather movements of swifts 1955-1957. Bird Study, 5, 126-142. Lack D (1958) The return and departure of swifts Apus apus at Oxford. Ibis, 100, 477-502. Legendre P, Legendre L (1998) Numerical ecology. 2nd ed. Elsevier, Amsterdam. Lehikoinen A, Sparks TH, Zalakevicius M (2004) Arrival and departure dates. Advances in Ecological Research, 35, 1-31. Loske KH (1986) The origins of European swallows wintering in Namibia and Botswana. Ringing & Migration, 7, 119-122. MacNally R (2000) Regression and model-building in conservation biology, biogeography and ecology: the distinction between–and reconciliation of–‘predictive’ and ‘explanatory’ models. Biodiversity and Conservation, 9, 655-671. MacNally R (2002) Multiple regression and inference in ecology and conservation biology: Further comments on retention of independent variables. Biodiversity and Conservation, 11, 1397-1401. Marra PP, Hobson KA, Colmes RT (1998) Linking winter and summer events in a migratory bird by using stable-carbon isotopes. Science, 282, 1884-1886. Martí R, Del Moral JC (2003) Atlas de las aves reproductoras de España. Dirección General de Conservación de la Naturaleza-Sociedad Española de Ornitología, Madrid. Middendorff AT (1855) Die Isopiptesen Russlands. Grundlagen zur Erforschung der Zugzeiten und Zugrichtungen der Vögel Russlands. Mémories de l'Acádemie des Sciences de St Pétersbourg – VI Série Sciences Naturelles, 8, 1-143. Møller AP, Berthold P, Fiedler W (2004) The challenge of future research on climate change and avian biology. Advances in Ecological Research, 35, 237-245. Møller AP, Hobson KA (2004) Heterogeneity in stable isotope profiles predicts coexistence of populations of barn swallows Hirundo rustica differing in morphology and reproductive performance. Proceedings of the Royal Society of London-Series B, 271, 1355-1362. Moreau RE (1953) Migration in the Mediterranean area. Ibis, 95, 329-364. Moreau RE (1956) The Iberian Peninsula and migration. Bird Study, 3, 1-25. Moreau RE (1972) The Palaeartic-African bird migration systems. Academic Press, London. Munteanu D (1982) Migraţia de primavără a cucului Cuculus canorus L. (Cuculidae-Aves), în România. Studii si Cercetari de Biologie Seria Biologie Animala, 37, 18-21. Munteanu D, Maties M (1978) Migraţia de primavără a grangurului (Oriolus oriolus L.). Nymphaea, 6, 575-582. Newton I (2006) Can conditions experienced during migration limit the population levels of birds? Journal of Ornithology, 147, 146-166. Nisbet ICT, Evans PR, Feeny PP (1961) Migration from Morocco into Southwest Spain in relation to weather. Ibis, 103, 349-372. Pérez-Tris J, Santos T (2004) El estudio de la migración de aves en España: trayectoria histórica y perspectivas de futuro. Ardeola, 51, 71-89. Pulido F, Berthold P, Van Noordwick AJ (1996) Frequency of migrants and migratory activity are genetically correlated in a bird population: evolutionary implications. Proceedings of the National Academy of Sciences USA, 93, 14642-14647.
94
Chapter 1
Richardson F (1965) Variación anual de las poblaciones de aves de la "Rambla de Tartala" Almería (España). Ardeola, 10, 17-29. Sanz JJ (2002) Climate change and breeding parameters of great and blue tits throughout the western Palaeartic. Global Change Biology, 8, 408-422. Saunders H (1871) A list of the birds of Southern Spain. Ibis, 3(1), 205-225 Sawada M (1999) Rookcase: an Excel 97/2000 Visual Basic (VB) add-in for exploring global and local spatial autocorrelation. Bulletin of the Ecological Society of America, 80, 231234. Sillett TS, Holmes RT, Sherry TW (2000) Impacts of a global climate cycle on population dynamics of a migratory songbird. Science, 288, 2040-2042. Slagsvold T (1976) Arrival of birds from spring migration in relation to vegetational development. Norwegian Journal of Zoology, 24, 161-173. Sliwinsky U (1938) Isopiptesen einiger Vogelarten in Europa. Zoologica Poloniae, 2, 249-287. Southern HN (1938a) The spring migration of the swallow over Europe. British Birds, 32, 4-7. Southern HN (1938b) The spring migration of the willow-warbler over Europe. British Birds, 32, 202-206. Southern HN (1939) The spring migration of the redstart over Europe. British Birds, 33, 34-38. Southern HN (1940) The spring migration of the wood-warbler over Europe. British Birds, 34, 74-79. Southern HN (1941) The spring migration of the red-backed shrike over Europe. British Birds, 35, 114-119. Sparks TH, Bairlein F, Bojarinova JG, Hüppop O, Lehikoinen E, Rainio K, Sokolov LV, Walker D (2005) Examining the total arrival distribution of migratory birds. Global Change Biology, 11, 22-30. Sparks TH, Roberts DR, Crick HQP (2001) What is the value of first arrival dates of spring migrants in phenology? Avian Ecology and Behaviour, 7, 75-85. Spina F, Pilastro A (1998) Ecological, morphological and conservation aspects of spring songbird migration across the Mediterranean. Biologia e Conservazione della Fauna, 102, 63-71. StatSoft (2001). STATISTICA (data analysis software system), version 6 (www.statsoft.com). Stresemann E (1948) Die mittlere Erstankunft von Lanius collurio, Muscicapa striata, Oriolus oriolus u. Oenanthe oenanthe in europaischen Brutraum. Vår Fågelvärld, 7, 1-18. Tait W (1924) The birds of Portugal. Whiterby, London. Tryjanowski P, Kuźniak S, Sparks TH (2005) What affects the magnitude of change in first arrival dates of migrant birds? Journal of Ornithology, 146, 200-205. Zabłocka T (1959) Terminy przylotów bociana białego Ciconia ciconia (Linn.) w Polsce w latach 1946-1952. Acta Ornithologica, 5, 283-299.
RESUM Factors ambientals i geogràfics limitants en els patrons migratoris de falciots negres i orenetes vulgars a través de la Península Ibèrica Les principals rutes migratòries a través de la Península Ibèrica encara són desconegudes per a la majoria d’aus trans-saharianes, tot i el paper clau que té
Migration of common swifts and barn swallows
95
aquesta àrea en el sistema migratori europeu-africà. Es van descriure els patrons d’arribades per al falciot negre (Apus apus) i l’oreneta vulgar (Hirundo rustica) i van estudiar quins són els millors factors ambientals i geogràfics capaços d’explicar-los. Els nostre anàlisi va permetre buscar limitants ecològics en comú en dues espècies migratòries amb una morfologia i tipus de vol similars. Es van emprar 482 localitats per al falciot negre i 812 per a l’oreneta vulgar àmpliament distribuïdes per la Península Ibèrica. Rang latitudinal: 36.02ºN43.68ºN, rang longitudinal: 9.05ºW-3.17ºE, rang altitudinal: 0-1595 m. Es van utilitzar 3206 registres d e primeres arribades per al falciot negre i 6036 per a l’oreneta vulgar entre 1960 i 1990. Es van usar 40 variables predictives (de caire topogràfic, climàtic, conques del rius, geogràfic i espacial) en models generals de regressió (GRM). Els GRM van incloure termes polinomials fins al cub en totes aquelles variables on foren significatius. Es va aplicar selecció per passos fins obtenir models compostos només de termes significatius. Els GRM es van aplicar en dos fases. Primer es va buscar el millor model dintre de cada un dels tipus de variables esmentats anteriorment. Degut a que les variables predictives estan inevitablement correlacionades entre sí, la importància relativa de cadascuna d’elles es va determinar mitjançant una partició jeràrquica de la variança. Després vam cercar el model capaç d’explicar més quantitat de la variabilitat observada en les dates d’arribada. Per obtenir-lo, totes les variables significatives es van incloure en un únic model. Un cop obtingut, a més, es van afegir les variables de caire espacial per tal de tenir en compte qualsevol estructura espacial romanent a les dades. L’autocorrelació espacial es va avaluar mitjançant el coeficient I d’autocorrelació de Moran. Ambdues espècies van arribar abans a aquelles localitats amb estius més calorosos i secs prop de l’Estret de Gibraltar, el que correspon al sud-oest de la península. Els millors models per a cada tipus de variable van ser capaços d’explicar entre el 19 i el 47 % de la variabilitat en les dates d’arribada del falciot negre, i entre el 14 i el 44 % en les de l’oreneta vulgar. La partició de la variança va demostrar que les variables climàtiques i geogràfiques són les més explicatives. Els millors models predictius van explicar el 52 % de la variabilitat
96
Chapter 1
en les dates del falciot negre i el 50 % en l’oreneta vulgar. Ambdós models no van tenir residus espacialment autocorrelacionats, el que vol dir que no van deixar de banda cap mena de variabilitat estructurada espacialment. Podem concloure que la colonització primaveral depèn molt de la configuració geogràfica de la Península Ibèrica. L’Estret de Gibraltar actua com una mena d’embut pel qual passen la majoria dels individus que migren cap al nord. Des d’aquí la progressió de les espècies analitzades segueix un eix del sud-oest cap el nord-est degut a l’orientació de les conques dels principals rius ibèrics. Aquesta limitació obliga a ambdues espècies a convergir en un patró molt similar pel que fa a la seva migració pre-nupcial. Els falciots negres i les orenetes vulgars, per tant, s’han d’enfrontar a un trade-off imposat per l’existència d’unes les rutes òptimes per a la migració i la presència de condicions ecològiques adequades en els territoris de nidificació a l’inici de la temporada.
Chapter 2
Geographic variation in onset of singing among populations of two migratory birds
Oscar Gordo1,2, Juan José Sanz2, Jorge M. Lobo3 1
Departament de Biologia Animal (Vertebrats), Universitat de Barcelona.
2
Departamento de Ecología Evolutiva, Museo Nacional de Ciencias Naturales (CSIC).
3
Departamento de Biodiversidad y Biología Evolutiva, Museo Nacional de Ciencias Naturales (CSIC).
Auk (submitted)
100 Chapter 2
ABSTRACT Even though singing plays a major role in bird communication, environmental variables affecting the geographic patterns observed in the variation of singing onset within large areas have not previously been studied. The singing phenology of the cuckoo (Cuculus canorus) and the nightingale (Luscinia megarhynchos) recorded in thousands of sites throughout Spain was related to a set of potential predictors by partial least squares regression. Predictor variables (spatial, topography, basin, geographic, climate, abundance of species, vegetation productivity and land use) can affect first recorded singing dates in two ways: directly through individual decisions on singing activity and indirectly through spring migration route. Final model predictions indicated weak spatial structure in singing onset although well modelled by the environmental variables employed. Of the variables, climate was the most influential. Males of both species sing earlier in warmer and drier sites, which are closely related with geographic and topographic gradients in the Iberian Peninsula. Although some variables affected the singing activity of both species equally, final model predictions for the cuckoo, which colonizes most of Iberia in its first migratory wave, were quite different from predictions for the nightingale, which does so in its second migratory wave. In summary, the onset of singing of two migratory species, encountering very similar environmental conditions during nearly identical spring migratory periods, falls into different geographic patterns.
Geographic variation in singing onset
101
INTRODUCTION Birdsong is the major means of communication among birds (Kroodsma et al., 1982). At the beginning of the breeding season, males sing to attract potential mates as well as to establish and defend territories from competitors. The onset of birdsong is highly dependent on environmental conditions and this, in turn, affects later stages of the life cycle (Slagsvold, 1977; Hegelbach & Spaar, 2000). Migratory bird reproduction is constrained by the period of suitable ecological conditions in breeding grounds (Coppack & Both, 2002). In fact, migrant birds have a greater urgency to reach their breeding grounds earlier as possible due to the benefits of an early arrival (Møller, 1994; Kokko, 1999; Forstmeier, 2002). Singing is the only measurable observation possible for shier and more elusive species. Consequently, singing onset marks the annual spring arrival for many migrant birds most faithfully, although the date so derived may not entirely coincide with the date of arrival of the individual singer (Rendahl, 1965a; De Smet, 1967). Nevertheless, as singing is assumed to begin soon after arrival, spurred on by the reproduction urge of migrants, the measure of singing onset is assumed to reflect arrival date accurately enough (Slagsvold, 1977; Huin & Sparks, 2000). In any case, environmental variables can affect singing onset indirectly through time of colonization of breeding grounds, through spring migration timing, and directly through stimulus to singing, once individuals have arrived in breeding territories. Singing onset may then be influenced by individual characteristics (e.g., Ilyna & Ivankina, 2001), population density (e.g., Olinkiewicz & Osiejuk, 2003), weather variability (e.g., Lengagne & Slater, 2002) or habitat type (e.g., Doutrelant et al., 1999). Changes in singing activity can consequently affect the timing of detection of individuals in each population, since greater singing activity increases the chance of detection (De Smet, 1967; Sparks et al., 2001; Tryjanowski et al., 2005). Unfortunately, in some cases indirect and direct effects can be indistinguishable (e.g., bad weather both delays migration and also inhibits singing activity). Singing onset has been used in numerous studies as a measure of spring migratory phenology (e.g., Huin & Sparks, 2000). As far back as the
102 Chapter 2
nineteenth century, Middendorff (1855) used singing onset of the cuckoo Cuculus canorus to study the migratory progression of this species through Russia. In fact, the popularity of the cuckoo as the harbinger of spring in Europe probably led many other authors to follow in Middendorff’s footsteps (Angot, 1900; Brestcher, 1935; Sliwinsky, 1938; Verheyen, 1951; Bruns & Nocke, 1959; Rendahl, 1965a,b; De Smet, 1967; De Smet, 1970; Munteanu, 1982; Huin & Sparks, 2000). All of them took advantage of the popularity of this species among amateurs to compile huge amounts of first singing records in their countries. Unfortunately, these studies are purely descriptive and suffer from an exhaustive search into environmental factors behind the observed geographical patterns. Despite of the popularity of such migrants as the cuckoo, studies similar to those previously cited are lacking in the Iberian Peninsula for any species (Pérez-Tris & Santos, 2004). Moreover, the information available on any aspect of migration for Iberian populations is scarce or virtually absent in the case of most trans-Saharan bird species. As Iberian and North-African cuckoo populations belong to the subspecies bangsi, information available on other European populations may not be fully applicable. The too, information available on another popular migrant, the nightingale Luscinia megarhynchos, does not go beyond anecdotal singing-onset records for a few sites (Bernis, 1963; Fernández-Cruz & Sáez-Royuela, 1971) and some few ringing recoveries (Bueno, 1990). The aim of this study is to determine the geographic and environmental factors influencing spatial patterns of singing onset for the cuckoo and the nightingale in the Iberian Peninsula. The song of both species, common and widespread in the Iberian Peninsula (Martí & Del Moral, 2003), is easily detectable (Tryjanowski et al., 2005). Such shared features are very important because they could seriously bias phenologic measurements (De Smet, 1967; Sparks et al., 2001; Tryjanowski et al., 2005). Furthermore, both populations encounter similar ecological conditions during their nearly identical spring migration dates. However, these seem to be their only shared features, as the rest of their ecology and behaviour is completely different (Cramp, 1985;
Geographic variation in singing onset
103
Cramp, 1988). Therefore, they provide an ideal test of how a shared scenario (i.e. ecological conditions during the spring migration into Iberia) may have led to convergent or analogous migratory strategies, or, alternatively, how particular ecological requirements may have led to specific migratory strategies.
MATERIAL AND METHODS Bird phenological data Singing phenology data for the cuckoo and nightingale were obtained from the phenological database of the Spanish Instituto Nacional de Meteorología. This database is the result of a volunteer observer network set up several decades ago by the Instituto Nacional de Meteorología to better understand the timing of seasons and improve agricultural practices, as has been done in other European countries (e.g., UK; Huin & Sparks, 1998). Up to the present day, these volunteers have been recording selected phenological events, using standard observation rules, applied to a list of common species of plants and animals (Anon., 1943). Selected species characteristics, lending themselves to a phenological monitoring scheme, are: i) broad distribution throughout Spain (anyone can become a volunteer observer), ii) great abundance (observation of phenological events would not be constrained by number of individuals), iii) unmistakable morphology and/or behaviour (making the data highly reliable). Therefore, homogeneity of data is assured. Singing phenology of both species was measured as the date of singing onset for the first male in each study locality and year. All available records from 1945 to 2004 from original registers were collected and computerized to obtain a total of 8621 data from 898 localities (see Fig. 2.1). Dates were transformed to a Julian day scale (1 = first day of January), taking into account leap-years by adding 1 day after 28 February. Previous to analysis, we attempted to eliminate potential bias from long-term singing date trends in the UTM values recorded by regressing singing dates for both species with the year and its quadratic term. Residuals obtained were added to original data to remove temporal trends. Corrected dates were then used in all subsequent analyses.
104 Chapter 2
30 53
Records
5780
76
Localities
819
UTM
99
747
Mean ± SD 122
Number of UTM
145
95.72 ± 16.18
220 200 180 160 140 120 100 80 60 40 20 30
50
70
90
110
130
150
Median of singing onset date
a)
70 84
Records
2839
98
Localities
483
UTM
112
Mean ± SD 126
443 108.73 ± 12.48
160 140 Number of UTM
140
120 100 80 60 40 20 70
b)
80
90 100 110 120 130 140 150 Median of singing onset date
Figure 2.1 Interpolation map of singing onset for the cuckoo (a) and nightingale (b). Values only for those UTM cells where the species breed, according to Martí & Del Moral (2003). Black dots represent localities of the Spanish phenological network with records. Scale colour bar in Julian day (1 = 1 January). Details of number of records, localities, UTM cells, mean, standard deviation (SD) and histogram of the distribution of these observations are given for each species.
Geographic variation in singing onset
105
The median value of all records for the same UTM 100 km2 cell was calculated in both species (Fig. 2.1). As some phenological stations are located in the same UTM cell, the final number of records available for calculations (i.e. different UTM cells) was fewer than the number of original localities (see Fig. 2.1). Median values for each UTM cell could have been biased due to differing number of records. This possible dependence was tested for by means of Spearman correlations between mean values and number of records in each UTM cell (Cuckoo: rS = -0.005, P = 0.89; Nightingale: rS = -0.042, P = 0.38). As mean singing onset was not found to be dependent on the number of records, all UTM cells with available records for both species were used. Explanatory variables A total of 51 explanatory variables in eight categories were used to model singing phenology of the studied species (see Table 2.1). Five topographic and ten climatic variables were extracted for each one of the 100 km2 UTM Iberian squares (n=6063) using IDRISI 32 Geographic Information System (Clark Labs, 2001). Topographic variables were obtained from a Digital Elevation Model (Clark Labs, 2000). Mean altitude for all 100 pixels of 1 km2 in each 100 km2 UTM were used to calculate the altitude range in each cell from the maximum and minimum altitude values, together with the slope, aspect (the mean direction of the slope) and diversity of aspect for each UTM cell. Delayed singing onset is expected in more mountainous UTM cells (Angot, 1900; Bernis, 1970; Huin & Sparks, 2000). Climate variables were rainfall and mean temperatures during each of the seasons (spring, summer, autumn and winter), together with the annual temperature variation and an aridity index. The aridity index is expressed as: AI = 1/(P/T + 10) x 100 where P is the mean annual precipitation and T the mean annual temperature. All climate variables were provided by the Instituto Nacional de Meteorología. We expect certain collinearity in the effect of temperature and rainfall, since the warmest Iberian sites are also the driest. If a negative relationship with temperature is assumed (i.e., higher temperatures lead to earlier singing onset)
106 Chapter 2
Variables Spatial LAT LONG Topographic MEA AR SLP ASP DASP Basins CAN CAT DUE EBR GDN GDQ MIÑ SEG TAJ TUR Geographic DSG DIR CSG Climatic WIR SPR SUR AUR WIMET SPMET SUMET AUMET ATR AI Abundance P30 Vegetation productivity WINDVI SPNDVI SUNDVI AUNDVI Land Uses URB-IND DRY-CROP IRR-CROP VINE FRUIT OLIVE MOS-CROP CROP-NAT DEC-FOR CON-FOR MIX-FOR MOOR SCRUB TRANS-SF GRASS DIVSH
Description Latitude (m) Longitude (m) Mean altitude (m) Altitude range (m) Slope (degrees) Aspect (degrees) Diversity of aspects Cantabrica Catalana Duero Ebro Guadiana Guadalquivir Miño Segura Tajo Turia Distance to Straits of Gibraltar (km) Distance to rivers (km) Cost from Straits of Gibraltar Winter rainfall (L) Spring rainfall (L) Summer rainfall (L) Autumn rainfall (L) Winter mean temperature (ºC) Spring mean temperature (ºC) Summer mean temperature (ºC) Autumn mean temperature (ºC) Annual temperature range (ºC) Aridity index % of 10x10 km UTM where species is present in the 30x30 km area around it Winter NDVI (January, February, March) Spring NDVI (April, May, June) Summer NDVI (July, August, September) Autumn NDVI (October, November, December) Urbanized land (% cover) Non-irrigated arable crops (% cover) Irrigated arable crops (% cover) Vineyards (% cover) Fruit trees (% cover) Olive trees (% cover) Mosaic of mixed crops (% cover) Mosaic of crops and natural vegetation (% cover) Deciduous forests (% cover) Coniferous forests (% cover) Mixed deciduous and coniferous forests (% cover) Moorlands (% cover) Scrublands (% cover) Transition from scrubland to forest (% cover) Grasslands (% cover) Heterogeneity of landscapes (Shannon diversity index)
Table 2.1 List of variables used in analyses. The acronym, complete description and units (in brackets) are given for each.
Geographic variation in singing onset
107
as in previous studies (e.g., Slagsvold, 1977; but see De Smet, 1970), then the opposite correlation with rainfall would be expected (i.e., higher precipitation should lead to later singing onset). Three geographic variables were: the distance from each UTM cell to the Straits of Gibraltar; distance to the nearest major Iberian river; and cost of dispersion from the Straits of Gibraltar. We expect later singing onset for cuckoos and nightingales in sites far from Gibraltar reached by means of a costly arrival route. However, first-to-sing males would be heard earlier near major rivers, predicted to be natural migratory paths for spring colonization. Cost from the Straits of Gibraltar was calculated from a friction surface image (a variable reflecting impediment to or ease of movement) and the COSTGROW algorithm module of IDRISI 32 software (Eastman, 2001). The friction surface image was the product of altitude times the distance-to-river variables, which takes into account the variable effect of altitude (low-lying vs. higher valleys) on the probable natural routes of dispersion along major Iberian rivers. Altitude and distance to rivers were standardized before multiplying them. COSTGROW generates a cost surface measure of distance as the lowest cost in moving over a friction surface from an origin, in this case the Straits of Gibraltar pixel. This variable incorporates information on altitude, distance to rivers and distance to the Strait, representing the cost of dispersion from the Straits of Gibraltar along valleys used as migration routes. Information on the major Iberian river basins (Fig. 1.2) was included in the model as categorical predictors. A 0-1 code was assigned to all UTM cells in each basin. The Cantabrian basin was excluded from the analysis for the nightingale since this species does not occur there. Basins are a natural partitioning of territory and could be associated with regional differences in singing onset. A relative abundance index for both species was calculated for each 10x10 km UTM cell from the Spanish bird breeding atlas (Martí & Del Moral, 2003), to differentiate core (with supposed higher density of breeders) from marginal (lower density) distribution areas. Unfortunately, there are no measurements of absolute abundance for the whole of Spain, neither for the
108 Chapter 2
cuckoo nor for the nightingale. One may expect that population densities can affect singing behaviour (Sparks et al., 2001, Tryjanowski et al., 2005); the singing of a male can stimulate its neighbours (Olinkiewicz & Osiejuk, 2003), increasing overall singing activity in the given zone. This could result in earlier singing onset for core areas with a larger number of males, since increased singing activity should increase the opportunity for earlier recording. We have assumed that the main core and marginal areas have been consistently so throughout recent decades. Presence/absence data from the Spanish breeding atlas was used to count the number of 10x10 km UTM cells with presences in the surrounding 30x30 km square (range from 0 to 9). This value was divided by the number of available (i.e. terrestrial) UTM cells in the 30x30 km square to obtain the percentage of occupancy, thus distinguishing UTM cells completely surrounded by terrestrial cells from coastal and frontier cells surrounded by fewer than 9 terrestrial cells. Vegetation productivity was also evaluated as a possible explanatory variable for geographic patterns in the onset of singing of studied species. This variable could affect, on the one hand, the energy input to the ecosystem, and consequently the directly or indirectly dependent trophic levels, such as the abundance of available insects (the main food for these birds). Finally, population density may be affected, and this in turn can affect singing activity (see above). On the other hand, the seasonal spatial pattern of vegetation productivity in the Iberian Peninsula could constrain the beginning of the reproductive season of birds. In the case of cuckoo, such constraint would be exercised by their host species (Palomino et al., 1998; but see Rose, 1982). Migrant birds have adjusted their life cycle to match their arrival as closely as possible to the availability of suitable ecological conditions in breeding grounds (Coppack & Both, 2002). Since ecological conditions in spring become suitable at different times in different areas (e.g. northern vs southern sites, or valleys vs alpine areas), the beginning of reproduction also differs in time (Sanz, 1997; Fargallo, 2004). Therefore, one may expect that areas that become productive early in spring should be linked with early male singing activity.
Geographic variation in singing onset
109
Vegetation productivity was measured as the Normalized Vegetation Difference Index (NDVI). NDVI is the normalized difference between red (0.55– 0.68 µm) and infrared (0.73–1.1 µm) reflectance, measured by the Advanced Very High Resolution Radiometer (AVHRR) sensor of NOAA polar orbiting satellites (Smith et al., 1997). NDVI is determined by the degree of red wavelength absorption by chlorophyll, which is proportional to leaf chlorophyll density, and by reflectance of near infrared radiation, which is proportional to green leaf density (Tucker et al., 1985). Therefore, NDVI correlates well with such variables as green leaf biomass, leaf area index, total accumulated dry matter and annual net primary productivity (Nicholson et al., 1990). NDVI data, from Clark Labs world images, are average monthly values, 1982-2000, at a spatial resolution of 0.1 degree (Clark Labs, 2001). These maps were rescaled to our 10x10 km UTM grid for the Iberian Peninsula and afterwards combined in seasonal quarters. Land use types were also included because features of the environment may affect singing onset in two ways (Doutrelant et al., 1999; Partecke et al., 2004; Tryjanowski et al., 2005): on the one hand, habitat composition directly affects species presence and abundance, which in turn can affect singing activity (see above); on the other, environment type in each locality of the phenological network can affect species detectability (e.g. open habitats favour listening opportunities whereas dense forests do not). However these affects on record dates would probably be offset by the degree of detectability of our species, whose song is certainly among the loudest (Tryjanowski et al., 2005). The distribution of 15 land use types for the Iberian Peninsula was obtained from Corine Land Cover 2000 at a 100x100 m resolution (see Table 2.1). Land use based on present data may not necessarily be fully representative of use in past decades. The percentage of coverage of each category within each 10x10 km UTM cell was calculated and used as 15 predictor variables for analyses. A new variable measuring the heterogeneity of landscape was used to summarize variability of land use in each UTM cell, calculated as the Shannon diversity index.
110 Chapter 2
Finally, spatial variables, the central latitude and longitude of each UTM cell, were included in the analysis as a third degree polynomial (Trend Surface Analysis or TSA; see Legendre & Legendre, 1998). The nine terms of a TSA can help to incorporate the effects of other historical, biotic or environmental variables not otherwise taken into consideration (Legendre & Legendre, 1998). Latitude and longitude were standardized (mean=0 and standard deviation=1) as were topographic, climate, geographic and vegetation productivity variables, in order to eliminate their measurement scale effects. Statistical analyses Associations between environmental and geographic variables and singing onset were analyzed by means of univariate Partial Least Squares Regression (PLSR). This technique generalizes and combines principal component analysis and multiple regression features to model relationships between the dependent variable and explanatory variables (i.e., predictors). Particularly useful for a (very) large set of predictors, the PLSR combination copes with the multi-collinearity problem (Abdi, 2003). Original predictors are linearly combined to obtain components (like principal component analyses) that maximize the explained variance in the dependent variable (Garthwaite, 1994; Abdi, 2003). PLSR components are orthogonal (i.e., independent of each other), account for successively smaller proportions of variance explained by the original variables, and become the independent variable, on which singing onset depends. Regression is simplified by the reduction of the large original set of predictors to fewer components, which summarize the really relevant features of explanatory variables. The meaning of PLSR components was derived from significant correlations with the original variables. The significance level for all PLSR analyses was established as P < 0.001 to avoid spurious relationships due to the large number of correlations performed (Bonferroni correction αB = 0.05/58 ≈ 0.001). Since the variation explained by each successive component is smaller, relevant components (and consequently their number) in final models were limited to those significant at a previously-established significance level. Predicted scores from final PLSR models were mapped and examined for both species. All these analyses were conducted with STATISTICA (StatSoft, 2001).
Geographic variation in singing onset
111
To examine if singing dates predicted by PLSR models are spatially structured, Moran’s I autocorrelation coefficient with a Bonferroni-corrected significance level (Sawada, 1999) was calculated for ten classes with a lag distance of 60 km between 60 and 600 km. If regression analysis residuals are found to be spatially autocorrelated, one or several important spatially structured explanatory variables can be left out (Cliff & Ord, 1981; Legendre & Legendre, 1998; Keitt et al., 2002). These analyses were conducted with GS+ (Gamma Design Software, 2002).
RESULTS Cuckoo No evident geographic pattern in the map of dates interpolated between localities can be seen (Fig. 2.1a). Earlier singing onset seems to occur in the southern half of the Iberian Peninsula and also in northeast, and in the western part of the Duero basin (see Fig. 1.2). The latest dates were recorded in the Iberian Mountain System. The earliest and latest median singing onset dates were 29 January and 26 May (range of 118 days) and extend previously reported dates (Bernis, 1963; Bernis, 1970; Fernández-Cruz & Sáez-Royuela, 1971), as a result of the broader temporal and spatial range of our data. Data was approximately normal, very slightly skewed towards the left (Skewness = 0.416, P < 0.05). As the skewness of the distribution usually does not greatly affect estimates of parametric statistics (StatSoft, 2001), analyses were carried out on original, untransformed data. The final model obtained from the partial least squares regression (PLSR) accounted for more than 26% of geographic variability in the singing onset of this species throughout Spain (Table 2.2). The first model component, accounting for the major part of variability, related early singing onset to southern UTM cells, especially those located in the Guadiana basin, at low altitude, reached by a short and inexpensive pathway from the Straits of Gibraltar, with warmer temperatures throughout the year, lower rainfall during spring and summer and, consequently, low vegetation productivity during summer and autumn. These UTM cells also were surrounded by areas with low
112 Chapter 2
Variable LAT LAT2 LAT3 LONG LONG2 LONG3 LONGXLAT LONG2XLAT LAT2XLONG MEA AR ASP DASP SLP CAN CAT EBR DUE GDN GDQ MIÑ TAJ SEG TUR DSG DIR CSG WIP SPP SUP AUP WIMET SPMET SUMET AUMET ATR AI P30 WINDVI SPNDVI SUNDVI AUNDVI URB-IND DRY-CROP IRR-CROP VINE FRUIT OLIVE MOS-CROP CROP-NAT DEC-FOR CON-FOR MIX-FOR MOOR SCRUB TRANS-SF GRASS DIVSH R
2
Cuckoo Comp1 0.179 0.036 0.151 0.073 0.003 0.006 -0.044 0.047 0.017 0.209 0.129 -0.027 0.015 0.141 0.085 0.000 0.044 0.033 -0.191 -0.086 0.019 0.025 -0.046 0.053 0.188 0.131 0.237 0.088 0.170 0.221 0.140 -0.223 -0.288 -0.291 -0.280 -0.092 -0.218 0.202 0.032 0.119 0.188 0.144 -0.063 -0.099 -0.122 -0.050 -0.013 -0.084 -0.043 -0.053 0.108 0.085 0.028 0.128 0.080 0.133 0.000 0.114
Comp2 -0.066 -0.058 -0.079 0.242 -0.077 0.007 -0.046 -0.152 0.126 0.233 -0.013 -0.043 -0.037 -0.005 -0.055 -0.057 0.038 -0.017 -0.253 0.031 -0.133 0.141 0.057 0.182 0.005 0.232 0.381 -0.187 -0.113 -0.012 -0.142 -0.158 -0.178 -0.113 -0.164 0.067 0.045 0.194 -0.199 -0.186 -0.096 -0.108 -0.024 0.003 -0.114 0.038 0.102 0.010 -0.052 -0.122 -0.005 0.006 -0.128 -0.035 0.264 0.121 -0.101 0.130
Comp3 -0.069 0.180 -0.035 0.131 -0.082 -0.105 -0.229 -0.142 -0.115 -0.071 -0.159 -0.149 -0.024 -0.114 0.101 -0.071 -0.036 -0.218 -0.302 0.180 0.058 0.194 0.034 0.096 -0.008 0.112 0.229 -0.016 0.011 -0.018 0.017 0.162 0.031 -0.065 0.057 -0.207 0.002 0.235 -0.006 -0.099 -0.009 0.023 0.070 -0.087 -0.210 0.065 0.162 0.113 0.070 -0.048 0.072 -0.193 -0.020 0.074 0.219 0.086 -0.203 0.272
19.04
4.70
2.66
Nightingale Comp1 0.240 -0.228 0.275 0.146 0.046 0.042 -0.038 0.047 0.113 0.182 -0.057 -0.071 0.001 -0.061
Comp2 -0.027 -0.220 0.078 0.105 -0.064 -0.086 -0.224 -0.171 0.041 0.054 -0.097 -0.143 0.023 -0.108
Comp3 -0.064 -0.094 0.034 0.000 -0.043 -0.100 -0.225 -0.130 -0.058 0.034 0.072 -0.147 0.098 0.087
0.006 0.067 0.093 -0.112 -0.172 0.013 -0.052 -0.149 0.194 0.256 0.035 0.277 -0.132 0.028 0.216 -0.039 -0.248 -0.250 -0.243 -0.263 0.024 -0.048 -0.037 -0.117 0.009 0.055 -0.011 -0.119 0.072 -0.005 0.060 -0.088 -0.151 0.007 -0.088 -0.051 0.162 0.055 -0.036 0.001 0.169 -0.055 -0.002
-0.108 -0.044 -0.038 -0.052 -0.022 0.023 -0.075 -0.061 0.365 0.018 -0.037 0.168 -0.232 -0.179 -0.050 -0.216 -0.007 -0.021 -0.011 -0.024 0.020 0.197 -0.218 -0.212 -0.213 -0.198 -0.173 -0.142 0.064 0.054 0.146 -0.076 -0.074 0.073 -0.047 -0.164 0.159 -0.046 -0.231 0.042 0.181 -0.113 -0.021
-0.029 -0.155 -0.116 -0.025 0.174 0.213 -0.143 -0.168 0.378 -0.039 -0.153 0.035 0.080 0.089 0.007 0.064 0.073 -0.008 -0.055 0.005 -0.161 -0.009 -0.366 0.044 0.032 0.018 0.093 -0.230 -0.076 -0.004 0.169 -0.209 -0.022 -0.027 -0.029 0.040 0.259 0.036 -0.209 -0.038 0.258 -0.026 0.108
19.73
5.32
3.03
Table 2.2 Predictor weights in significant components (Comp’s 1 to 3) of the partial least squares regression models for the cuckoo and the nightingale. Significant associations between 2 predictors and components are in bold type (P < 0.001). The percentage of variance (R ) in the geographic pattern of population singing onset accounted for each by component is also shown.
Geographic variation in singing onset
113
occupancy rates, with extensive cropland cover (especially irrigated areas), and with little moorland or transitional areas from scrubland to forest. Climate contributed overwhelmingly to this component (Table 2.3). The second component (Table 2.2) associated delays in cuckoo singing onset with eastern localities from the Turia basin at high altitude and far from major rivers, with an expensive pathway from the Straits of Gibraltar, extensive scrubland cover or with transitional areas tending towards forest, high density of the species, low temperatures in most seasons, dry winters, and, consequently, winters and springs with low vegetation productivity. We want to stress the major relevance of the cost of migration from the Straits of Gibraltar, as reflected in the gradient of geographic and environmental conditions (Table 2.3). Finally, the third component (Table 2.2) associated delayed singing onset with eastern UTM cells with low altitude and temperature ranges, with northern exposure, with expensive pathways, milder winter temperatures, high density of individuals, and highly diverse landscapes with large scrubland and fruit tree cover, but little coniferous forest, grassland or other crops. Basins and land-use accounted for the major part of the variation explained by this component (Table 2.3).
Variables group Spatial Topographic Climatic Basins Geographic Abundance Vegetation productivity Land Uses
Cuckoo Comp1 Comp2 Comp3 6.57 11.97 15.94 8.12 5.79 6.61 45.64 17.08 7.89 6.00 14.73 23.90 10.86 19.92 6.52 4.06 3.75 5.51 7.12 9.51 1.05 11.63 17.24 32.57
Nightingale Comp1 Comp2 Comp3 22.72 15.89 9.70 4.52 4.50 4.52 32.18 17.53 5.28 11.80 16.16 30.60 14.37 3.01 2.61 0.14 4.74 13.37 1.69 15.95 1.20 12.59 22.24 32.71
Table 2.3 Percentage of variance (R2) in the geographic pattern of population singing onset accounted for by each type of variable in each component of the partial least squares regression models.
In the case of cuckoo, some explanatory variables appeared to be significantly linked to all components, in that they characterized the
114 Chapter 2
a)
b) 0.20 cuckoo
0.15
nightingale
Moran's I
0.10 0.05 0.00 -0.05 -0.10 -0.15 -0.20 0
c)
100
200
300
400
500
600
Sparation distance (Km)
Figure 2.2 Geographic distribution of residuals of partial least squares regression models for the cuckoo (a) and nightingale (b). Residuals are divided into four quartiles in which large white circles represent localities with high negative residuals (predicted scores higher than observed), and large black circles localities with high positive residuals. c) Spatial autocorrelation of residuals from partial least squares regression models. Isotropic correlograms represents the variation in the scores of Moran's I spatial autocorrelation statistic with increase in the separation distance between 10x10 km UTM cells (in km), using a lag distance of 60 km and an active lag of 600 km.
environmental gradients described by the three components in the same way, highlighting their relevance to cuckoo singing phenology. The Guadiana basin is a region where cuckoos sing early, while the species was heard later in those areas with low population density and far from the Straits of Gibraltar (Table 2.2). PLSR residuals were not significantly autocorrelated at any lag distance, an indication that no spatially structured variation remained to be included in the model (Fig. 2.2). Predictions from the PLSR model are mapped in Fig. 2.3a. The model predicts earliest singing onset in the Guadiana and Guadalquivir basins (in
Geographic variation in singing onset
115
purple). Afterwards, in a short interval of only 15 days (red to yellow), the cuckoo can be heard for the first time in the most part of Iberia, including all the southern half of Spain, most of the Ebro and Duero basins, and all of the Mediterranean coast. The cuckoo is heard much later (green) in the rest of the areas, which are associated mainly with mountainous regions and the north coast (see Fig. 1.2). Nightingale The picture obtained from the onset date interpolation between localities is not very clear (Fig. 2.1b). Earlier localities pop up throughout most of Spain, bereft of any obvious spatial pattern. The Turia basin was the only large area where nightingale singing onset was reported late, contrasting with an early zone in the south of Spain. The distribution of data was normal, with earliest and latest mean values (10 March and 24 May) also extending previously reported dates for this species (Bernis, 1963; Fernández-Cruz & Sáez-Royuela, 1971). The final model obtained from the PRLS analysis accounted for more variability of singing onset (up to 28%; Table 2.2) than in the case of the cuckoo. The first component explained more than 70% of total model variability. This component associated earlier singing onset with southern localities from the Guadalquivir basin at low altitude, with a short and relatively inexpensive pathway from the Straits of Gibraltar, mild temperatures throughout the year and dry summers, and sparse cover of coniferous forest or scrubland-to-forest transitional areas. Temperatures and latitude trend (both latitude and distance from Gibraltar) were the most relevant variables (Table 2.3). Both remaining components explained about 8% of spatial variability in singing onset for this species (Table 2.2). The second component associated later dates for singing onset detection with localities in the north-eastern corner of the Iberian Peninsula, especially in the Turia basin, with low vegetation productivity throughout the year as a result of low precipitation in most seasons, causing arid conditions. These localities had low nightingale densities and were dominated by coniferous forests and transitional areas from scrubland to forest with absence of deciduous forests and moorlands. Finally, the meaning of the
116 Chapter 2
70 80 90 100 110 120
a)
80 90 100 110 120 130
b) Figure 2.3 Geographic representation of predicted scores for 10x10 km UTM cells from the partial least squares regression models for (a) the cuckoo and (b) nightingale. Scale colour bar in Julian day (1 = 1 January).
Geographic variation in singing onset
117
third component was less clear. It related delayed singing onset with localities from the north-eastern corner of the Iberian Peninsula and the Turia basin with low densities of pairs of this species and little human influence, and with extensive vineyard cover and few fruit trees. This component also related delayed singing onset with sites with coniferous forest cover, and with transition from scrubland to forest, and with several basins. Residual scores were not significantly spatially autocorrelated (Fig. 2.2b). The meaning of the components can be seen much more clearly in Fig. 2.3b. Model predictions of singing onset appear in a more spatially structured pattern than do field observations (Fig. 2.1b). The areas where nightingales are heard earliest (purple in Fig. 2.3b) are those located near the Straits of Gibraltar. Afterwards (red and yellow), males singing first are heard in southwestern Iberia, and in a narrow strip along the entire Mediterranean coast. Finally, the major part of Iberia can be reached in a very short interval of 10 days (110-120), leaving a highly delayed zone in only the Turia basin, the Iberian Mountain System and the Pyrenees.
DISCUSSION Final partial least squares regression models for both species moderately explained the variability in singing onset. A look at maps of interpolated field data (see Fig. 2.1) reveals a complicated picture for both species, making modelling difficulties not surprising a priori. But the complete absence of residual spatial autocorrelation (see Fig. 2.2) is an indication that probably no other variables, on our working scale, would help to improve model predictions. Therefore, we can conclude that at least in the Iberian Peninsula, population differences in singing onset phenology are spatially structured, although weakly, and caused by environmental factors. In spite of these difficulties, models can help to considerably clarify the complicated picture offered by raw data (see Fig. 2.1), by revealing subtle underlying patterns. Climate appears as the most important type of variable influencing variability in singing onset among populations of both species. Individuals singing earliest are heard in the warmest and driest regions of Iberia
118 Chapter 2
(see Fig. 2.4). This, in turn, is closely related to the effect of other variables. Altitude is related positively in all cases (i.e., later detection in more elevated zones), in agreement with predictions (Angot, 1900; Bernis, 1970; Huin & Sparks, 2000). A marked latitude gradient (i.e., later in northern sites), measured both as latitude and as distance from the Straits of Gibraltar, was especially relevant for the nightingale. This result was also to be expected (Bernis, 1970; Sanz, 1997; Fargallo, 2004). Moreover, the cost of migration from Gibraltar also appeared as highly explicative, but in this case especially relevant for the cuckoo. The warmest and driest Iberian regions’ location in the south, at low altitudes, near the Straits of Gibraltar, leads to the pronounced collinearity of these variables, well-summarized by the environmental dependence defined by the first component in both species. We would like to stress the part played by other variables with more specific effects. Some basins were strongly and consistently associated with phenology. In the case of the cuckoo, the small populations from the Guadiana basin sing markedly earlier than the rest of Spanish populations. In the case of the nightingale, the effect of the Turia basin was even stronger, although in this case populations in this basin stood out due to their late singing phenology. Overall, vegetation productivity and land use were not highly relevant. This is especially disappointing in the case of land use, where a multitude of variables was introduced in models, but few were strongly related with the principal environmental gradients described by components. In the case of the cuckoo, their song seemed to be heard earlier in areas with any type of crop cover (negative sign in all types of cover in the first component; see Fig. 2.5). This relationship remains little changed by the
removal by trend surface
analysis of spatial structure in the onset of cuckoo singing (Legendre & Legendre, 1998; see Fig. 2.5), which would be in agreement with supposed earlier detection in more frequented habitats (De Smet, 1967; Sparks et al., 2001, Tryjanowski et al., 2005). The influence of the relative abundance index on the cuckoo was noteworthy, even though it accounted for little total variability in each component (4-5%). The sign of the relationship for the cuckoo confounded
Geographic variation in singing onset
160
Cuckoo
Median of singing onset date
Median of singing onset date
160
119
140 120 100 80 60 40
Nightingale 140 120 100 80 60 40
-3
-2
-1 0 Spring temperature
1
2
-3
-2
-1 0 Spring temperature
1
2
Figure 2.4 Relationship between singing dates and mean spring temperature in the 10x10 km UTMs for the cuckoo (n=747) and nightingale (n=453). Solid line represents the best linear-fit model.
predictions, since earlier onset was expected in areas with denser populations, where chances for earlier detection should be greatest (Sparks et al., 2001; Tryjanowski & Sparks, 2001; Tryjanowski et al., 2005). This finding verifies absence of bias towards early detection in more densely populated sites, and thus data reliability. Singing onset in core and densely populated areas with ecological conditions optimum for this species may be delayed by their distance from Gibraltar and by a later arrival of spring weather. Early singing onset in sparsely populated areas may also be linked with the specific reproduction method of the cuckoo, involving the parasitic use of other bird species nests (Cramp, 1985). While their potential host spectrum is broad, the cuckoo lays its invading egg only in nests of those host species with greatest abundance of breeding pairs in a given region (Soler et al., 1999; Álvarez, 2003; Reichholf, 2005). Iberian areas, sparsely populated or unpopulated by cuckoos (see Fig. 2.1a), are mainly those with little abundance, or even absence, of host breeder pairs (e.g., wren Troglodytes troglodytes, dunnock Prunella modullaris, rufous bush robin Cercotrichas galactotes, or robin Erithacus rubecula). These regions, sparsely populated by cuckoos, were already identified several decades ago (Bernis, 1970). Hence, we are confident that empty cells are not an artefact due to distribution retreat during recent decades. In areas with a low density of potential host pairs, we suggest that cuckoos suffer from increased intraspecific competition. The favourability for cuckoo reproductive success of an
120 Chapter 2
Residual of singing onset date
Median singing onset date
105 102 99 96 93 90 87 84 0.1 0.2 0.3 0.4 0.5 0.6 0.7 0.8 0.9 Croplands cover
10 8 6 4 2 0 -2 -4 -6 -8 -10 -12 -14
0.1 0.2 0.3 0.4 0.5 0.6 0.7 0.8 0.9 Croplands cover
Figure 2.5 Mean and residual from a trend surface analysis of singing onset in the 10x10 km UTM cells for the cuckoo (n=747), according to percentage of cover provided by all types of crops (sum of the variables urb-ind, dry-crop, irr-crop, vine, fruit, olive, mos-crop and crop-nat, see Table 1). Bars indicate standard error.
early spring arrival, when non-parasitized nests would still be available in largest number, would seem obvious (Palomino et al., 1998; Soler et al., 1999). Therefore, in this situation, selective pressure for earlier arrivals would be high. Since cuckoos are strongly phylopatric, this situation could be maintained over time. Unfortunately, neither precise information on host reproductive phenology, nor the parasitism rate for each population in a comparable geographic range is lacking. As we have seen, there are some common patterns in singing onset variability among populations of both species, which can be summarized as: 1) singing onset occurs in the Iberian System, Pyrenees and the Turia basin later than in the rest of Spain. Cost of dispersion from the Straits of Gibraltar and altitude are mainly responsible for onset delay in these areas, mountainous or the most expensive to reach. 2) Singing onset occurs earliest in the SW corner of Iberia, close to Gibraltar, easily accessible, and with mild climate at winter’s end. 3) Singing onset occurs early along the Mediterranean coast, thanks to its milder, seaside climate. The spatial configuration of the Iberian Peninsula imposes unavoidable constraints that condition these common geographic pattern features. In addition, specific environmental variable influence on each species modifies this spatial pattern in singing onset in the Iberia Peninsula quite differently for each.
Geographic variation in singing onset
121
The cuckoo sings early (first migratory wave) in the southern half of Iberia, and in other Ebro and Duero basin areas (Fig. 2.3a), whereas nightingale migration takes place as a timid first wave (purple and red areas in Fig. 2.3b) mainly in the south-western corner of Iberia. In a second wave (yellow to green colours in Fig. 2.3) the cuckoo reaches only a minor portion of Iberia, especially mountainous regions, whereas the nightingale appears in most parts of Spain. Singing onset variability was low in the major part of the Iberian Peninsula. The standard deviation in both species was about 15 days, whereas it is ca. 25 days for the swallow and the swift in the same area and years (unpublished author’s data). In fact, final models predicted a range of singing onset, between the earliest and latest dates shorter than two months. Moreover, final maps (Fig 4) show that singing males are first detected in most parts of Spain with a variation of approximately 15 days (between March 20-April 5 for the cuckoo and April 15-30 for the nightingale). However, it is interesting to note again that this pattern is reversed for the two species. Iberia is colonized by the cuckoo mainly in its first migratory wave, whereas the nightingale does so in a second and later wave.
REFERENCES Abdi H (2003) Partial Least Square (PLS) regression. In: Encyclopedia of social sciences research methods (eds Lewis-Beck M, Bryman A, Futing T). Sage, Thousand Oaks. Álvarez F (2003) Parasitism rate by the Common Cuckoo Cuculus canorus increases with high density of host's breeding pairs. Ornis Fennica, 80, 193-196. Angot CA (1900) Études sur les migrations des oiseaux en France. Époques du premier chant du coucou. Annales Bureau Central Météorologique de France, Memóries. Anneé 1898, 121-170. Anonymous (1943) Atlas de plantas para las observaciones fenológicas. Madrid: Servicio Meteorológico Nacional-Sección de Climatología. Bernis F (1963) Del noticiero fenológico 1961 y 1962 selección de aves migrantes y estivales. Ardeola, 8, 151-188. Bernis F (1970) Aves migradoras ibéricas. Vol. II, Fasc. 6º. Sociedad Española de Ornitología, Madrid. Bretscher K (1935) Der Frühlingszug des Kuckucks in Mittleren Europa. Vogelzug, 7, 53-54. Bruns H, Nocke H (1959) Die Erstankunft des Kuckucks (Cuculus canorus) in Deutschland 1948-1957. Ornithologische Mitteilungen, 11, 70-78. Bueno JM (1990) Migración e invernada de pequeños turdinos en la Península Ibérica. I. Pechiazul (Luscinia svecica) y Ruiseñor Común (Luscinia megarhynchos). Ardeola, 37, 67-73.
122 Chapter 2
Clark Labs (2000) Digital Elevation Model. Clark Labs, Worcester. Clark Labs (2001) 0.1 Degree Global Monthly Vegetation Index (NDVI) 1981-2000. Clark Labs, Worcester. Clark Labs (2001) Idrisi 32 Release 2. GIS software package. Clark Labs, Worcester. Cliff AD, Ord JK (1981) Spatial Processes. Models and Applications. Pion, London. Coppack T, Both C (2002) Predicting life-cycle adaptation of migratory birds to global climate change. Ardea, 90, 369-377. Cramp S (ed) (1985) The birds of the western Palaearctic. Vol 4. Oxford University Press, Oxford. Cramp S (ed) (1988) The birds of the western Palaearctic. Vol 5. Oxford University Press, Oxford. De Smet WMA (1967) Studie over de trek van de Koekoek - Cuculus canorus L. Eerste deel: Beschouwingen over de waarde van de aankomstdata. Gerfaut, 57, 50-76. De Smet WMA (1970) Studie over de trek van de Koekoek - Cuculus canorus L. Tweede deel: De lentetrek van de koekoek doorheen Europa. Ontleding van eigen gegevens. Gerfaut, 60, 148-187. Doutrelant C, Leitao A, Giorgi H, Lambrechts MM (1999) Geographic variation in blue tit song, the result of an adjustment to vegetation type? Behaviour, 136, 481-493 Eastman JR (2001) Idrisi 32 release 2. Manual version 32.20. Clark Labs, Worcester. Fargallo JA (2004) Latitudinal trends of reproductive traits in the blue tits Parus caeruleus. Ardeola, 51, 177-190 Fernández-Cruz M, Sáez-Royuela R (1971) Comisión de fenología: encuesta sobre primeras llegadas y paso primaveral (año 1970). Ardeola, 15, 51-78. Forstmeier W (2002) Benefits of early arrival at breeding grounds vary between males. Journal of Animal Ecology, 71, 1-9. Gamma Design Software (2002) GS+ Geostatistics for Environmental Sciences, version 5.3.2. www.gammadesign.com. Garthwaite PH (1994) An interpretation of partial least-squares. Journal of the American Statistical Association, 89, 122-127. Hegelbach J, Spaar R (2000) Annual variation in singing activity of the Song Thrush (Turdus philomelos), with comments on high postbreeding song output. Journal für Ornithologie, 141, 425-434. Huin N, Sparks TH (1998) Arrival and progression of the swallow Hirundo rustica through Britain. Bird Study, 45, 361-370. Huin N, Sparks TH (2000) Spring arrival patterns of the Cuckoo Cuculus canorus, Nightingale Luscinia megarhynchos and Spotted Flycatcher Muscicapa striata in Britain. Bird Study, 47, 22-31. Ilyna TA, Ivankina EV (2001) Seasonal variation of singing activity and relative effect of the advertising behaviour of males with different plumage colour in the pied flycatcher Ficedula hypoleuca. Acta Ornithologica, 36, 85-89. Keitt TH, Bjørnstad ON, Dixon PM, Citron-Pousty S (2002) Accounting for spatial pattern when modelling organism-environment interactions. Ecography, 25, 616-625. Kokko H (1999) Competition for early arrival in migratory birds. Journal of Animal Ecology, 68, 940-950. Kroodsma E, Miller EH, Ouellet H (1982) Acoustic communication in birds. Academic Press, New York.
Geographic variation in singing onset
123
Legendre P, Legendre L (1998) Numerical ecology. 2nd ed. Elsevier, Amsterdam. Lengagne T, Slater PJB (2002) The effects of rain on acoustic communication: Tawny owls have good reason for calling less in wet weather. Proceedings of the Royal Society of London-Series B, 269, 2121-2125. Martí R, Del Moral JC (2003) Atlas de las aves reproductoras de España. Dirección General de Conservación de la Naturaleza-Sociedad Española de Ornitología, Madrid. Middendorff AT (1855) Die Isopiptesen Russlands. Grundlagen zur Erforschung der Zugzeiten und Zugrichtungen der Vögel Russlands. Mémories de l'Acádemie des Sciences de St Pétersbourg – VI Série Sciences Naturelles, 8, 1-143. Møller AP (1994) Phenotype-dependent arrival time and its consequences in a migratory bird. Behavioural Ecology and Sociobiology, 35, 115-122. Munteanu D (1982) Migraţia de primavără a cucului Cuculus canorus L. (Cuculidae-Aves), în România. Studii si Cercetari de Biologie Seria Biologie Animala, 37, 18-21. Nicholson SE, Davenport ML, Malo AR (1990) A comparison of the vegetation response to rainfall in the Sahel and east Africa, using normalized difference vegetation index from NOAA AVHRR. Climatic Change, 17, 209-241. Olinkiewicz A, Osiejuk TS (2003) Effect of time of season and neighbours on singing activity in the Corn Bunting Miliaria calandra. Acta Ornithologica, 38, 117-122. Palomino JJ, Martín-Vivaldi M, Soler M (1998) Early arrival is not advantageous for rufous bushrobins parasitized by common cuckoos. Auk, 115, 235-239. Partecke J, Van't Hof T, Gwinner E (2004) Differences in the timing of reproduction between urban and forest European blackbirds (Turdus merula): result of phenotypic flexibility or genetic differences? Proceedings of the Royal Society of London-Series B, 271, 19952001. Pérez-Tris J, Santos T (2004) El estudio de la migración de aves en España: trayectoria histórica y perspectivas de futuro. Ardeola, 51, 71-89. Reichholf JH (2005) Der kuckuck Cuculus canorus an Isar und Inn: rufaktivitaet, wirtsartenwahl, haeufigkeit und trend. Ornithologische Mitteilungen, 57, 290-300. Rendahl H (1965a). Die Frühlingsankunft des Kuckucks (Cuculus canorus) L. in Schweden. Arkiv för Zoologi, 17, 373-413. Rendahl H (1965b) Zur Frage der Frühlingsankunft des Kuckucks (Cuculus canorus) L. in Frankreich. Arkiv för Zoologi, 17, 475-535. Rose LN (1982) Breeding ecology of British pipits and their cuckoo parasite. Bird Study, 29, 2740. Sanz JJ (1997) Geographic variation in breeding parameters of the Pied Flycatcher Ficedula hypoleuca. Ibis, 139, 107-114. Sawada M (1999) Rookcase: an Excel 97/2000 Visual Basic (VB) add-in for exploring global and local spatial autocorrelation. Bulletin of the Ecological Society of America, 80, 231234. Slagsvold T (1977) Bird song activity in relation to breeding cycle, spring weather, and environmental phenology. Ornis Scandinavica, 8, 197-222. Sliwinksky U (1938) Isopiptesen einiger Vogelarten in Europa. Zoologica Poloniae, 2, 249-287. Smith PM, Kalluri SNV, Prince SD, DeFries R (1997) The NOAA/NASA Pathfinder AVHRR 8-km land data set. Photogrammetric Engineering and Remote Sensing, 68, 12-32. Soler JJ, Møller AP, Soler M (1999) A comparative study of host selection in the European cuckoo Cuculus canorus. Oecologia, 118, 265-276.
124 Chapter 2
Sparks TH, Roberts DR, Crick HQP (2001) What is the value of first arrival dates of spring migrants in phenology? Avian Ecology and Behaviour, 7, 75-85. StatSoft (2001) STATISTICA, version 6. www.statsoft.com. Tryjanowski P, Kuźniak S, Sparks TH (2005) What affects the magnitude of change in first arrival dates of migrant birds? Journal of Ornithology, 146, 200-205. Tryjanowski P, Sparks TH (2001) Is the detection of the first arrival date of migrating birds influenced by population size? A case study of the red-backed shrike Lanius collurio. International Journal of Biometeorology, 45, 217-219. Tucker CJ, Townshend JRG, Goff TE (1985) African land-cover classification using satellite data. Science, 227, 369-375. Verheyen R (1951) Particularités relatives à la migration et au quartier d'hiver du coucou d'Europe (Cuculus canorus L.). Gerfaut, 41, 44-61.
RESUM Variació geogràfica de les dates d’inici del cant entre poblacions en dos aus migratòries Tot i que el cant juga un paper fonamental en la comunicació de les aus, encara no s’ha estudiat quines són les variables ambientals que determinen la variació geogràfica observable en les dates d’inici del cant per àrees extenses. Es va relacionar la fenologia de cant del cucut (Cuculus canorus) i del rossinyol (Luscinia megarhynchos) enregistrada en centenars de localitats de tota Espanya amb un conjunt de predictors potencials mitjançant la regressió de mínims quadrats parcials. Les variables predictives (de caire espacial, topogràfic, conques de rius, geogràfic, climàtic, abundància de les espècies, producció vegetal i usos del sòl) poden afectar les dates de primer cant de dues maneres: directament a través de les decisions individuals sobre el cant o indirectament a través de la ruta migratòria primaveral. Els models finals van tenir un poder explicatiu moderat, el que seria indicatiu de l’absència d’una forta estructura espacial de l’inici del cant. De les variables predictives, el clima va ser el factor amb més influència. Els mascles d’ambdues espècies canten abans en àrees caloroses y seques, el que està molt lligat a d’altres gradients geogràfics i topogràfics de la Península Ibèrica. Encara que algunes variables van afectar igualment a les dues espècies, les prediccions finals del model pel cucut van ser diferents de les del rossinyol. El primer colonitza la península en una primera onada migratòria mentre que el segon ho fa en una segona onada. En resum, l’inici del cant en aquestes dues espècies, que troben condicions
Geographic variation in singing onset
125
ecològiques semblants a la península degut a que tenen fenologies d’inici del cant similars, mostra patrons geogràfics diferents.
Chapter 3
Spatial patterns of white stork migratory phenology in the Iberian Peninsula
Oscar Gordo1,2, Juan José Sanz2, Jorge M. Lobo3 1
Departament de Biologia Animal (Vertebrats), Universitat de Barcelona.
2
Departamento de Ecología Evolutiva, Museo Nacional de Ciencias Naturales (CSIC).
3
Departamento de Biodiversidad y Biología Evolutiva, Museo Nacional de Ciencias Naturales (CSIC).
Journal of Ornithology (submitted)
128 Chapter 3
ABSTRACT Oppositely to the attention attracted by temporal trends of phenology, the spatial patterns of arrivals, departures or stays of trans-Saharan birds are still nowadays largely unknown in most of their European breeding areas. In the case of the white stork Ciconia ciconia, some studies have attempted to describe its migratory patterns but, to our knowledge, no one has related these patterns to some kind of variable to offer an ecological-based explanation to the heterogeneous phenology observable among populations. Here, arrival, departures and stays of this species recorded in hundreds of Spanish localities were related to a set of environmental, geographical, biological and spatial predictors and modelled by multiple regression. The best model for arrival dates accounted up to 34% of variability of data and pointed towards an earlier arrival in those populations located in south-western Iberia and with higher population densities. This last relationship is probably due to the competition for nest-site fidelity maintenance. However, no variable was able to explain well the blurred spatial pattern recorded for departure dates. Departure decisions are strongly influenced by social behaviours in this species dependent on collective decisions influenced by peculiar local environmental conditions of each year rather than macrogeographic gradients. Environmental, geographical or spatial variables did not capture either much of the observed variability in the length of the stays among populations. However, this variable was strongly related to the arrival and departure dates of populations. White storks stay longer in localities with earlier arrivals and, especially, later departures.
Spatial patterns of white stork phenology
129
INTRODUCTION Phenology has received much attention in recent years thanks to its demonstrated ability to ascertain the effects of climatic fluctuations on organisms (Sparks & Crick, 1999; Sparks & Menzel, 2002; Sparks & Smithers, 2002). Particularly, birds has become one of the most employed bioindicators (Sanz, 2002; Crick, 2004; Lehikoinen et al., 2004) thanks to its exhaustive monitoring both among investigators and amateurs (Whitfield, 2001; Collison & Sparks, 2003), which has allow the compilation of large databases for any sort of biological parameter (Sparks & Crick, 1999; Gibbons, 2000; Svensson, 2000; Collison & Sparks, 2003; Crick et al., 2003). A growing number of studies have reported long-term temporal changes in several ecological parameters in accordance with the hypothetical effects of recent climate change (Walther et al., 2002; Parmesan & Yohe, 2003; Root et al., 2003). In opposition to this interest for its temporal fluctuations, few studies have paid attention to the spatial aspect of phenology (e.g. Rötzer & Chmielewski, 2002). When we focus on bird migration, this difference between time and space became even more disconcerting. The description of the spatial bird colonization patterns during spring migration was of great concern for some authors in the past century. This interest culminated in several studies for the commonest migratory species in some countries (e.g., Middendorff, 1855) or even for the whole European continent (e.g., Sliwinsky, 1938; Southern, 1938; Stresemann, 1948; De Smet, 1970). However, this topic was virtually forgotten in Western Europe during the last decades and only recently reassessed (e.g. Huin & Sparks, 1998, 2000). The situation is even worst for the Iberian Peninsula due to the absence of data when previously mentioned panEuropean studies were carried out (Sliwinsky, 1938), making absolutely novel any report in this issue (Pérez-Tris & Santos, 2004). Arrival and departure of migratory birds seem so obvious phenomena that nobody has wasted its time in an accurate and comprehensive description of its geographical patterns and as consequence this matter has remained unexplored until nowadays for most of species in many areas. To record, for example, the arrival date of a migrant bird is a very simple measurement.
130 Chapter 3
However, the necessity of a huge number of data to cover an area with a dense network of observations is difficult to reach, especially if no volunteers are involved (Sparks & Crick, 1999). At present, the easy and simple approach to record the timing of bird migration by the observation of arrival and departure date remains equally valid as one century ago. Moreover, new and powerful analytical tools (e.g. GIS software) allow to investigators offer more thorough responses with this same kind of data. The white stork (Ciconia ciconia) has been a classical study subject in bird migration. In the case of migratory phenology, this species shows many advantages to be included in a volunteer-based monitoring scheme. It is common (at least in some European countries), conspicuous (e.g. by using human building in lot of cases to bred their nests) and unmistakable (anyone knows how a white stork is). Therefore it is very easy to monitor with a minimal potential biases (Tryjanowski et al., 2004; Tryjanowski et al., 2005). There were some studies along the 20th century that described the geographical patterns of its migratory phenology (Sliwinsky, 1938; Zabłocka, 1959; Jespersen, 1949; Panouse, 1949; Grishchenko, 1995). Sliwinsky stressed specifically already in 1930s the absolute absence of data for the Spanish and Portuguese populations in spite of their numerical importance. This fact resulted in a partial picture of the migratory patterns for Europe because her maps did not included Iberian populations. All previously cited studies focussed on the description of spatial patterns of colonization and abandonment of breeding areas by white storks but suffer from an ecological-based explanation of these observed patterns since they did not relate phenology with any environmental variable. Therefore, there is still an empty space in the knowledge about the environmental variables related to the spring and autumn migratory phenology of the white stork. Variability in timing on arrival and departures due to the spatial configuration of territories affects in turn the calendar of the rest of lifecycle events such as laying and fledging dates (Slagsvold, 1977). Like in the inter-individual variability for the same population, this fact could be potentially reflected in a different reproduction success for each population (Lázaro et al., 1986; Nowakowski, 2003; Tryjanowski et al., 2005). This wins interest in a
Spatial patterns of white stork phenology
131
species that showed strong fluctuations along the last century in their numbers with serious implications for its conservation status (Bernis, 1981; Dallinga & Schoenmakers, 1987; Bairlein, 1991). The aim of this study is to describe the geographical patterns of colonization during the spring, the abandonment during the autumn, and the variability in the length of the stay of the white stork populations from Spain. Furthermore, we searched for the underlying environmental variables to these spatial patterns to offer an explanation under an evolutionary ecology perspective of the observed variability in phenology among populations.
MATERIAL AND METHODS White stork phenological data Migratory phenology data were obtained from the phenological database of the Spanish Instituto Nacional de Meteorología. This database results from a volunteer observer network created several decades before by the Instituto Nacional de Meteorología. These volunteers are recording since 1944 the arrival and departure dates of the white stork populations breeding in their home cities or towns in Spain. This species is especially appropriate for a long-term monitoring purpose based on volunteers thanks to use man-made structures for construction of its large and conspicuous nests (Lázaro et al., 1986; Tryjanowski et al., 2004; Molina & Del Moral, 2005). Furthermore, it is basically a gregarious species, commonly feeding in groups (Alonso et al., 1994; Mullié et al., 1995) and nesting colonially (Molina & Del Moral, 2005), and generally occurring in humanized habitats like cattle pastures, crops and farmlands. Hence, we are absolutely confident on the accuracy of records since it is difficult to skip over the presence of the species once it arrives or its absence once it departs. Furthermore, its morphology and habits are enough different to any other migratory species (e.g. black stork Ciconia nigra) to prevent any misidentification. Three phenological variables were used. The arrival date was defined as the day when the first individual of the breeding population of a certain site was sighted. The departure date was the last day that an individual was observed in
132 Chapter 3
-15 11 37
Records
5208
Localities
615
UTM
63
536
Mean ± SD
36.00 ± 19.8
160
89 Number of UTM
140
115
120 100 80 60 40 20 0
-20
0
20 40 60 80 100 120 Median of arrival dates
a)
180 202 224
Records
2678
Localities
372
UTM
246
Mean ± SD
335 229.63 ± 20.6
80
268 Number of UTM
70
290
60 50 40 30 20 10 0
b)
180
200 220 240 260 280 Median of departure dates
300
Spatial patterns of white stork phenology
133
140 164 188
2280
Localities
320
UTM
212
Mean ± SD
291 197.01 ± 23.5
60
236
50 Number of UTM
260
Records
40 30 20 10 0
150
170 190 210 230 250 Median of length of stays
270
c) Figure 3.1 Maps of arrival dates (a), departure dates (b) and (c) lengths of the stays. Median values for each UTM were calculated by interpolation of data from available localities (black dots) to improve visual inspection of spatial phenological patterns. We have only represented values for those UTMs where the species breeds nowadays (Martí & Del Moral 2003). Scale colour bar in Julian day (1 = 1 January). Details about the number of records, localities, UTMs, mean, standard deviation (SD) and the histogram of the distribution of these observations are given for each variable.
a certain locality. Both dates were transformed in a Julian day scale (1 = first of January), taking into account leap-years and in these cases adding 1 day after 28 February. The length of the stay was defined as the number of days elapsed between the arrival and departure dates in the same locality and year when both records were available. The necessity of this coincidence is the reason for the scarcer number of records in this variable (see Fig. 3.1 for more details). Previously to analyses, we corrected data of these three dependent variables to prevent effects of long-term temporal trends (Gordo & Sanz, 2006) which can potentially bias the comparison between UTMs with values recorded in different decades. To achieve this objective, we carried out a multiple regression analysis for each variable with the year and its quadratic term as predictor variables. Residuals from these models were used to correct original
134 Chapter 3
data. Therefore, new corrected values for arrivals, departures and stays do not show temporal trends. Corrected dates were used hereinafter for all analyses. The median value of all records included in the same UTM 100 km2 square was calculated for the arrival, departure and length of the stay. As some volunteer observers reported data for near localities, the final number of available rows for calculations (i.e. different UTM cells) was fewer than the number of original localities since some localities were included in the same UTM (see Fig. 3.1). Explanatory variables for phenological modelling A set of 30 explanatory variables was used to model migratory phenology of the studied species (see Table 3.1). These variables were classified into four groups named: spatial, environmental, geographical, and biological. In the case of environmental group, seven topographic and ten climatic variables were extracted for each one of the 100 km2 UTM Iberian squares (n=6063) using IDRISI 32 Geographic Information System (Clark Labs, 2001). Topographical variables were obtained from a Digital Elevation Model (Clark Labs, 2000). Mean, minimum and maximum altitude of all 100 pixels of 1 km2 included in each 100 km2 UTM were extracted and the altitudinal range in each cell calculated, together with the slope, aspect (the mean direction of the slope) and the diversity of aspects for each UTM cell. Climate were quantified through rainfall and mean temperatures during each one of the four seasons (spring, summer, autumn and winter), together with the annual temperature variation and an aridity index. The aridity index is expressed as: AI = 1/(P/T + 10) x 100 where P is the mean annual precipitation and T the mean annual temperature. All climatic variables were provided by the Instituto Nacional de Meteorología. Two geographical variables were also calculated: the distance from each UTM cell to the Straits of Gibraltar and the distance to the closest main Iberian river. Since the Straits of Gibraltar is an obligate pass point for this soaring bird both during spring and autumn migration (Bernis, 1974; Bernis, 1975a,b; Fernández-Cruz, 2005) we expect later arrivals and earlier departures for those
Spatial patterns of white stork phenology
Variables Spatial LAT LONG Environmental MEA MIA MXA AR SLP ASP DASP WIR SPR SUR AUR WIMET SPMET SUMET AUMET ATR AI Geographical DIR DSG CSG CAN DUE EBR GDN GDQ MIÑ TAJ Biological ARR DEP NNEST50
135
Description Latitude (m) Longitude (m) Mean altitude (m) Minimum altitude (m) Maximum altitude (m) Altitude range (m) Slope (degrees) Aspect (degrees) Diversity of aspects Winter rainfall (L) Spring rainfall (L) Summer rainfall (L) Autumn rainfall (L) Winter mean temperature (ºC) Spring mean temperature (ºC) Summer mean temperature (ºC) Autumn mean temperature (ºC) Annual temperature range (ºC) Aridity index Distance to rivers (km) Distance to Straits of Gibraltar (km) Cost from Straits of Gibraltar Cantabrica Duero Ebro Guadiana Guadalquivir Miño Tajo Arrival date (Julian day) Depature date (Julian day) Number of occupied nests in the 50x50 km area around each UTM
Table 3.1 List of variables used in analyses. The acronym, complete description and units (in brackets) are given for each one.
far localities. Since it is a species closely related to the presence of rivers and water ponds (Lázaro et al., 1986; Carrascal et al., 1993) we also included the distance to the closest main river as a potential predictor. Information on the major Iberian river basins was included in the model as categorical geographical predictors. We only included those basins were the
136 Chapter 3
Figure 3.2 Map of the Iberian Peninsula with territory divided into basins of the main Iberian rivers. Solid lines delimit basins and broken lines are main rivers. Codes for the basins: 1-Miño, 2-Cantabrica, 3-Ebro, 4-Duero, 5-Tajo, 6-Guadiana, 7-Guadalquivir.
species occurred (see Fig. 3.2). All UTM squares were attributed to each basin according to a 0-1 code. Basins are a natural partitioning of the territory and they could be associated to regional differences in phenological dates. Biological type variables were: population density and arrivals and departures dates. They can help us to discern between the imposed effects of the previously mentioned variables and the effects of some self-specific biological characteristics of the white stork. Population density was assessed by the number of occupied nests in the 25 km radius area surrounding each UTM cell. Data about the precise location of all nests in Spain were obtained from the white stork national census carried out in 2004 by SEO/Birdlife (Molina & Del Moral, 2005). Population density can affect phenology in two ways. Firstly, denser populations could increase chances for observers to detect early individuals (Sparks et al., 2001; Tryjanowski & Sparks, 2001), although the conspicuousness of this species makes difficult such type of bias (Tryjanowski et al., 2005). Secondly, in denser areas earlier arrival would be profitable for individuals since first arrived storks could maintain nest-site fidelity and save energy employed for its construction (Dallinga & Schoenmakers, 1987; Tryjanowski et al., 2004; Vergara et al., 2006). In the case of departures, arrival
Spatial patterns of white stork phenology
137
dates were used to determine the influence of previous migratory phenology in this phase (Jespersen, 1949; Kosicki et al., 2004). In the case of the length of stay, both arrivals and departures dates were included to estimate if the total number of days that white storks remain in their breeding grounds are related to early arrivals, later departures or both. We expect that the stays would be longer such as arrivals would be earlier and departures later. Finally, spatial variables were simply used to assess the existence of spatial gradients. They were defined as the central latitude and longitude of each UTM cell and included in the analysis as a third degree polynomial (Trend Surface Analysis or TSA; see Legendre & Legendre, 1998). The nine terms of TSA can also aid to incorporate the effects caused by other historical, biotic or environmental variables not otherwise taken into consideration (Legendre & Legendre, 1998). Latitude and longitude were standardized (mean=0 and standard deviation=1) as topographical, climatic and geographical variables, in order to eliminate measurement scale effects of these variables. Another hypothetical origin for heterogeneousness in arrival and departures dates observed among localities could be different wintering and pass areas among white stork populations. This fact is particularly important for this species since a growing number of individuals remain all years in Spain and North Africa during wintering period (Van den Bosche, 2002; Molina & Del Moral, 2005). Unfortunately, there is not a precise knowledge of the wintering area for each Spanish population and thus an explanatory variable with this kind of information could not be included in models. To check this hypothesis we gathered ringing data for Spanish individuals recovered during October and November. These months are considered the wintering period for Spanish populations of the white stork (SEO/Birdlife, 1996; Molina & Del Moral, 2005). Recoveries were classified in three regions: Spain, North Africa and subSaharan Africa. Statistical analyses To summarize the relationship between phenological and explanatory variables, General Regression Models (GRM) procedures implemented in STATISTICA (StatSoft, 2001) were performed. Since the unimportant deviations
138 Chapter 3
from a perfectly normal distribution exhibited by all three dependent variables (see Fig. 3.1) do not have a sizable effect on the F statistic (StatSoft, 2001), regression analyses were accomplished with original non-transformed data. Analyses were carried out into three steps. First, we explored the relationship between the dependent (i.e., arrival, departure or stay) and each explanatory variable one-by-one selecting the linear, quadratic or cubic function whose terms were statistically significant (P