International Journal of Multimedia and Ubiquitous Engineering Vol. 5, No. 1, January, 2010
Texture Classification Based on Random Threshold Vector Technique B.V. Ramana Reddy1, M.Radhika Mani2, B.Sujatha3, and Dr.V.Vijaya Kumar4 1
Associate Professor, Dept. of CSE, KSRM COE, Kadapa, A.P., India Asssistant Professor, Dept. of CSE, GIET, Rajahmundry, A.P., India 3 Associate Professor, Dept. of CSE, GIET, Rajahmundry, A.P., India 4 Dean and Professor, Dept. of CSE and IT, GIET, Rajahmundry, A.P., India
[email protected] [email protected] [email protected] [email protected] 2
Abstract
A new feature set derived from the fractal geometry, called the random threshold vector (RTV) is proposed for texture analysis. The RTV is computed for different run length entropy dimensions. The run length entropy dimensions are calculated based on different thresholds. To test the rotationally invariant feature, the run length entropies are calculated in different directions. The experimental results show that the RTV contains great discriminatory information needed for a successful classification. Keywords: Rotation invariant, Feature set, Threshold, Binary image, Fractal geometry, Run length, Entropy dimensions.
I. Introduction Different image objects are best characterized by different texture methods. The texture classification methods which attained success in their operation are found in industrial, bio medical, remote sensing areas and target recognition [1]. For content based information retrieval [2] texture said to be an important feature. As there are lot of variations apparent in natural textures, different features should be selected according to the characteristics of texture images, to achieve the best performance for texture classification. Over the years, a good number of texture classification methods are proposed which can capture different texture properties of the image. The methods of texture classification can be broadly categorized as statistical processing, geometrical processing, model based processing and signal processing. The analysis of statistical properties of texture that deals with the spatial distribution of grey values is the basis for every work in the early period. Some of the adapted statistical methods are co-occurrence matrix [4,5] and auto correlation function [6]. When coming to geometrical methods textures are treated to be the composition of texture primitives that are extracted and analyzed [7] different stochastic models are here with proposed for both texture modeling and classification such as Gaussian Markov Random Fields [8, 9, 10] and spatial autocorrelation function model [11]. To analyze the frequency contents either in spatial domain [12, 13] or in frequency domain, the signal processing techniques, based on texture filtering is recommended. However to measure the characteristics of the images, more powerful texture feature extraction methods are needed for some applications.
53
International Journal of Multimedia and Ubiquitous Engineering Vol. 5, No. 1, January, 2010
This paper proposes a novel method to classify textures. The distribution of properties of pixel with grey levels greater than or equal to some threshold evaluates the texture. A set of points on a two dimensional plane is considered to be the pixel. The set of points is considered as a fractal set such that it can be characterized by the dimension it has. The famous and recommendable measures are Hausdroff dimension [15], mass dimension and Entropy dimension [16]. Though these are useful for characterization sometimes it is difficult to evaluate. The dimension which requires easy computation can be an alternative. This paper proposes a new dimension called run length entropy. The thresholding of the image is done for a number of thresholds, based on which several set of points will be obtained and each set has its own run length entropy dimension. The random threshold vector which is useful for texture classification and can be achieved through run length entropy. The organization of the paper is as follows. Section 2 deals with the methodology of texture classification by Random Threshold Vector (RTV), the results and discussions are presented in section 3 and last section deals with conclusions.
2. Methodology A binary image is obtained from a grey level image based on some threshold. That is N number of different binary images can be obtained from a grey level image. Where ‘N’ is the number of different grey levels of the image. The thresholded binary image of a grey level image I at threshold (th) is defined by the equation (1)
1 if I ( x, y ) 0 if
I ( x, y ) th I ( x, y ) th
(1)
Therefore a binary image is considered as a realization or outcome of a random closed set. A grey scale image is reduced to several binary images and, from a stochastic point of view, is a realization of a multivariate random closed set. In the present method binary images are obtained on the random threshold of a grey level image as stated in equation (2) where μ and σ2 be the grey level mean and variance of an image I respectively and for some integers of k and i. th (i / n)k (2) As per the observations that, in a coarse texture, relatively long grey level runs would occur more often and that a fine texture should contain primarily short runs. Galloway proposed the use of a run length matrix for texture feature extraction [17]. For a given image, the proposed method defines a run-length matrix RLM (i,j) as number of runs starting from location (i,j) of the original image in the predefined direction. For a given binary image of the dimension N×N the present paper generates two different RLM’s called as Zero RLM (ZRLM) and One RLM (ORLM). The ZRLM contains the run length values for zero and ORLM contains the run length values for one of the given binary image respectively. For a given binary image I(x,y) with a value of zero at location (x,y), the ZRLM(x,y) will be having any value between 1 to N and ORLM(x,y) will be having a value of zero always in this case and for the I(x,y) with a value of one, the ORLM(x,y) will be having any value between 1 to N and ZRLM(x,y) will be having always a value of zero. The Figure1, 2 and 3 explains the proposed method of generating ZRLM and ORLM for a given binary image of 4×4.
54
International Journal of Multimedia and Ubiquitous Engineering Vol. 5, No. 1, January, 2010
0
0
1
1
0
0
0
0
1
0
0
1
1
1
1
1
Figure 1. Original Image 2
1
0
0
0
0
2
1
4
3
2
1
0
0
0
0
0
2
1
0
1
0
0
1
0
0
0
0
4
3
2
1
Figure 2. ZRLM for Figure 1
Figure 3. ORLM for Figure 1
Based on RLM’s the present paper evaluates the run length entropy dimension (RLED). The RLED of the image is calculated by the equations (3)-(7)
HR
Where
n
E 0 E1 L0 L1
(3)
n
E 0 ZRLM k (i, j ) log(ZRLM (i, j ))
(4)
i 1 j 1
n
n
E1 ORLM k (i, j ) log(ORLM (i, j ))
(5)
i 1 j 1
L0
1 NN
L1
n n 1 ORLM (i, j ) N N i 1 j 1
n
n
ZRLM (i, j )
(6)
i 1 j 1
(7)
Then the proposed RTV of an image I is defined by the equation (8)
RTV H 0 , H 1 .......H n
(8)
where the Hi is the RLED of the thresholded image, the entire process of RTV is shown in the form of flowchart in figure 4. The present method obtains RTV in four different directions i.e. 0o, 45o, 90o and 135o.
55
International Journal of Multimedia and Ubiquitous Engineering Vol. 5, No. 1, January, 2010
56
International Journal of Multimedia and Ubiquitous Engineering Vol. 5, No. 1, January, 2010
Figure 4. Methodology for texture classification system by RTV.
57
International Journal of Multimedia and Ubiquitous Engineering Vol. 5, No. 1, January, 2010
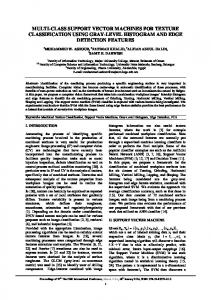
3. Results and Discussions The present paper has considered 48 textures from Visitex album, 8 granite textures and 8 marble textures from [18]. This results a total of 64 textures with a resolution of 256×256. RLE Vs Threshold for Zero Degrees in Interval1 350000 300000
RLE
250000
Water
200000
Leaves fabric
150000 100000 50000 0 0
20
40
60
80 100 Threshold
120
140
160
180
Figure 5. Classification graph for Water, Leaves and Fabric Textures in Interval 1 RLE Vs Threshold for Zero Degrees in Interval6 350000 300000
RLE
250000 200000
Water
150000
Fabric
100000 50000 0 0
50
100 150 Threshold
200
250
Figure 6. Classification graph for Water and Fabric Textures in Interval 6 RLE Vs Threshold for Zero Degrees in Interval8 350000 300000
RLE
250000 200000
Brick
150000
Granite
100000 50000 0 0
50
100
150 Threshold
200
250
300
Figure 7. Classification graph for Brick and Granite Textures in Interval 8 RLE Vs Threshold for Zero Degrees in Interval9 350000 300000
RLE
250000 200000
Water
150000
Leaves
100000 50000 0 0
50
100 150 Threshold
200
250
Figure 8. Classification graph for Water and leaves Textures in Interval 9
58
International Journal of Multimedia and Ubiquitous Engineering Vol. 5, No. 1, January, 2010
Table 1. RTV for Interval 1 of 45 degrees
Tex. No Bark.0000 Bark.0001 Bark.0003 Bark.0004 Bark.0005 Bark.0006 Bark.0007 Bark.0009 Tex. No Water.0000 Water.0001 Water.0002 Water.0003 Water.0004 Water.0005 Water.0006 Water.0007 Tex. No Granite.0000 Granite.0001 Granite.0002 Granite.0003 Granite.0004 Granite.0005 Granite.0006 Granite.0007 Tex. No Leaves.0000 Leaves.0001 Leaves.0002 Leaves.0003 Leaves.0005 Leaves.0006 Leaves.0010 Leaves.0011
Bark Th RLE 101.07 235630.00 111.40 186020.00 75.54 168250.00 69.37 144400.00 48.20 212990.00 52.32 159320.00 75.71 240970.00 113.32 195060.00 Water Th RLE 132.52 151440.00 120.98 251170.00 129.28 131950.00 107.98 160660.00 109.21 142110.00 135.68 106060.00 100.73 150100.00 162.57 195190.00 Granite Th RLE 50.83 154580.00 133.86 170750.00 172.57 159670.00 109.86 137410.00 220.75 155770.00 116.70 101420.00 102.44 135630.00 106.53 193720.00 Leaves Th RLE 62.68 206740.00 51.63 192050.00 73.98 220540.00 98.82 116940.00 76.46 211700.00 68.27 192050.00 120.74 142890.00 95.56 154450.00
Tex. No Brick.0000 Brick.0002 Brick.0003 Brick.0004 Brick.0005 Brick.0006 Brick.0007 Brick.0008 Tex. No Food.0000 Food.0001 Food.0002 Food.0003 Food.0005 Food.0006 Food.0010 Food.0011 Tex. No Marble.0000 Marble.0001 Marble.0002 Marble.0003 Marble.0004 Marble.0005 Marble.0006 Marble.0007 Tex. No Fabric.0000 Fabric.0004 Fabric.0007 Fabric.0008 Fabric.0011 Fabric.0013 Fabric.0015 Fabric.0018
Brick RLE 154020.00 166270.00 214040.00 135460.00 172890.00 240900.00 197370.00 234410.00 Food Th RLE 123.86 118160.00 114.93 164270.00 127.93 116300.00 106.48 154130.00 109.31 82556.00 115.70 155430.00 67.82 254690.00 63.48 230050.00 Marble Th RLE 103.43 115500.00 160.04 127260.00 142.07 167080.00 137.80 161430.00 49.22 240260.00 55.58 222640.00 86.32 229130.00 227.98 236940.00 Fabric Th RLE 119.92 141260.00 105.58 141050.00 129.80 95721.00 120.26 154000.00 131.93 109770.00 120.16 157100.00 114.82 152520.00 130.10 77465.00
Th 96.63 161.12 148.63 122.80 109.11 158.38 75.63 87.20
The experiments are carried out on all these 64 textures, but it becomes laborious to provide results for this large set of textures at each stage of discussion. On each texture, the run length entropy is calculated in four directions with k as 2 and n as 10. For each texture, the RTV is calculated for 11 intervals in four angles. Due to lack of space only one table i.e.
59
International Journal of Multimedia and Ubiquitous Engineering Vol. 5, No. 1, January, 2010
Table 1 is given for RTV at interval 1 of 45o for all textures. Only few graphs of Figure 5, 6, 7 and 8 shows the classification of various texture sets called water, leaves, fabric, brick and granite. By these figures it is clearly evident that good classification of textures are resulted at various intervals of zero degrees. And the same is true for all sets of textures at different intervals and at different angles.
4. Conclusions A new set of texture features called “Run Length Entropy” is proposed and based on this feature set, RTV is proposed for texture classification. The RTV is constructed by using the run length entropy through four different orientations. The results clearly indicate the rotationally and randomly invariant nature of the present method. The proposed RLD technique precisely classified the textures.
Acknowledgements The authors would like to express their cordial thanks to K.V.V. Satya Narayana Raju, Chairman, Chaitanya Institutions and K. Sashi Kiran Varma, Secretary, GIET, Rajahmundry for providing Research facilities. Authors would like to thank Dr. G.V.S. Anantha Lakshmi for her invaluable suggestions and constant encouragement that led to improvise the presentation quality of the paper and Authors would like to thank U.S.N. Raju for his invaluable suggestions.
References [1] L.M. Kaplan, “Extended fractal analysis for texture classification and segmentation”, IEEE Transactions on Image Processing, Vol. 8, No. 11, 1999, pp.1572-1585,. [2] Y. Chan, S.Y. Kung, and Lei Z., “A Feature-Based Approach for Image Retrieval by Sketch, Proceedings of the SPIE International Symposium on Voice, Video and Data Communications”, November 1997,pp. 220231. [3] M. Tuceyran and A.K. Jain, “Texture analysis, in Handbook of Pattern Recognition and Computer Vision “,(2nd edition), World Scientific Publishing Co., Chapter 2.1, 1998, pp. 207-248. [4] R.M. Haralick, K. Shanmugam, I. Dinstein, “Texture features for image classification”, IEEE Transactions on System Man Cybernat, Vol. 8, No. 6, 1973, pp. 610-621. [5] F. Argenti, L. Alparone and G. Benelli, “Fast algorithms for texture analysis using co-occurrence matrices”, IEE Proceedings-F, Vol. 137, No. 6, December 1990, pp. 443-448. [6] H. Kaizer, “A quantification of textures on aerial photographs”, Technical Note 121, AD 69484, Boston University Research Laboratory, 1955 [7] M. Tuceryan and A.K. Jain, “Texture Segmentation Using Voronoi Polygons”, IEEE Transactions on Pattern Analysis and Machine Intelligence, Vol. PAMI-12, February 1990, pp. 211-216. [8] G.R. Cross and A.K. Jain., “Markov random field texture models”, IEEE Transactions on Pattern Analysis Machine Intelligence, Vol. PAMI-5, January 1983, pp. 25–39. [9] Rama Chellappa and Shankar Chatterjee, “Classification of textures using Gaussian Markov random fields”, IEEE Transactions on Acoustics, Speech, and Signal Processing, Vol. ASSP–33, No. 4, 1985, pp. 959–963. [10] Charles. A. Bouman, “Markov Random Fields and Stochastic Image Models”, IEEE ICIP, October 1995. [11] Patrizio Campisi, Alessandro Neri, Gaetano Scarano, “Model based rotation invariant texture classification”, IEEE International Conference on Image Processing, 2002, pp.117-120. [12] K.L. Laws K. L., “Rapid texture identification”, Proc. SPIE 238, 1980, pp.376-380. [13] M. Unser, “Local linear transforms for texture measurements,” signal Processing, Vol. 11, 1986, pp.61-79. [14] R. Bajcsy and L. Lieberman, “Texture gradient as a depth cue”, Computer Graphics and Image Processing, Vol. 5 No. 1, 1976, pp. 52-67. [15] B.B. Mandelbrot, “The fractal geometry of nature”, Freeman, Newyork, 1983.
60
International Journal of Multimedia and Ubiquitous Engineering Vol. 5, No. 1, January, 2010
[16] B.B. Mandelbrot, “Self-affine fractals and fractal dimension”, Physica Scripta 32, pp: 257-260, 1985. [17] M. M. Galloway, “Texture analysis using grey level run lengths,” Comput. Graphics Image Process, vol. 4, pp. 172–179, June 1975. [18] http://www.akarmarble.com
61
International Journal of Multimedia and Ubiquitous Engineering Vol. 5, No. 1, January, 2010
Authors B.V.Ramana Reddy received the B.Tech degree from S.V.University in 1991. He completed M.Tech in Computer Science from JNT University, Masab Tank, Hyderabad, India in 2002. He is having nearly 15 years of teaching and industrial experience. He is currently working as Associate Professor, Dept of C.S.E, KSRM College of Engineering, Kadapa, Andhrapradesh, India. He is a member of Srinivasa Ramanujan Research Forum (SRRF), Godavari Institute of Engineering and Technology (GIET), Rajahmundry. He is pursuing his Ph.D from JNT University, Anantapur in Computer Science under the guidance of Dr. V. Vijaya Kumar. He is a life member of Indian Science Congress Association. He published 5 papers in various conferences and journals. M. Radhika Mani received the B.Tech (CSE) degree from Sir C.R. Reddy College of Engineering, Andhra University in 2005 and received her M. Tech. (Software Engineering) from Godavari Institute of Engineering and Technology (GIET), JNT University in 2008. Presently she is working as an Assistant Professor in GIET, Rajahmundary. She is pursuing her Ph.D. from JNT University, Kakinada in Computer Science under the guidance of Dr. V. Vijaya Kumar. She is a member of SRRF-GIET, Rajahmundry. She has published more than 10 research publications in various National, Inter National conferences, proceedings and Journals. B.Sujatha received the B.Tech. degree from JNT University, Kakinada in 1997 and received her M. Tech. (Computer Science & Engineering) from Andhra University in 2002. She is having 10 years of teaching experience. Presently she is working as an Assoc. Professor in GIET, Rajahmundary. She has published 1 research publications in Inter National Journal. She is a member of SRRF-GIET, Rajahmundry. She is pursuing her Ph.D from Mysore University in Computer Science under the guidance of Dr. V.Vijaya Kumar. Her research interest includes Image Processing and Pattern Recognition. She is a Life member of ISCA. Vakulabharanam Vijaya Kumar received integrated M.S. Engg, degree from Tashkent Polytechnic Institute (USSR) in 1989. He received his Ph.D. degree in Computer Science from Jawaharlal Nehru Technological University (JNTU) in 1998.He has served the JNT University for 13 years as Assistant Professor and Associate Professor and taught courses for M.Tech students. He has been working as Dean for Dept of CSE and IT at GIET, Rajahmundry and Head SRRF-GIET, Affiliated to JNT University, Kakinada. His research interests include Image Processing, Pattern Recognition, Network Security, Steganography, Digital Watermarking, and Image retrieval. He is a life member for CSI, ISTE, IE, IRS, ACS and CS. He has published more than 100 research publications in various National, Inter National conferences, proceedings and Journals.
62