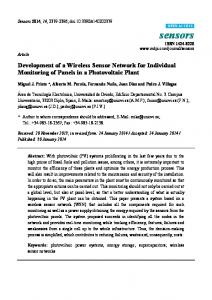
strengthened concrete beams subjected to load tests. At a 100 ... cracks and characterization of composite beams subjected to static and cyclic load test conditions. .... Linux Debian Server. Graph. FFT. TCP/IP. HTTP. MySQL. Server. CANopen.
Eleventh East Asia-Pacific Conference on Structural Engineering & Construction (EASEC-11) “Building a Sustainable Environment”
November 19-21, 2008, Taipei, TAIWAN
THE DEVELOPMENT OF SENSOR NETWORK FOR STRUCTURAL HEALTH MONITORING USING CANOPEN PROTOCAL W. PUNURAI1 and K. JAKSUKAM2 ABSTRACT : This paper presents the design and construction of a measurement system to be used in SHM applications. The proposed system is developed based on the concept of sensoring network using CANopen protocol and is composed of three modules; sensor node module (a set of embedded system boards equipped with strain gauges attached to the desired locations on the structure), a database server module which collects measured data from every sensor node in real-time, and a computer running on internet-based client software. The three modules are connected through CAN data bus which operates at baud rate of 1 Mb/s with the maximum bus length of 50 m. The system was tested to measure signals from a series of strain gauges bonded to steel, concrete and steel-plate strengthened concrete beams subjected to load tests. At a 100 Hz sampling rate and for use with a fundamental frequency of 2-5 Hz, it was shown that the system was more tolerant to the effect of noise and signal distortion when compared to conventional analog data loggers. The strain values obtained from the system were in good agreement with values obtained from a TDS-302 commercial data logger, with a small percentage of error of less than 5%. KEYWORDS: Structural Health Monitoring, Sensoring Network, CANopen protocol 1.
INTRODUCTION
Internet-based sensor networks are an emerging technology that promises an unprecedented ability to monitor the physical world [1]. The application motivating the current work is the life cycle structural health monitoring of civil structure such as bridges and buildings, where it is desirable to have a decentralized distribution of sensors to monitor structural vibrations, fatigues, and hidden corrosion damages [2, 4]. The ability to do this should lead to reduced maintenance costs and improved safety and would allow new structural designs to be lighter and be more efficient. Based upon this motivation, this study is developing a preliminary low cost sensor network prototype for research in structural health monitoring, and the initial focus of the development is for the use of detection of cracks and characterization of composite beams subjected to static and cyclic load test conditions. This paper outlines the design and implementation of a sensor network prototype that has been developed based upon the use of a Controlled Area Network (CAN) and CANopen protocols. The CAN is a high-integrity serial data exchange mechanism for real-time applications. The proposed prototype uses a CAN protocol as a physical data link layer of the internal communication network which connects sensor node modules to the main computer and allows them to communicate with each other and to transfer digital data to the computer server where storage takes place (Fig.1). Major advantages of using CAN technologies in the sensor network are to allow fast, reliable operation with large number of low cost nodes, scalability to allow very large decentralized networks while using low number of wires, and robustness when connected to a higher level protocol CANopen in the application layer to allow the health monitoring to continue to function despite extensive changes to network due to ambient conditions or to the damages that the system is detecting. 1 2
Lecturer, Department of Civil Engineering, Mahidol University, Nakhonpathom, Thailand 73170. Research Assistant, Department of Civil Engineering, Mahidol University, Nakhonpathom, Thailand 73170.
EASEC-11
1
Eleventh East Asia-Pacific Conference on Structural Engineering & Construction (EASEC-11), Taipei, TAIWAN Use r Us e r
Internet
Web Server
12
A
A Ω
OFF
CAN Bus 12
14
V
13 15
AIN1 AIN2 GND
V
12
VCC
Research
Embedded System Node 1
VΩ CAN_H CAN_L A COM
RS2 32
Node1 Structure
A
A Ω
OFF
12 12
14
V
13 15
AIN1 AIN2 GND
V
12
VCC
Node.N
Research
Embedded System Node 2
VΩ CAN_H CAN_L A COM
RS23 2
Database
14
A
A Ω
OFF
12 12
13 15
AIN1 AIN2 GND
V
12
VCC
VΩ CAN_H CAN_L A COM
RS23 2
Research
Embedded System Node 2
V
Node2
Set -up Embedded System
Figure 1. A sensor network prototype for SHM applications using CAN and CANopen protocols The remainder of this paper is organized as follows. Section 2 includes background information on CAN and CANopen protocols. Section 3 introduces the hardware and software for the creation of the network prototype. An experimental evaluation of the sensor network prototype for strain measurements in beams is presented in section 4, and the paper is concluded in section 5. 2.
CAN AND CANOPEN PROTOCALS
To be usable in SHM applications, the internal network communication system has to meet several requirements. First, it has to be fast enough to transfer all the measurement data. It should provide error correction mechanisms in order to significantly increase immunity to interference. It should use low number of wires to allow easy cabling. In addition, it should allow easy adding and removing of hardware components without big needs for configuration. The internal communication systems currently available in the markets are RS-232 and Ethernet. Apparently, these systems do not meet all these requirements. These communication systems use a lot of hardware and cabling. They are also complex. Certain hardware requires one software configuration and one atmosphere housing, which makes the construction bulky and difficult to implement. These disadvantages led to the thoughts of changing the internal communication system to CAN which conforms to all these requirements. 2.1 CAN The Controller Area Network (CAN) is a high-integrity serial digital data communication bus for real time-applications. The CAN was originally developed by the German company Robert Bosch GmbH and successfully tested for automotive and industrial field applications for networking devices as well as sensors [5]. Further features of CAN include two wires serial bus with line-topology and transmission baud rates up to 1 Mb/s at physical bus length of 50 meters. In CAN, data is transmitted and received using message frames: Data frame, Remote frame, Error Frame, and Overload frame. Message frames carry data from a transmitting node to one, or more, receiving nodes. The start of frame indicates the beginning of a message with a single dominant bit and synchronizes all nodes. This is followed by the arbitration field which contains either 11-bit or 29bit message identifier plus a remote-transmission request (RTR) bit as shown in Fig.2. With a unique identifier labeled in the message, the CAN associates a priority with each message to be sent and uses a special arbitration in CSMA/CD, Carrier Sense Multiple Access with Collision Detection to ensure the highest priority message is the one that transmitted. Lower priority but relevant messages are automatically re-transmitted in the subsequent bus cycles.
Figure 2. CAN data message frame EASEC-11
2
Eleventh East Asia-Pacific Conference on Structural Engineering & Construction (EASEC-11), Taipei, TAIWAN
2.2 CANopen The sensor module is connected to CAN on one side and connected to application specific I/O on the other side. The interface between the application and CAN is realized by a piece of software so-called CANopen protocol. The purpose of using CANopen in the application layer is to define the data exchange mechanisms and to standardized specification of sensor modules functionality. These features make the data transfer effective and allow convenient to instantly unplug or plug sensors into the system, without affecting other components [3]. CANopen uses objects for communications and the most common objects are: Service Data Object (SDO) and Process Data Object (PDO). SDO objects transfer large amounts of information that is not time critical e.g. setting up parameters and initialization of the sensor nodes. PDO objects are used to transfer data, which is time critical and this is implemented by synchronization mechanisms. 3.
SENSOR NETWORK PROTOTYPE COMPONENTS
3.1 Hardware - three major elements can be found in the sensor network prototype: a sensor node module, a computer server module and a computer client module. Each element is discussed below.
b) Computer server module A server computer module is used for 2 purposes: 1) to store a set of CAN drivers (CANFestival) for send and receive messages of the CAN-interface and 2) to run web server processes. Figure 4 illustrates the architecture of a computer server. Each component of the computer server is described below.
2 Analog
A D 77 0 8 16 b it
1 SPI
Microcontroller MC9S12DP256 Power Supply
CAN Bus
a) Sensor node module A hardware block diagram of the sensor node module is shown in Fig. 3. Each module consists of a Freescale 16 bit microcontroller board (MC9S12DP256) with built-in CAN I/O controller, an SPI connected analog to digital circuit (AD7708) which digitizes the signals from a series of strain gauges, a REF192 lowheadroom 2.5-V voltage reference and a precision a power supply. All sensor nodes are interconnected to a differential two-wire physical CAN bus (CAN High and CAN Low), which is controlled by a central PC computer server running on Linux.
REF192
PC Linux
N
Figure 3. A hardware block diagram of the sensor node module
Linux Debian Server
PHP TCP/IP HTTP
C-API CANopen
MySQL Server
DOM/XML
FFT Internet Internet Graph
Terminal Control
Labview Web Service
CANFestival is an opensource CANopen Figure 4. Computer server architecture framework which natively supports Linux [7]. In this study, C-code was developed specifically to link a CANFestival runtime library to enable users to easily send and receive CANopen and CAN messages through an AdLink PCI-7841 PCI-Card. To make the computer a web server, Apache, MySQL and PHP were installed. Apache HTTP Server provides the web service engine that allows web pages to be served to the Internet while MySQL is used to store information that can be gathered and served in human readable formats across the Internet. PHP is the scripting language that connects MySQL and HTML. PHP tells web browsers what information should be gathered from MySQL and how this information should be displayed to the viewer.
EASEC-11
3
Eleventh East Asia-Pacific Conference on Structural Engineering & Construction (EASEC-11), Taipei, TAIWAN
c) Computer client module When data gathered by sensor nodes should be made accessible from other entities via the Internet, computer client could log the request and the computer server could then return the reply using the Web Service Description Language WSDL – a standardized XML format. These XML files (testing time, date, location, strain amplitude and frequency response) could be viewed in graphs using client software LabVIEW developed specifically for this project as shown in Fig. 5 Figure 5. LabVIEW Client Software 3.2 Software – while the hardware presented in the last section is responsible mostly for data acquisition, the software running on each sensor node and on the computer server collects and manages data. Now two important steps in the data processing will be presented in detail. a) Collecting and preparing data The CANopen communication software embedded on the microcontroller used in sensor nodes and on the computer server was coded in C/C++ and built on top of free Linux software called CanFestival [7]. This software takes care of the down and upload of sensor node configuration data (name/value pairs) via SDO. With the SDO, the read and write access to the CANopen object dictionary is provided. The software is also responsible for mapping variables each time it receives a new reading for the selected ADC channel that fits the ones described in the object library which is done via PDO. It should be noted that the conversion reading for the selected ADC channel is stored in the ADC data register. This register is 16 bits wide on the AD7708. The ADC can be operated in bipolar mode of operation. In bipolar mode of operation, the hex values of ADC output for any analog input voltage can be calculated using a simple formula as shown in Equation 1. ADC = 2 N −1 × [AIN × GAIN / 1.024 × VREF ] + 1
where
(1)
AIN is the analog input voltage GAIN is the desired integer for the amplifications of 1, 2, 4, 8,16,32,64,and 128 VREF is the reference voltage = 2.5 V
N is the number of bits registered on the AD7708 = 16 bits b) Transferring and accessing the data using web services To optimize the expected number of bytes that must be transferred by the web server when a user make an access to the data via the internet, the CANopen communication software embedded on the computer server was also coded using C-APIs and tied to a MySQL database. A set of LabVIEW VIs embedded on the computer client, such as one shown in Fig. 6, could then be integrated to MySQL to provide users the ability to activate sensor and to define a Uniform Resource Locator (URL). Figure 6. A set of LabVIEW VIs embedded on the computer client EASEC-11
4
Eleventh East Asia-Pacific Conference on Structural Engineering & Construction (EASEC-11), Taipei, TAIWAN
4.
EXPERIMENTAL EVALUATION OF THE SENSOR NETWORK PROTOTYPE
The designed prototype was put to test prior to the structural testing using a simple function generator. The electrical sine waves of different frequencies, amplitudes and phase offsets were fed to the system to perform real-time data writing and reading. The exact same waveforms were depicted with a Yokogawa DSL1320 oscilloscope to provide a reference. Figure 7(a) and 7(b) shows the time and FFT plots of the measured and reference sine waves. At 20 Hz sampling rate and for use with a fundamental frequency between 1-5 Hz, the two methods agree well and only minor differences are present. Case
Our system prototype
Yokogawa DSL1320
a) 1V peak to peak (1Hz) b) 1V peak to peak (3Hz)
Figure 7. The time and FFT plots of sine waves measured by the system prototype and by Yokogawa DSL 1320 oscilloscope For the purpose of evaluating the system’s ability to use for structural health monitoring applications, the prototype was tested to measure signals from a series of strain gauges bonded to the tension face at the midspan of steel, concrete and steel-plate strengthened concrete beams subjected to load tests. Figure 8 illustrates details of test specimens and experimental setup. A hydraulic actuator was installed at the top of the specimen to apply loads to the beam structure while LVDTs were also installed to detect the displacement at different locations of the concrete beam. The load was increasingly applied to the structure. A TDS-302 conventional analog data logger was also wired to the strain gauges to provide a reference reading. The test was completed at about 2500 micro strain. Steel beam
Steel plates strengthened concrete beam Load Cell
Sensor node Sensor network prototype
Strain gauge wired to both sensor node and TDS-302
TDS-302
Figure 8. Details of test specimens and experimental setup
EASEC-11
5
10 -6 Strain 2000 1800 1600 1400 1200 1000 800 600 400 200 0 0 2
%Error
35
TDS-302 TDS-302 PROTOTYPE PROTOTYPE
30 Relative Error
Strain
Eleventh East Asia-Pacific Conference on Structural Engineering & Construction (EASEC-11), Taipei, TAIWAN
RC Beam Steel-plate strengthened RC beam
25
Steel beam
20 15 10 5
4
6 8 Load (ton)
10
12
0
14
0
500
1000
1500
2000
2500
Microstrain
Figure 9. A comparison plot of strain values of concrete beams measured by the prototype and by TDS-302
Figure 10. Relative error of the given micro strain
Based on the experimental data of concrete specimen, a strain curve is plotted versus the applied load in ton as shown in Fig. 9. The experimental data shows that the strain values by both methods increase monotonically with the applied load. For comparison purposes, the percent difference between the two reading values (relative error) was also computed at the given micro strain, as is shown in Figure 10. At all strain levels, the relative error patterns were nearly identical for all specimen types. By comparing the recorded strain values at 100 Hz sampling rate, the system was shown to be more tolerant to the effect of noise and signal distortion when compared to the conventional analog data loggers. The strain values obtained from the system were in good agreement with values obtained from a TDS-302 commercial data logger, with a small percentage of error of less than 5% which conforms to the requirements of AASHTO [6]. Table 1 summarizes the absolute error, relative measurement error and the standard deviation (SD) for all tested specimens. Table 1. A summary of the percent strain measurement error and the standard deviation (SD) for all tested specimens Beam Specimen Type
5.
Absolute Error
Relative Error (%)
SD
Reinforced concrete beam
19.05
4.464
393.80
Steel-plate strengthened concrete beam
11.6
3.647
576.49
Steel beam
26.75
3.084
136.40
CONCLUSIONS
As a final remark, we like to mention that the advantage of using the proposed network prototype is not fully exploited in this paper. For example, a very small modification could be made to the system prototype to make it respond to real-time vibration data such as acceleration and velocity. For realtime vibration measurements, time synchronization is important because the vibration data are simultaneously measured at multipoint sensor nodes. As a result, when the data arrived at a measuring
EASEC-11
6
Eleventh East Asia-Pacific Conference on Structural Engineering & Construction (EASEC-11), Taipei, TAIWAN
station, they are contaminated with an unknown (random) time delay. Even if each sensor node sends data exactly at the same moment, the arrival time of the data may not match. This time difference may be misunderstood as a phase shift in modal analysis. Thus received data needs to be adjusted to maintain time consistency on a common time axis to maintain precise time consistency among sensor nodes. The evaluation results of real time synchronization performance of the CANopen within the system prototype should be explored and this will be the subject of the forthcoming papers. ACKNOWLEDGEMENTS The research reported herein has been conducted as part of the result of a research project granted by Mahidol University. REFERENCES 1. Shrive, N.G., “Intelligent structural health monitoring: a civil engineering perspective”, IEEE International Conference on Systems, Man and Cybernetics, Vol. 2, 2005, pp. 1973 – 1977. 2. Okada, K., Shiraishi, M., “Internet-based sensor network system for structural health monitoring”, Proceedings of the Sensor Symposium on Sensors Micromachines and Applied Systems, Vol. 22, 2005, pp. 95-98. 3. Pereira, C.E., Netto, J., Husemann, R.A., “A CANOpen profile for multi-tap autotransformers” The 30th Annual Conference of the IEEE Industrial Electronics Society, 2004; 3: 2383- 2388. 4. Fuhr, P.L., Huston, D.R., Ambrose, T.P., Mowat EF. “An internet observatory: remote monitoring of instrumented civil structures using the information superhighway”, Smart Materials and Structures, 1995; 4(1): 14-19. 5. Bosch GmbH, Controller Area Network protocol specification Version 2.0, Bosch, 1991. 6. Billing, J. R. “Dynamic loading and testing of bridge in On-tario” Can. J Civ. Engrg., 1984: 833-843. 7. FrancisDupin, “CanFestival”
EASEC-11
7