Indonesian Journal of Electrical Engineering and Computer Science Vol. 11, No. 3, September 2018, pp. 1015~1026 ISSN: 2502-4752, DOI: 10.11591/ ijeecs.v11.i3.pp1015-1026
1015
The Fuzzy Inference System with Least Square Optimization for Time Series Forecasting 1
Samingun Handoyo1 , Marji 2
Department of Statistics, Universitas Brawijaya M alang, Indonesia Department of Informatics Engineering, Universitas Brawijaya M alang, Indonesia Jalan Veteran M alang 65145
2
Article Info
ABSTRACT
Article history:
The rule base on the fuzzy inference system (FIS) has a major role since the output generated by the system is highly dependent on it. The rule base is usually obtained from an expert but in this study proposed the rule base generated based on input-output data pairs with generating rule bases using lookup table scheme, then consequent part of each rule optimized with ordinary least square (OLS), so finally formed rule base from model FIS Takagi-Sugeno zero order. The exchange rate dataset of EURO to USD is used for the development and validation of the system. In this study, 12 FISs were developed from a combination of linguistic values of n = 3,5,7, 9 with the number of lag (k) assumed to have an effect on output for k = 2,3,5. In training data, the values of R2 ranged between 0.989 and 0.993, M APE values ranged between 0.381% and 0.473% where the FIS with n = 9 and k = 5 has the best performance. In the testing data,the values of R2 ranged between 0.203 and 0.7858, M APE values ranged between 0.5136% and 0.9457% where the FIS with n = 3 and k = 2 perform the best.
Received Mar 29, 2018 Revised May 3, 2018 Accepted Jun 6, 2018 Keywords: Forecasting Fuzzy inference system Rule base optimized Time series
Copyright © 2018 Institute of Advanced Engineering and Science. All rights reserved.
Corresponding Author: Samingun Handoyo, Department of Statistics, Universitas Brawijaya Malang, Indonesia, Jalan Veteran Malang 65145, phone +62341571142. Email:
[email protected]
1.
INTRODUCTION Appropriate decision making on an event will have a broad impact on the success of the management. Today there has been a growing number of quantitative methods that can support the decision making process that has even penetrated or obscured the boundaries of the scientific field. Intelligent computing methods is an option to avoid limitations in conventional quantitative methods laden with assumptions that must be met. Some of the intelligent computing methods that are currently being applied in many fields are fuzzy logic or fuzzy system or Fuzzy Inference System (FIS). FIS is not only much in demand by some groups of researchers from the fields of engineering, applied sciences, science, and computer science but also has been widely implemented in the field of industry and production. Some applied FIS include power management control to improve the economic and technical performance of a power source by Doaa et al. [1], Arbab et al. [2] identify non-linear functions based on fuzzy logic models with improved gradient search. Expert systems for hypertension use a combination of C5 algorithms, and fuzzy logic [3]. Based on these three studies the fuzzy system has a satisfactory performance. On the other hand, some researchers also adopt hybrid methods by Azriyenni et al. [4] combining fuzzy systems with neural networks for classification of failures in protection systems, and adaptive methods by Abdulrahman and Imad [5], developing a iTraffic simulation based on dynamic fuzzy logic.
Journal homepage: http://iaescore.com/journals/index.php/ijeecs
1016
ISSN: 2502-4752
Mature planning will greatly affect the process of execution of work or activities to fit the targets that have been set. Knowledge of the circumstances that will occur in the future will support the success of a plan. Time factor affects the events that occur in the future. In the real world, there are many data types collected based on certain time interval known as time series data. Application of fuzzy logic in time series data is often called Fuzzy Time Series (FTS). The main component of FTS is a Fuzzy Logic Relationship (FLR). The output of the FTS model is obtained based on the input data matched with the antecedence part of the FLR, after obtaining an FLR having the antecedent part equal to the inputted data the conseque nt part of the FLR is automatically generated as the system output [6-12] Usually the FLR is arranged based on one or two lags are considered to affect the output. FTS has been successfully applied to time series data with small amounts of observation, but on data with large numbers of observation, the FTS application is constrained by complexity in the formation of FLR and slow computing process. Fuzzy systems or FIS which originally developed in the field of control techniques have components for inference, this is what distinguishes it from FTS [13]. The vital component of the FIS is called the fuzzy rule base. Originally this rule base was obtained from an expert in his field [14], but due to many limitations in obtaining the expert fuzzy rule base, the role of the expert is replaced by the generated fuzzy rule base on the input-output pairs data. Several methods have been proposed to generate the fuzzy rule base from the input-output pairs data, namely the establishment of the fuzzy rule base with the fuzzy association rule by Guofang and Yuanchen [15], and the generation of the fuzzy rule base with the mininng a priori association rule technique by Muhammad et al. [16], and as well as generating fuzzy rule base with lookup table schemes by Samingun and Ari [14]. Although FIS has been successfully implemented in various ways of generating rule base, but FIS performance for time series forcasting is still very unsatisfactory. Various attempts were made to improve the performance of the FIS for forecasting a mong others by forming a neuro-fuzzy hybrid model as performed by Mohammad and Mohammad [17], Mahmut and Mahmud [18] applying a neuro-fuzzy adaptive model to predict hydrological data. Stock market return forecast using ANFIS by Melek and Derya [19]. Angga and Samingun [20] apply FIS for time series forecasting by optimizing membership function using a genetic algorithm. However, these hybrid systems also perform poorly because they only combine two methods directly, and do not to the specific realm to improve the fuzzy rule base of the FIS. In this research, it is proposed that the optimization technique is the most widely used that is Ordinary Least Square (OLS) to produce the better fuzzy rule base, although Samingun et al. [21] have done optimization of parameter model estimation using Particle Swarm Optimization (PSO) with better result than OLS, the fuzzy rule base of the FIS is a linear system, so the OLS is considered appropriate. Based on the above explanation, this research proposes FIS Takagi-Sugeno zero order with a fuzzy rule base optimized by using OLS. The FIS was built and validated using the exchange rate of EURO to USD dataset. The fuzzy rule base will be generated based on input-output pairs data using lookup table scheme, then consequent part of each rule is constant value resulted using OLS optimization. As many as 12 FIS will be derived from the combination of linguistic values n = 3, 5, 7, 9, and the number of lags k = 2, 3, 5. The performance of all FIS will be evaluated using MAPE and R2 value indicators to investigate the influence of the number of linguistic values and the number of lags to the system performance.
2.
RESEARCH METHOD In this section will be explained theoretically the methods used in this study which include the lookup table scheme, fuzzy system of Takagi-Sugeno zero order optimized with OLS (the proposed method) and indicators of system performance measurement. 2.1. Rule bases generation with lookup table scheme The fuzzy rule base is ideally sourced from the experts. The basic rule of fuzzy logic in the form of an "IF-THEN" implication consists of two parts, the antecedent, and the consequent. The antecedent part is the proportion or composition of the proportions that follow the "IF" part, whereas the consequent part is the part following "THEN" in the form of a proposition or in the form of a linear equation or a constant. Consider a rule like the following: (
)
(
)
(1)
The rule in equation (1) can represent a system consisting of as many p -inputs and an output (Y). The system inputs act as proposition in the antecedent part, while the system output acts as a proporsition in consequent part. All inputs and output have observations of n, so the input -output pairs can be Indonesian J Elec Eng & Comp Sci, Vol. 11, No. 3, September 2018 : 1015 – 1026
Indonesian J Elec Eng & Co mp Sci
ISSN: 2502-4752
1017
expressed in an matrix such as in Equation (2). Each input-output variables have a linguistic value of l in the form of a fuzzy set [14].
[
]
(2)
Suppose given a sample of the input-output pairs or briefly expressed as [ ] [ ] ] are the ( ) where [ ] and [ ] , the values of [ ] are the range of values of variable Y. The following range of observed values of the variable X1 , and [ will be described how to generate the bases of fuzzy rule based on input-output pairs data [22]. 1. Determine the fuzzy set which includes input space (U) and output space (V) Sets the linguistic value for each input variable as in the form of a fuzzy set that [ ] and for the output variable sets linguistic value as satisfies satisfying [ ] related to certain membership function. Input-output transformation into linguistic value (fuzzy set) called fuzzification process. Each observation value in the form of a crips number is transformed into a fuzzy set of linguistic value and degree of membership. This process can be done if it has been established several things, namely: a) The maximu m and minimum values of each input-output variable. b) The number of fuzzy sets (linguistic values) desired. c) Membership function of each fuzzy set. d) Parameters of each membership function of each fuzzy set. Each observation value of the input-output variables is calculated the degree of membership in each fuzzy set, and then search for the highest degree of membership in the linguistic value of each variable. The result of a fuzzification process is a pairs of linguistic value and degree of membership. 2. Create one rule from one input-output pairs known as a rule candidate The fuzzification results are rearranged in the input-output matrix format so that two input-output matrix pairs are a matrix whose members are linguistic values (matrix S) and matrix whose members are degree of membership (matrix U). Both matrices in equation (3) have the same order as the matrix order of the initial input-output pairs (matrix A). If each row of the matrix S is read using the implication propotition in which columns 1 to k-1 are the antecedent parts and the column of k is the consequent part, then each row in S matrix forms a rule called candidate rule. Since the raws number of matrix S are equal to the number of rows of matrix A then it is obtained number of candidate rules as much as the number of input-output pairs. The U matrix will be used to calculate the degree of each rule candidates.
[
]
[
]
(3)
the linguistic value (fuzzy set) of the 1st input, and the input-output pair of t degree of membership of linguistic value 3.
Establish the degree of each rule candidates formed Matrix U is used to calculate the degrees of the rule candidates. The degree is useful to overcome the prospective rule candidates of conflict. Two or more rule candidates are called a set of conflict rule candidates if they have the same antecedent parts but the consequent part is different. A rule candidate with the highest degree is selected as a member of the fuzzy rule bases. Suppose the degree of the first row of matrix U is: (4) The degree of a rule candidate is the multiplication of all membership values per observation on the line as expressed in equation (4). Based on the rule candidate matrix (matrix S) obtained at the previous step, the final fuzzy rule is selected by: a) Rule candidates that have both the antecedent and the consequence parts are the same represented by one rule as a member of the fuzzy rule base. b) A unique rule candidate automatically becomes a member of the fuzzy rule base. The Fuzzy Inference System with Least Square Optimization for Time Series … (Samingun Handoyo)
1018 c)
ISSN: 2502-4752
The set of the conflict rule candidates are selected the rule candidate with the greatest degree as a member of the fuzzy rule base.
2.2. Fuzzy Inference System of Takagi-Sugeno Consider l as the number of rules on a fuzzy rule base, l (l = 1,2, ..., L) shows the index of rule and k (k = 1,2, ..., p) indicates the input index. According to Ajoy and Dobrivoje [23], the inference process on Fuzzy Takagi-Sugeno model is divided into 2 stages. The first stage calculates the degree o f activation (fire strength) for each rule on the fuzzy rule base. The second stage is the output calculation of the crips value obtained by using the average defuzzification method. In general, the rule base of the Fuzzy Takagi-Sugeno model is as follows [16]:
(
)
(5)
for where
is the value of the k-th input variable, is the local output (output generated by the l-th rule), are the consequent parameters of rule l, and is the linguistic value (fuzzy set) of the k-th input ( ). In this study the representation of variable for the l-th rule represented by a membership function the membership function of the fuzzy set is Gaussian (gaussMF) as follows: (
)
(
(
) )
(6)
where and are respectively the parameters of the center (mean) and spread (standard deviation) of gaussMF, corresponding to the antecedent part for the l-th rule. The fire strength of l-th rule for the tobservation is calculated by the multiplication operator as follows: ∏
(
)
(7)
where p is the number of input variables. To calculate the output as a crips value, the fire strength is then normalized using the following formula: ∏
̅
∑
∑
( ∏
) (
(8)
)
The system output is ̂ (the value of crips) which is the predicted value on the t-observation calculated by using equation (9) as follows: ̂
∑
∑
̅
̅ (
)
(9)
The equation (9) is a defuzzification process with weighted average method. The weights used in the TakagiSugeno model are normalized fire strength ̅ , consequent part is a constant number for FIS TakagiSugeno of zero order, or in the form of a linear equation for FIS Takagi-Sugeno of one order [22]. 2.3. The Proposed Method In this research, it is proposed a method of FIS Takagi-Sugeno of zero order by establishing constants on the consequent part through Ordinary Least Square (OLS) optimization. The FIS Takagi-Sugeno of zero order based on equation (9) can be written as follows: ̂
̅
̅
̅
(10)
If there are as many n input-output pairs of t = 1,2, ..., n, then equation (10) can be expressed in equation (11) as follows:
Indonesian J Elec Eng & Comp Sci, Vol. 11, No. 3, September 2018 : 1015 – 1026
Indonesian J Elec Eng & Co mp Sci ̂ ̂ ...
̅ ̅
̂
̅
ISSN: 2502-4752
̅ ̅
1019
̅ ̅
.....
.... ̅
̅
(11)
It is obvious that the predicted value of the first input pair is obtained from the linear combination of fire strength in the first row ie ̅ ̅ ̅ ̅ and the vector of parameter , as well as the predicted value of the second input pair is obtained from the linear combination of fire strength in the second row ie ̅ ̅ ̅ ̅ and the parameter vector and so on. Thus a prediction value can be obtained, provided that the vector of parameter value has been obtained, so in this case, the output of the system depends on the value of the vector parameter . Consider if equation (11) is expressed in matrix notation as follows:
[
̂ ̂
]
̂
̅ ̅
̅ ̅
̅ ̅
̅ ̅
[̅
̅
̅
̅ ] [
(12) ]
If the left-hand side of equation (12) is substituted with the actual output data then the multiple linear regression model will be obtained in the matrix notation as follows: (13) Both sides of the equation (13) multiplied by X transpose, the solution will be obtained in equation (14) as follows:
(14) The parameter vector solution θ in equation (14) above is a solution of the Ordinary Least Square (OLS) optimization method in which:
[
]
̅ ̅
̅ ̅
̅ ̅
̅ ̅
[̅
̅
̅
̅ ]
[
]
Parameter θ is a vector consisting of constants that act as a consequent part of the fuzzy rule base of the FIS Takagi Sugenp of zero order. 2.4. Indicators of the System Performance measurement Assessment of system performance in this study using 2 indicators namely MAPE (Mean Absolute Percentage Error) and R2 (Coefficient of Determination). These two values are considered very firm and able to provide standard criteria for a good forecasting system or model.The following are given formulas for calculating MAPE and R2 [14]: ∑
|
̂
|
and
(∑ ∑
̅ (̂ ̅
∑
̂̅ )) (̂
̅̂ )
The value of MAPE = 0 means that the system output perfectly has the same value as the actual value. The value of MAPE is an interval of [0,100] with percentage unit. The value of R2 = 1 means the system output has accuracy in predicting the actual value is 100%, or all the system output value s are equal to the actual values. The value of R2 has a range of values [0,1]. In this study, the value of R2 is calculated from the square of the correlation value between the actual and predicted values. Use of this R 2 must be careful because two data are far apart but have a parallel pattern will have the value of R2 closer to one. Therefore in its use, the R2 indicator must be accompanied by a plot between the actual and predicted values [14].
The Fuzzy Inference System with Least Square Optimization for Time Series … (Samingun Handoyo)
1020
ISSN: 2502-4752
3.
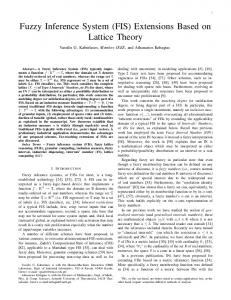
RESULTS AND ANALYSIS In this section is discussed the results obtained from this study include descriptions of data with the distribution of training and testing data, parameter settings of the membership function of the fuzzy set used in fuzzification, generating fuzzy rule base with lookup table scheme and consequent part of rules are optimized with OLS, presents the results of FIS implementation on training and testing data, and measures system performance. 3.1. Data Description The exchange rate of EURO to USD dataset was observed as many as 350 observation points in the period February 2014 until August 2015. The original dataset (all observations) are divided into two parts, ie the first 300 observations are used for modeling which are often referred to as training data and the remaining 50 the last observations are used as cross-validation data or model testing or referred to as testing data. Figure 1 shows the existing pattern on the whole observation s (the top of Figure 1). Broadly speaking the data have a negative linear trend with a relatively constant variance. Also visible if the data are plotted in more detail as at the bottom of Figure 1, the actual data pattern tends to be non-linear with a non-constant variance. Training data (the center part of Figure 1) are used to build the sytem or model, while testing data are used for model validation. In this paper, the development of the FIS Takagi-Sugeno of zero order based on fuzzy rule bases established using lookup table scheme. System specifications are based on a combination of many lags that are considered to have an effect on the output and the number of linguistic values (fuzzy sets) used.
Figure 1. Plot daily exchange rates of EURO to USD for all records, training data, and testing data
3.2. Parameters Setting of Membership Function In Generating the fuzzy rule base with a lookup table scheme, each observational value must be transformed into a membership degree on a linguistic value (fuzzy set). Selection of membership function and its parameter setting are important steps for fuzzification process. Suppose there are 3 linguistic values that are Small (S), Medium (M), and Big (B). An arrangement of parameters of each membership function is needed in order to the degree of membership of an observational value on each linguistic value can be calculated. The membership of an observation on the fuzzy set is determined by finding the highest degree of membership of the observation in all linguistic values. In this study, the membership function used is Gaussian (gaussMF), so it must be done setting both parameters of the mean value (mu), and standard deviation (s td) of each fuzzy set (linguistic value). The number of linguistic values to be used are 3, 5, 7, and 9. Table 1 states the values of both parameters for all linguistic values. Indonesian J Elec Eng & Comp Sci, Vol. 11, No. 3, September 2018 : 1015 – 1026
Indonesian J Elec Eng & Co mp Sci
ISSN: 2502-4752
1021
Table 1. Parameters of the Gaussian Membership Function of the Training Data n=3 No 1 2 3 4 5 6 7 8 9
Mean 0.0776 0.0776 0.0776
n=5 Std 1.0594 1.2147 1.3699
Mean 0.0388 0.0388 0.0388 0.0388 0.0388
n=7 Std 1.0594 1.137 1.2147 1.2923 1.3699
Mean 0.0259 0.0259 0.0259 0.0259 0.0259 0.0259 0.0259
n=9 Std 1.0594 1.1112 1.1629 1.2147 1.2664 1.3182 1.3699
Mean 0.0194 0.0194 0.0194 0.0194 0.0194 0.0194 0.0194 0.0194 0.0194
Std 1.0594 1.0982 1.137 1.1758 1.2147 1.2535 1.2923 1.3311 1.3699
Based on Table 1 it can be seen that the minimum value is always the mean of the lowest linguistic value, while the maximum value always being the mean of the highest linguistic value. The standard deviation value is derived from std = (max-min) / (n-1) where n is the number of linguistic values. The mean value of the second linguistic value is mu2 = min + std, the mean value of the third linguistic value is mu3 = min + 2 * std, and so on. Giving the name of linguistic value using the terms Small (S), Medium (M), and Big (B) for the number of linguistic values of n = 3, while for n = 7 linguistic values are S3, S2, S1, M, B1, B2, and B3. 3.3. Generating of Fuzzy Rule Bases The fuzzy rule base is generated based on the input-output pairs with the lookup table scheme will initially always form rule candidates as much as the number of input -output pairs data. The training data of 300 observations will be formed the matrices input-output pairs with the dimension of 298x3, 297x4, and 295x6 respectively for the number of lag (k) values that affect the output are k = 2, 3, and 5. In the matrix, the column of k + 1 is output, while the other columns are the input. Using each input-output pair will be generated a rule candidate, so the number of rule candidates will be equal to the numbe r of rows of the inputoutput pairs matrix with the addition of the column of k + 2 is the degree of each rule. By using the lookup table scheme criteria, the number of rules in each fuzzy rule base are given in Table 2 as follows:
Table 2. Number of Rules on the Fuzzy Rule Bases of 12 FIS k=2 n 3 5 7 9
rows 6 11 17 21
k=3 columns 4 4 4 4
rows 11 20 31 36
k=5 columns 5 5 5 5
rows 27 45 63 77
columns 7 7 7 7
Table 2 is the matrix order of each fuzzy rule base formed, the first column of Table 2 represent the number of linguistic values (n), while the other columns state the number of rules followed by the number of columns of each rule bas e. Suppose that the linguistic value of n = 5 and lag k = 2 are produced 11 rules with the number of columns is 4 ie columns 1 and 2 are inputs, the third column is the output and the fourth column is the degree of each rule, whereas at n = 5 and k = 3 are generated 20 rules with 5 columns, ie columns 1 to 3 are inputs, column 4 is output, and column 5 is the degree of each rule. The complete of the fuzzy rule bases from the combination of the number of linguistic values (n) and the number of lag (k) for n = 5, k = 2, and for n = 5, k = 3 are presented in Table 3 The number of rules on the fuzzy rule base with n = 5 and k = 2 are 11 rules, while the number of rules on the fuzzy rule base with n = 5 and k = 3 are as much as 20 rules as exposed in Table 2. Consider of the line 11 in Table 2 The 11th line of the fuzzy rule base for n = 5 and k = 2, can be expressed in terms of the following implication proposition: “IF input1 is B1 and input2 is B2 THEN Y is B1”, while the implication proposition of the fuzzy rule base for n = 5 and k = 3 is: “IF input1 is S1 and input2 is S1 and input3 is M THEN Y is S1”. Both of the above rules are the form of the rule of the Mamdani FIS model characterized by its consequent part in the form of linguistic value (fuzzy set). The FIS Takagi-Sugeno of zero order model has The Fuzzy Inference System with Least Square Optimization for Time Series … (Samingun Handoyo)
1022
ISSN: 2502-4752
the fuzzy rule base which a consequent part is a constant. Therefore a systematic attempt to replace linguistic values on consequent parts of the fuzzy rule base with constants must be made. By transforming each observation of training data into membership degrees by fuzzifying each values of inputs in accordance with the linguistic values that exist in each rule. So the input values are fitted to all rules that eventually generate a vector whose length is equal to the number of rules. These vector elements are normalized by dividing them by the total of all elements . As Illustration on the fuzzy rule base for n = 5 and k = 2 will form a transformation matrix with dimensions of 298x11, in which the order denotes the number of input variables as columns and the number of rules as rows. It should be emphasized that the elements of this matrix are the fire strength normalized of each rule. Reconsider the line number 11 of Table 2, the rule of the Takagi-Sugeno model of the zero order formed is: “IF input1 is B1 and input2 is B2 THEN Y is 1.3128”, on the fuzzy rule base for n = 5 and k = 2, while on the fuzzy rule base for n = 5 and k = 3, the established rule is: “IF input1 is S1 and input2 is S1 and input3 is M THEN Y is 1.1454”. So the fuzzy rule base produced on the system with n = 5 and k = 2 are as many as 11 rules in which the antecedent parts are located in the columns X1 and X2, while the consequent parts are obtained by replacing column Y with column B. As exposed on the right segment of table 2 that the system with n = 5 and k = 3 are produced as many as 20 rules in which the antecedent parts are located on columns X1, X2, and X3, whereas the consequent parts of this fuzzy rule base are obtained by replacing column Y with column B. The generation of fuzzy rule bases are performed on all possible combinations of linguistic values of n = 3, 5, and 7, and the number of lags k = 2, 3, and 5.
Table 3. The Fuzzy Rule Bases of the Linguistic Value of n = 5 and the lags k = 2 and k = 3 No 1 2 3 4 5 6 7 8 9 10 11 12 13 14 15 16 17 18 19 20
Combination of n=5 and k=2 X1 X2 Y Degree 2 2 2 0.9995 5 5 5 0.9990 1 1 1 0.9903 4 4 4 0.9895 3 3 3 0.9803 2 1 1 0.4896 2 3 2 0.4020 1 2 1 0.3949 3 4 3 0.3661 4 3 3 0.2921 4 5 4 0.2530
B 1.1504 1.3739 1.0637 1.2989 1.2181 1.1517 1.1283 1.0221 1.205 1.2874 1.3128
X1 2 5 4 1 3 2 1 1 2 3 2 1 2 3 3 4 4 4 4 4
X2 2 5 4 1 3 1 1 2 2 3 2 2 3 4 4 3 3 4 4 5
Combination of n=5 and k=3 X3 Y Degree 2 2 0.9990 5 5 0.9947 4 4 0.9878 1 1 0.9846 3 3 0.9628 1 1 0.4885 2 1 0.3759 1 1 0.3724 1 2 0.3697 4 3 0.3382 3 2 0.3301 2 1 0.3165 3 2 0.2973 3 3 0.2542 4 4 0.2406 4 4 0.2065 3 3 0.2001 5 4 0.1927 3 4 0.1750 5 4 0.1735
B 1.1486 1.3796 1.2953 1.0523 1.1999 1.1393 1.1159 1.0400 1.1789 1.2531 1.1454 1.0045 1.1616 1.2063 1.1872 1.2666 1.294 1.3589 1.3199 1.2775
3.4. Implementation of FIS Takagi-Sugeno of zero order In this session will be implemented 12 FIS Takagi-Sugeno of zero order yielded by a combination of the number of linguistic values of n = 3, 5, 7, and 9 with the number of lags assumed to affect the output of k = 2, 3, and 5. Furthermore use the abbreviation FIS32 for the combination of n = 3 and k = 2, FIS33 for the combination of n = 3 and k = 3, and so on until FIS95 for the combination of n = 9 and k = 5. Implementation of 12 FIS Takagi-Sugeno zero order in training data produce output very close to the actual value. An illustration shows the actual values versus prediction results in FIS52 shown in Figure 2. The top of Figure 2 is a plot of 298 actual versus predicted values , while Figure 2 below plots the actual versus the prediction values of the last 50 observed values in training data.
Indonesian J Elec Eng & Comp Sci, Vol. 11, No. 3, September 2018 : 1015 – 1026
Indonesian J Elec Eng & Co mp Sci
ISSN: 2502-4752
1023
Figure 2. Plot the actual value versus the predicted value of the training data in FIS52
To clarify the system output in the training data, the following 5 recent records of the actual values, predictions, and absolute errors of FIS52, FIS53, FIS93, and FIS95 are shown in Table 3 as follows:
Table 3. Comparison of actual(Yact.), predicted(Ypred.), and absolute error(Abs.err.) values of FIS52, FIS53, FIS93, and FIS95 on 5 Recent Values of Training Data Yact 1.1494 1.1398 1.1378 1.1386 1.1377
FIS52 Ypred 1.1462 1.1447 1.1344 1.1357 1.1369
Abs.err 0.0032 0.0049 0.0034 0.0029 0.0008
Yact. 1.1494 1.1398 1.1378 1.1386 1.1377
FIS53 Ypred 1.1464 1.1457 1.1367 1.1373 1.1373
Abs.err 0.003 0.0059 0.0011 0.0013 0.0004
Yact 1.1494 1.1398 1.1378 1.1386 1.1377
FIS93 Ypred 1.148 1.1452 1.1327 1.1362 1.1373
Abs.err 0.0014 0.0054 0.0051 0.0024 0.0004
Yact 1.1494 1.1398 1.1378 1.1386 1.1377
FIS95 Ypred 1.1475 1.1458 1.1312 1.1307 1.1384
Abs.err 0.0019 0.0060 0.0066 0.0079 0.0007
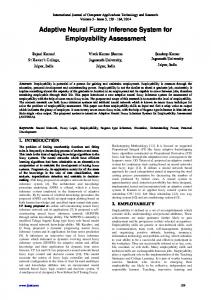
Based on Table 3 shows that the absolute error value of training data for all four FIS is very small ie everything is smaller than 0.01. The plot of predicted versus actual values of data testing for FIS52, FIS53, FIS93, and FIS95 is shown in Figure 5 as follows:
Figure 3. Plots of actual versus predicted values of data testing on FIS52, FIS53, FIS93, and FIS95
Based on the plot results of the actual versus the prediction values in Figure 3, it is clearly exposed that in FIS52 and FIS53 the overall gap between the actual and predicted values are relatively small. However, in FIS93 and FIS95 found some actual values that have a very large gap with the prediction values that are on observations of the 23rd to 33rd. The gap are shown in Table 4 as follows: The Fuzzy Inference System with Least Square Optimization for Time Series … (Samingun Handoyo)
1024
ISSN: 2502-4752
Table 4. Comparison of actual (Yact.), predicted (Ypred.), and absolute error (Abs.err.) values of FIS52, FIS53, FIS93, and FIS95 on any parts of Testing Data Yact 1.0656 1.0672 1.0688 1.0627 1.0637 1.0594 1.0636 1.0636 1.098 1.0955
FIS52 Ypred 1.0769 1.0723 1.0757 1.0763 1.0724 1.0746 1.0724 1.0752 1.0743 1.1041
Abs.err 0.0113 0.0051 0.0069 0.0136 0.0087 0.0152 0.0088 0.0116 0.0237 0.0086
Yact. 1.0656 1.0672 1.0688 1.0627 1.0637 1.0594 1.0636 1.0636 1.098 1.0955
FIS53 Ypred 1.0796 1.0736 1.0754 1.0779 1.0752 1.0753 1.0754 1.0764 1.0771 1.0951
Abs.err 0.014 0.0064 0.0066 0.0152 0.0115 0.0159 0.0118 0.0128 0.0209 0.0004
Yact 1.0656 1.0672 1.0688 1.0627 1.0637 1.0594 1.0636 1.0636 1.098 1.0955
FIS93 Ypred 1.0796 1.0678 1.0739 1.0801 1.0765 1.0765 1.0798 1.0803 1.082 1.0899
Abs.err 0.014 0.0006 0.0051 0.0174 0.0128 0.0171 0.0162 0.0167 0.016 0.0056
Yact 1.0656 1.0672 1.0688 1.0627 1.0637 1.0594 1.0636 1.0636 1.098 1.0955
FIS95 Ypred 1.0854 1.0932 1.0941 1.085 1.0934 1.1093 1.108 1.1058 1.1147 1.0872
Abs.err 0.0198 0.026 0.0253 0.0223 0.0297 0.0499 0.0444 0.0422 0.0167 0.0083
Based on Table 4, the third column of each FIS is the absolute errors. Consider the absolute errors of FIS53, in general, the absolute errors decreases slightly compared to the absolute errors in FIS52. However, very different conditions occur in FIS93 and FIS95, where the absolute errors in both FIS tend to increase compared to the absolute error in FIS52, even the absolute errors on FIS95 is relatively large. 3.5. System Performance Measurement In this session, it will be shown system performance based on 2 indicators that are MAPE and R 2 both in training and testing data. The MAPE value is expected to be small (close to 0), whereas the R2 value is expected to be large (close to 1). Both system performance indicators are calculated on the 12 FIS that have been built. MAPE and R2 values in training data are presented in Table 5 as follows: Table 5. MAPE and R2 values of 12 FIS in Training Data n 3 5 7 9
Lag k=2 MAPE(%) R2 0.4733 0.9894 0.4528 0.9903 0.4471 0.9907 0.4441 0.9909
Lag k=3 MAPE(%) R2 0.4506 0.9903 0.4478 0.9904 0.4446 0.9909 0.4263 0.9914
Lag k=5 MAPE(%) R2 0.4199 0.9916 0.4365 0.9908 0.3822 0.9931 0.3814 0.9928
The first column of Table 5 states the number of fuzzy sets and the first row represents the number of lags assumed to affect the output. Table 5 can be read by combining rows and columns. Suppose that in the first column n = 5 and in the first row lag k = 2, thus the mean is the performance of FIS52 that has the value of MAPE = 0.4528% and the value of R2 = 0.9903. In the first column of n = 9 and in the first line of lag k = 5 which means that the performance of FIS95 with the value of MAPE = 0.3814% and the value of R2 = 0.9928. Based on Table 5, it is known that the smallest MAPE indicator occurs in FIS95, while the largest R2 indicator occurs in FIS75. In this training data MAPE value consistently decreases with increasing linguistic value and number of lags, although MAPE value range of 12 FIS is only 0.09%. The value of R2 slightly behaves differently in lag k = 5 for n=3 to n=7 increases, but for n=7 to n=9 decreases. In other hand for lag k=2 and k=5, the R2 value continues to increase with increasing linguistic value. The increase and decrease of the R2 values of 12 FIS only have a range of 0.0037. The measurement of system performance for testing data is presented in Table 6. This testing data is used to validate the system's ability to predict future observational values. Based on Table 6, it is known that FIS with lag k = 2 is generally better performing based on MAPE or R2 indicator, the smallest MAPE value is 0.5136% of FIS72, while the largest R2 value is 0.7858 of FIS32. Table 6. MAPE and R2 values of 12 FIS in Testing Data n 3 5 7 9
Lag k=2 MAPE(%) R2 0.5357 0.7858 0.543 0.7655 0.5136 0.7849 0.5174 0.7803
Lag k=3 MAPE(%) R2 0.542 0.7674 0.6014 0.7304 0.5608 0.7508 0.5694 0.7492
Lag k=5 MAPE(%) R2 0.711 0.663 0.8858 0.4077 0.8933 0.27 0.9457 0.203
Indonesian J Elec Eng & Comp Sci, Vol. 11, No. 3, September 2018 : 1015 – 1026
Indonesian J Elec Eng & Co mp Sci
ISSN: 2502-4752
1025
The results in Table 6 also confirm that the largest MAPE value is 0.9457% of FIS95, which is still a very small MAPE value that has the range of 0.4321% in testing data. Very different conditions occur on the value of R2 that has the range of 0.5828 which is very large value. FIS32 has the accuracy of 0.7858 = 78.58%, whereas FIS95 only has the accuracy of 0.2030 = 20.30%. The phenomenon of MAPE and R2 values above are very interesting to investigate further. If the two performance measurements are combined with the plot of the actual versus the prediction values of the testing data in Figure 3, or the comparison of the absolute errors of 10 observed values in table 4, it will be obtained that the value of R2 is very sensitive to the existence of a large gap between the actual and prediction value, but not for MAPE indicator.
4.
CONCLUSION In the exchange rate of EURO to USD dataset used in this study, some important informations are obtained ie, The fuzzy rule bases of 12 FIS Takagi-Sugeno zero order optimized by the least square method have been successfully generated. Implementation of 12 FIS in training data produce MAPE performance measurement indicator between 0.3814% and 0.4733%, and R2 performance measurement indicator between 0.9894 and 0.9931. Of course, it shows that 12 systems have excellent performance in training data. The number of linguistic values and the number of lags as system input are very influential on system performance in the testing data. The performance measurement indicator of R2 is very sensitive to the existence of a large gap between the actual and the predicted values, so as to produce a biased performance measurement.
REFERENCES [1] [2] [3]
[4] [5]
[6] [7] [8] [9] [10] [11]
[12] [13]
[14] [15] [16]
[17]
Doaa M A, Faten HF, Ninet M A, Hassen TD. M odeling and control PV-wind hybrid system based on fuzzy logic control technique. Indonesian Journal of Electrical Engineering and Computer Science. 2012; 10(3): 431-441. Arbab NK, Dai Y, Amir M S, Xu XY. Identification of Nonlinear System Based on Fuzzy M odel with Enhanced Gradient Search. Indonesian Journal of Electrical Engineering and Computer Science. 2014; 12(7): 5261-5267. I Gusti M ade Ngurah AY, I Ketut Gede Darma P, Ni M d Ika M M . Hypertension Expert System with C5. 0 Algorithm and Fuzzy Logic. Indonesian Journal of Electrical Engineering and Computer Science. 2014; 12(7): 5569-5677. Azriyenni A, M ohd Wazir M , Naila Z. Fuzzy Neural Network for Classification Fault In Protection System. Indonesian Journal of Electrical Engineering and Computer Science. 2014; 12(8): 5969-5975. Abdulrahman AA, Imad FA. Implementation of Dynamic Fuzzy Logic Control of Traffic Light with Accident Detection and Action System using iTraffic Simulation. Indonesian Journal of Electrical Engineering and Computer Science. 2018; 10(1): 100-109. Jeng Ren H, Shyi-M ing C, Chia-Hoang L. Handling forecasting problems using fuzzy time series. Fuzzy sets and systems. 1998; 100(1-3): 217-228. Shyi M ing C, Jeng Ren H. Temperature prediction using fuzzy time series. IEEE Transactions on Systems, Man, and Cybernetics, Part B (Cybernetics). 2000; 30(2): 263-275. Kunhuang H. Effective lengths of intervals to improve forecasting in fuzzy time series. Fuzzy sets and systems.2001; 123(3): 387-394. Shyi M ing C. Forecasting enrollments based on high-order fuzzy time series. Cybernetics and Systems. 2002; 33(1): 1-16. Shyi M ing C, Nien Yi C. Forecasting enrollments using high‐order fuzzy time series and genetic algorithms. International Journal of intelligent systems. 2006; 21(5): 485-501. AB M utalib, Siti M , Nazirah R, Daud M . Forecasting Unemployment based on Fuzzy Time Series with Different Degree of Confidence. Journal of Telecommunication, Electronic and Computer Engineering (JTEC). 2017; 9(14): 21-24. Siti Nor FA, M ahmod O. Forecasting Rainfall Distribution Based on Deseasonalising Fuzzy Time Series M odel. Journal of Telecommunication, Electronic and Computer Engineering (JTEC). 2017; 9(2-4): 89-93. Yusri S A, Yasunori M . Seasonal short-term electricity demand forecasting under tropical condition using fuzzy approach model. Journal of Telecommunication, Electronic and Computer Engineering (JTEC). 2017, 9(1-3): 7782. Samingun H, Ari PSP. Applied Fuzzy System with R Software (Sistem Fuzzy terapan dengan Software R). First Edition. M alang. UBPress. 2017: 81-135. Guofang K, Yuanchen L. Using fuzzy association rules to design e-commerce personalized recommendation system. Indonesian Journal of Electrical Engineering and Computer Science. 2014; 12(2): 1519-1527. M uhammad F A, Bima A, Samingun H, Harisaweni N. Algorithm Apriori Association Rule in Determination of Fuzzy Rule Based on Comparison of Fuzzy Inference System (FIS) M amdani M ethod and Sugeno M ethod. Business Management and Strategy. 2016; 7(1): 103-124. M ohammad Z K, M ohammad T. Using adaptive neuro-fuzzy inference system for hydrological time series prediction. Applied soft computing. 2008; 8(2): 928-936.
The Fuzzy Inference System with Least Square Optimization for Time Series … (Samingun Handoyo)
1026
ISSN: 2502-4752
[18] M ahmut F, M ahmud G. Hydrological time‐series modelling using an adaptive neuro‐fuzzy inference system. Hydrological processes. 2008; 22(13): 2122-2132. [19] M elek A B, Derya A. An adaptive network-based fuzzy inference system (ANFIS) for the prediction of stock market return: the case of the Istanbul stock exchange. Expert Systems with Applications. 2010; 37(12): 7908-7912. [20] Angga W P, Samingun H. Optimasi Fungsi Keanggotaan Sistem Fuzzy Time Series Dengan Algoritma Genetika (Studi Kasus Harga Harian Saham Bank CIM B Niaga). Jurnal Mahasiswa Statistik. 2015; 3(3): 169-172. [21] Samingun H, Achmad E, Ferry J, Agus W. Implementation of particle swarm optimization (PSO) algorithm for estimating parameter of arma model via maximum likelihood method. Far East Journal of M athematical Sciences (FJM S).2017;102(7):1337-1363. [22] LX. Wang, and Jerry M M . Generating fuzzy rules by learning from examples. IEEE Transactions on systems, man, and cybernetics. 1992; 22(6): 1414-1427. [23] Ajoy KP, and Dobrivoje P. Computational intelligence in time series forecasting: theory and engineering applications. Springer Science & Business M edia, 2006.
Indonesian J Elec Eng & Comp Sci, Vol. 11, No. 3, September 2018 : 1015 – 1026