OCTOBER 2005
QIU ET AL.
761
The Improved AMSU Rain-Rate Algorithm and Its Evaluation for a Cool Season Event in the Western United States SHUANG QIU
AND
PAUL PELLEGRINO
QSS Group, Inc., Lanham, Maryland
RALPH FERRARO NOAA/NESDIS, College Park, Maryland
LIMIN ZHAO NOAA/NESDIS, Suitland, Maryland (Manuscript received 29 April 2004, in final form 30 March 2005) ABSTRACT Rain-rate retrievals from passive microwave sensors are useful for a number of applications related to weather forecasting. For example, in the United States, such estimates are useful for offshore rainfall systems approaching land and in regions where the Weather Surveillance Radar-1988 Doppler (WSR-88D) network is inadequate. Improvements have been made to the rain-rate retrieval from the Advanced Microwave Sounding Unit (AMSU) on board the National Oceanic and Atmospheric Administration (NOAA) Polar Orbiting Environmental Satellites (POESs). The new features of the improved rain-rate algorithm include a two-stream correction of the satellite brightness temperatures at 89 and 150 GHz, cloudand rain-type classification for better retrieval of rain rate, and removal of the two ad hoc thresholds in the ice water path (IWP) and effective diameter (De) retrieval where the scattering signals are very small. In this paper, the new algorithm has been compared to the previous NOAA operational algorithm. In particular, the better utilization of the measurements at and above 150 GHz is shown to produce improved sensitivity to light rainfall associated with winter season storm systems. This improvement is demonstrated through a wintertime case study over southern California during February 2003.
1. Introduction Since the arrival of the first Defense Meteorological Satellite Program (DMSP) Special Sensor Microwave Imager (SSM/I) in 1987 and the ensuing algorithm development over the subsequent decade, satellite-based rainfall retrievals from passive microwave sensors have successfully aided weather forecasters in tracking precipitation systems that are over the open ocean and approaching land (Ferraro et al. 1999). In these instances, Weather Surveillance Radars-1988 Doppler (WSR-88Ds) are rendered useless because the storm is too far from land. Recent experience at the National Oceanic and Atmospheric Administration (NOAA)
Corresponding author address: Shuang Qiu, NOAA/NESDIS, 5200 Auth Rd., Rm. 810, Camp Springs, MD 20746. E-mail:
[email protected]
© 2005 American Meteorological Society
has shown that winter season storm systems affecting the western United States are problematic for forecasters because these systems are typically not predicted well by numerical models (McMurdie and Mass 2004) and because infrared (IR)-based satellite techniques are limited in these situations since they are primarily suited for convective rain systems (Scofield and Kuligowski 2003). It is well known that the primary advantage of microwave rain retrievals is their better physical connection to the rain process. The microwave radiation penetrates cirrus clouds and responds directly to the water droplets and ice particles in the precipitation layer (Kummerow et al. 2001), while IR radiation is limited to providing information about cloud-top characteristics. However, microwave rain retrievals are limited to polar orbiting environmental satellites (POESs), which offer at most two observations each day from each satellite. This drawback can be greatly compensated for by using observations from multiple satellites,
762
WEATHER AND FORECASTING
but still they are not as frequent as the temporal sampling offered by the Geostationary Operational Environmental Satellite (GOES) series. Beginning in 1998, NOAA placed into operation a new generation of POESs, which included a new passive microwave sensor package known as the Advanced Microwave Sounding Unit (AMSU). Presently, there are three NOAA POESs in operation (i.e., NOAA-15, -16, and -17), which together offer global observations approximately every 4 h. In particular, the AMSU-B sensor, with a nadir field of view (FOV) of 16 km, contains five channels in the 89–183-GHz frequency range that offer improved sensitivity to light precipitation rates, especially over land (Ferraro et al. 2000). The benefits to the operational forecaster by having three more viable POES-based precipitation observations cannot be understated. The improved temporal sampling of the NOAA POESs, when combined with the DMSP and other similar satellites, makes microwave products more useful than when only the DMSPs were available. Not only are the precipitation estimates more frequent, they also minimize orbital gaps that are prevalent when only DMSP spacecraft are used. Additionally, the AMSU swath width is over 800 km wider when compared to that from the SSM/I, so the individual orbital gaps are generally small enough that most meso- to synoptic-scale systems will always be observed. By combining the three NOAA POES with the three DMSP precipitation estimates, image composites with complete geographic coverage are easily produced and can be compared with GOES cloud and water vapor information, providing invaluable precipitation information to the forecasters. This is presently being done at NOAA, where both Man–computer Interactive Data Access System (McIDAS) and Advanced Weather Interactive Processing System (AWIPS) precipitation products are generated. It is the purpose of this paper to describe an improved AMSU rain-rate algorithm and to demonstrate its application to winter season rainfall over the western United States. Section 2 of this paper describes the retrieval algorithm; section 3 presents the global and continental U.S (CONUS) evaluations of the new algorithm, as well as an application to the 11–13 February 2003 heavy rain event in southern California; and section 4 contains a summary of the paper.
2. Rain-rate algorithm The basis for the AMSU rain-rate algorithm originates from the work of Weng and Grody (2000) and, subsequently, Zhao and Weng (2002). A simultaneous retrieval of ice water path (IWP) and ice particle effec-
VOLUME 20
tive diameter size (De) is performed through the following two processes: simplifying the radiative transfer equation into a two-stream approximation, and making estimates of the cloud-base and cloud-top brightness temperatures through use of AMSU measurements at 23.8 and 31.4 GHz. Rain rate is computed based on an IWP and rain-rate relation derived from fifthgeneration Pennsylvania State University–National Center for Atmospheric Research (Penn State–NCAR) Mesoscale Model (MM5) cloud model fields over a variety of storm systems used in other passive microwave retrieval methods (Kummerow et al. 2001) that have been averaged to the AMSU footprint size. A fitted relationship is derived to represent the mean, taking the form RR ⫽ a0 ⫹ a1 IWP ⫹ a2 IWP2.
共1兲
The final version of this algorithm was presented in Weng et al. (2003) and was implemented into NOAA’s National Environmental, Data and Information Service (NESDIS) operations in August 2000 (Ferraro et al. 2002). Thorough validation of this rain-rate algorithm revealed a strong positive bias over oceans and a weaker negative bias over land (Turk et al. 2003). In addition, it revealed an unrealistic shape in the distribution of retrieved IWP and rain-rate values. This was due to inadequacies in the parameterization in the IWP retrieval scheme. In particular, it was found that the retrievals of the AMSU-B rain rates had a gap around 5–10 mm h⫺1, which was caused by the two ad hoc thresholds used in the IWP retrieval when the scattering parameter is very small. These two thresholds are removed from the updated IWP retrieval. A more complete discussion on the revised rainfall algorithm is given by Ferraro et al. (2005). Improvements to the algorithm include the following. • A two-stream correction to brightness temperatures
at 89 and 150 GHz is introduced as a function of local zenith angle. The purpose of this adjustment is to reduce the retrieval error of IWP. • The two ad hoc thresholds used in the IWP retrieval are removed when the scattering parameter is very small and the scattering parameter ratio is thus not reliable. • A parameter, convective index (CI), is calculated using the AMSU-B moisture channels, which consists of pairs of narrow passbands on either side of the H2O absorption line center at 183.3 GHz; CI is integrated as a part of the IWP and rain-rate retrieval algorithm. Specifically, CI is defined as
OCTOBER 2005
763
QIU ET AL.
⌬1 ⫽ TB183⫾1 ⫺ TB183⫾7,
共2a兲
⌬2 ⫽ TB183⫾3 ⫺ TB183⫾7 and,
共2b兲
⌬3 ⫽ TB183⫾1 ⫺ TB183⫾3,
共2c兲
where CI ⫽ 1 (an indicator of weak convection or stratiform rain) when ⌬2 ⬎ ⫺2, ⌬2 ⬎ ⌬1, and ⌬2 ⬎ ⌬3; CI ⫽ 2 (an indicator of moderate convection) when ⌬2 ⬎ 0, ⌬1 ⬎ 0, ⌬3 ⬎ 0, ⌬1 ⬎ ⌬3, and ⌬2 ⬎ ⌬3; and CI ⫽ 3 (an indicator of strong convection) when ⌬2 ⬎ 0, ⌬1 ⬎ 0, ⌬3 ⬎ 0, ⌬1 ⬎ ⌬3, and ⌬2 ⬍ ⌬3. Depending upon the CI, rain rate is computed as for CI ⫽ 1 or 2, RR ⫽ 0.3217 ⫹ 16.5043共IWP兲 ⫺ 3.3419共IWP2兲 and 共3a兲 for CI ⫽ 2, RR ⫽ 0.0893 ⫹ 20.8194共IWP兲 ⫺ 2.9117共IWP2兲.
共3b兲
For CI equal to 1 or 2, the rain-rate–IWP relation is derived from the MM5 cloud model database. For CI equal to 3, the relationship is derived from the datasets used by the Goddard Precipitation Profiling Algorithm (GPROF) that contain the profiles of various hydrometeors generated from the cloud models (Kummerow et al. 2001). The application of the current AMSU rainrate algorithm is limited when frozen hydrometeors are absent because the algorithm is based on the scattering signature from precipitation-sized ice particles.
3. Evaluation This part of the paper will demonstrate the validation work done so far for the improved rain-rate algorithm. First, we briefly compare the improved algorithm (NEW) with the previous operational algorithm (OLD; Zhao and Weng 2002; Weng et al. 2003) on a global scale. Next, results from nearly 1 yr of comparisons with gauges and radar over the continental United States are presented. Then, we closely investigate the performance of the NEW algorithm in a winter West Coast case by comparing AMSU rain rates with rain gauge observations at both regional and local (single station) scales.
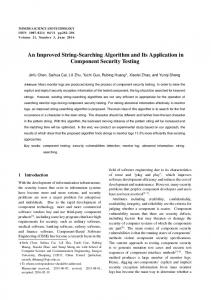
a. Global scale Figures 1 and 2 show the September 2002 global monthly mean precipitation rate derived from NOAA15 data using the OLD and NEW algorithm. These results demonstrate two general changes in the estimated rain rate: the NEW algorithm produces an overall reduction in the rainfall amount over ocean and en-
hanced rainfall intensity over land. The latter effect can be most clearly seen in northern South American, the central region of China, and over the remainder of Eurasia. The data used here are orbitally mapped rain rates on a 1⁄4° grid. Similar results were found for other months (not shown). In addition, the improved rainrate distributions result in lower bias errors when compared with other satellite climatological datasets and monthly rain gauges (Ferraro et al. 2005). The reduced IWP retrieval error from a more accurate radiative transfer calculation in scattering atmospheres through a two-stream correction to brightness temperatures contributes to the lower bias over ocean. Rain-type classification helps to detect more light rain over land and separate convective rain from stratiform rain.
b. CONUS validation Stimulated by activities from the recently established World Meteorological Organization (WMO) International Precipitation Working Group (IPWG), a number of “standard” satellite-based precipitation validation sites were established for operational and proposed operational retrieval algorithms. Three such sites have been developed to validate these estimates on daily and monthly time scales, one over the contiguous United States (CONUS), another over Australia, and most recently, one over western Europe. The CONUS site was developed and is maintained by the National Centers for Environmental Prediction/Climate Prediction Center (NCEP/CPC; information online at http://www.cpc. ncep.noaa.gov/products/janowiak/us_web.shtml; courtesy of
[email protected]). This site compares the daily AMSU accumulated rainfall, based on all three NOAA POESs, with a CPC rain gauge analysis (Higgins et al. 2000) and WSR-88D rainfall. A number of statistical parameters are generated and a time series of these are maintained. To give an example, Fig. 3 displays the time series of eight statistical parameters between the AMSU and CPC rain gauge analyses. Among them are some categorical statistics such as Heidke skill score (HSS), bias score, equitable treat score (ETS), probability of detection (POD), and false alarm ratio (FAR). They can be computed from the rain–no-rain contingency table (Table 1): HSS ⫽
2共q1q4 ⫺ q2q3兲 q22 ⫹ q23 ⫹ 2q1q4 ⫹ 共q2 ⫹ q3兲共q1 ⫹ q4兲
bias score ⫽
q 4 ⫹ q2 ; q4 ⫹ q 3
;
共4兲
共5兲
764
WEATHER AND FORECASTING
VOLUME 20
FIG. 1. Global monthly mean rain rate (mm day⫺1) for Sep 2002 estimated from NOAA-15 AMSU data using the old algorithm.
ETS ⫽
q4 ⫺ qrandom , q4 ⫹ q3 ⫹ q2 ⫺ qrandom
where 共q4 ⫹ q3兲共q4 ⫹ q2兲 ; 共 q1 ⫹ q 2 ⫹ q 3 ⫹ q 4 兲
共6兲
POD ⫽
q4 ; q4 ⫹ q 3
共7兲
FAR ⫽
q2 . q4 ⫹ q 2
共8兲
qrandom ⫽
and
Also plotted in the figure are the statistics between the radar and CPC rain gauge. Generally, AMSU has better correlation with the rain gauge in the warm season than in the cool season due to greater convective activity in summer. However, the difference between radar and AMSU is more consistent and clearer in summer than it is in the cool season. This can be explained by relatively lower POD and higher FAR values yielded by AMSU estimates. The HSS and ETS also indicate
the deficiency of AMSU in correctly measuring rainfall during summer when compared with radar. Also, the bias is higher during the warm season. This means that the AMSU algorithm still has room for improvement during the convective season. The bias score measures the ratio of the frequency of satellite estimates events to the frequency of observed events. Both the radar and AMSU show a lower ratio in winter than in summer; however, AMSU shows a slightly higher ratio than does the radar in the winter of 2003/2004, which indicates that AMSU observes a larger rain area than does the radar. A higher POD when compared to radar further confirms that AMSU provides better detectability of precipitation during the cool season. As such, radarbased products could be significantly improved through a merged product based upon the detection capability of precipitation from AMSU.
c. California case study: 11–13 February 2003 The additional advantages of the AMSU measurements compared to similar instruments such as the SSM/I and Tropical Rainfall Measuring Mission
OCTOBER 2005
QIU ET AL.
765
FIG. 2. Global monthly mean rain rate (mm day⫺1) from Sep 2002 estimated from NOAA-15 AMSU data using the new algorithm.
(TRMM) Microwave Imager (TMI) are its 4-hourly temporal sampling and the ability of the measurements at and above 150 GHz to sense smaller-sized ice particles associated with precipitation (and thus, lighter rain rates than the 89-GHz channel can detect). A winter season rain system that affected the west coast of the United States is used to demonstrate the improvement of the NEW algorithm. The various surface types over which the rain occurred and the changing intensity of the rainfall during the 3-day period of the storm make this case a challenge for satellite rainfall estimation. Additionally, this storm typifies the potential operational application for the AMSU-derived rain rates, namely, in rain systems affecting the west coast of the United States during the winter season. In these instances, the AMSU product can be used to track rain rates offshore and out of WSR-88D range, then, track the rainfall over complex terrain, where radar suffers from beam blockage and in rain gauge–sparse regions. This storm originated in the Pacific Ocean and hit southern California on 11 February and intensified on 12 February, depositing as much as 150 mm of rain in
3 days. Downtown Los Angeles received over 80 mm of rain over the 2-day period of 11 and 12 February. This storm was notable for several reasons. For one, it produced the first significant rainfall in southern California in nearly a month, and caused massive traffic delays and accidents due to slippery roads. Furthermore, this storm had significant effects nationwide, including record snowfall across portions of the northeastern United States. Figures 4 and 5 show 12-hourly sequences of GOES IR and water vapor (WV) imagery, respectively, showing the development and movement of the storm. Additionally, Fig. 6 presents a 24-hourly sequence of the NCEP surface analysis and 500-mb charts. As is evident, a well-developed, cutoff upper-level disturbance in the southern branch of the jet stream was situated off the southern California coast on 10 February 2003. This upper-level feature supported a surface low pressure center that was occluded at the beginning of the period. By 0000 UTC on 11 February 2003 the storm made landfall along the coastline of southern California and 12 h later it moved toward Nevada. This initial surge of
766
WEATHER AND FORECASTING
VOLUME 20
FIG. 3. Statistics between AMSU estimates and CPC real-time daily gauge analysis over the entire CONUS for the period May 2003–Aug 2004. The blue curve indicates the comparison between AMSU and the gauges while the black line is the comparison between the radar and gauges.
precipitation was associated with the occluded front. At 0000 UTC on 12 February 2003, it appears that the storm has moved out of southern California. However, by 1200 UTC on 12 February 2003 a second surge of precipitation, associated with a second disturbance rotating around the base of the upper low, began to affect the area.
Figure 7 displays a 48-h time sequence from 1100 UTC 11 February 2003 to 1100 UTC 13 February 2003 of the estimated rain rate from AMSU overpasses using the NEW algorithm. On 11 February, the NOAA-16 descending pass (Fig. 7a) shows that around 1100 UTC the storm has moved into the southern California area from the Pacific Ocean and produced an extensive area
OCTOBER 2005
QIU ET AL.
TABLE 1. Rain–no-rain contingency table. Estimated Observed
No rain Rain
No rain
Rain
q1 q3
q2 q4
of light to moderate rain. Around 1600 UTC on the same day, the NOAA-15 descending pass (Fig. 7b) indicates that the rain area has shifted eastward. From the NOAA-17 ascending pass (Fig. 7c) at around 0600 UTC on 12 February 2003, the AMSU depicts a second, more intense area of rain moving toward the coast. This main area of rain affects the region for the next 24 h (Figs. 7d–h) until diminishing during the early part of 13 February (Fig. 7i). The daily total of precipitation was calculated for
767
12 February 2003 based on the three-satellite, six-timesper-day observations. The daily totals are compared at grid points with 1⁄4° resolution and within the region of 32°–35°N and 115°–120°W. Shown in Fig. 8 is a scatterplot comparing the daily total of the NEW against that of the OLD for 12 February 2003. In the plot, the unfilled squares are for land and coastline while the filled circles are for ocean. Over land (including coastlines), the NEW is generally higher than the OLD, while lower than the OLD over ocean. This is consistent from what was seen in the global analysis and shown in Figs. 1 and 2. In the next few paragraphs, station observations are introduced to validate the AMSU rain estimates. The validation is conducted on both hourly and daily scales. In addition to individual station comparisons, regional statistics are also provided. Twenty-nine National Weather Service (NWS) first-
FIG. 4. A sequence of GOES-West infrared images showing the development of the storm during 10–14 Feb 2003: (a) 0000 UTC 10 Feb, (b) 1230 UTC 10 Feb, (c) 0000 UTC 11 Feb, (d) 1230 UTC 11 Feb, (e) 0000 UTC 12 Feb, (f) 1230 UTC 12 Feb, (g) 0000 UTC 13 Feb, (h) 1230 UTC 13 Feb, and (i) 0000 UTC 14 Feb.
768
WEATHER AND FORECASTING
VOLUME 20
FIG. 5. A sequence of GOES-West water vapor images: (a) 0000 UTC 10 Feb, (b) 1230 UTC 10 Feb, (c) 0000 UTC 11 Feb, (d) 1230 UTC 11 Feb, (e) 0000 UTC 12 Feb, (f) 1230 UTC 12 Feb, (g) 0000 UTC 13 Feb, (h) 1230 UTC 13 Feb, and (i) 0000 UTC 14 Feb.
order observation stations in southern California are chosen to verify the satellite estimates over land. Figure 9 shows the location of the 29 stations and 3-day total precipitation for each station. Two stations received more than 125 mm of rain in the 3-day period. In Fig. 10, the 3-day precipitation totals of the NEW and OLD algorithms are compared with the observations of the 29 stations. The OLD algorithm underestimates the rainfall for most stations. The NEW algorithm produces rainfall estimates that are comparable to the station observations by increasing the rain intensity. The 3-day average total rainfall of the 29 stations as estimated by the NEW algorithm is 47.5 mm, which is considerably better than from the OLD estimate of 23.1 mm compared with the observed mean of 63.1 mm. The reduction in bias is reflected in the increase of slope from 0.49 to 0.73. A better correlation with the station observations is also in place. As an example, Burbank, California, is chosen in order to make comparisons between hourly station ob-
servations and rain estimates from AMSU passes. The results from this site are representative of what was found at other locations. Figure 11 shows the hourly time series of rainfall at Burbank on 12 February 2003 in black bars. The estimates from the NEW and the OLD algorithms are represented in the time series according to each satellite overpass time as filled and unfilled circles, respectively. The labels of the hours are the ending time of the hourly rainfall accumulation period. As can be seen, NEW increased the rainfall to be more consistent with the surface observations; NEW never exhibited less rainfall then OLD. While NEW is an improvement over OLD, the algorithm still underestimates the peak rain rates form 33 to 36 h by a factor of 2.5. Depending on the overpass time of the satellite during the hour, the satellite may see the heavier rain or lighter rain within the hour, as the satellite estimate is an instantaneous rate while the gauge total is integrated over the entire hour. For example, based upon the sur-
OCTOBER 2005
QIU ET AL.
769
FIG. 6. Surface and 500-mb charts: (a) surface analysis at 1200 UTC 10 Feb 2003, (b) surface analysis at 1200 UTC 11 Feb 2003, (c) surface analysis at 1200 UTC 12 Feb 2003, (d) surface analysis at 1200 UTC 13 Feb 2003, (e) surface analysis at 1200 UTC 14 Feb 2003, (f) 500-mb analysis at 1200 UTC 10 Feb 2003, (g) 500-mb analysis at 1200 UTC 11 Feb 2003, (h) 500-mb analysis at 1200 UTC 12 Feb 2003, (i) 500-mb analysis at 1200 UTC 13 Feb 2003, and (j) 500-mb analysis at 1200 UTC 14 Feb 2003.
face observations at Burbank, light rain was reported at 0153 local standard time (LST); by 0253 LST moderate rain was observed, which changed to heavy rain at 0301 LST. When the satellite passes over the region at 0247 LST, it observed rain approaching moderate in intensity. Thus, for the hourly rainfall ending at 0300 LST, the satellite estimates were higher than observed, since during most of that hour the rain was light in intensity. An opposite situation occurred during the hour ending 1100 LST; the satellite observed light rain during the beginning of the hour, but much of the rainfall fell at moderate to heavy rates and so the satellite estimate for the hour was too low. One would expect that during long time scales (monthly or greater), the under- and overestimates would cancel one another so that a true estimate of the bias in the satellite retrievals can be determined. This has been the focus of several other studies (e.g., McCollum et al. 2002). However, this does point out a significant deficiency in using instantaneous estimates from satellites at relatively infrequent intervals.
The daily total from the satellite is calculated by multiplying the average of the rain-rate estimates (expressed in mm h⫺1) from all the overpasses within a day by 24, to get mm day⫺1. These values are shown in Table 2. On 12 February 2003, the daily total observed at Burbank was 106 mm. NEW almost doubled the OLD estimates from 45 mm to 84 mm. The rain rates obtained from the SSM/I and TRMM overpasses are also shown in Fig. 11. Unfortunately, only three passes of SSM/I and two passes of TRMM are available, since all the other passes missed this station. The daily totals of SSM/I and TRMM are 96 and 42 mm, respectively, but are based on fewer observations. Note that the six AMSU observations are evenly spaced over the course of the day while the TRMM and SSM/I are not. This further illustrates the usefulness of the AMSU rainfall estimates from the three POESs in being better suited to monitor rainfall than the other two sensors. Note, however, that the combination of all the satellites yields 11 independent rain-rate retrievals in a 24-h period, clearly superior to using any single sensor as a stand-
770
WEATHER AND FORECASTING
VOLUME 20
FIG. 7. A sequence of the estimated rain rates from AMSU overpasses using the new algorithm: (a) NOAA-16 descending, 1100 UTC 11 Feb; (b) NOAA-15 descending, 1600 UTC 11 Feb; (c) NOAA-17 ascending, 0600 UTC 12 Feb; (d) NOAA-16 descending, 1100 UTC 12 Feb; (e) NOAA-15 descending, 1600 UTC 12 Feb; (f) NOAA-17 descending, 1800 UTC 12 Feb; (g) NOAA-16 ascending, 2100 UTC 12 Feb; (h) NOAA-15 ascending, 0200 UTC 13 Feb; and (i) NOAA-16 ascending, 1100 UTC 13 Feb. Gray color is indicative of snow cover, surface temperatures at or below 0°C, and regions where the IWP retrieval was indeterminate.
OCTOBER 2005
QIU ET AL.
FIG. 8. Scatterplot of daily rainfall estimated from the new algorithm vs the old algorithm on 12 Feb 2003.
alone observing system. This concept is the basis for the future Global Precipitation Measurement (GPM) mission, where a consensus retrieval algorithm will be developed and used with all existing POES microwave observations (Stocker 2003). Next, a statistical analysis was performed over the southern California region (32.5°–35°N, 117°–120°W), which covers 24 out of 29 stations. The other five sta-
771
FIG. 10. The 3-day total precipitation estimates (mm) from the new and old algorithms compared with 29 station observations.
tions are excluded from this analysis due to the sparse coverage in complex terrain. For this region, areal mean rainfall totals of each day from 11 to 13 February 2003 and a 3-day total are listed in Table 3 for the observed, the NEW, and the OLD. The observed mean is simply the average of the daily totals from all of the stations shown in Fig. 9. For the area average over
FIG. 9. Station distribution over southern CA and 3-day rain total (mm) for 11–13 Feb 2003.
772
WEATHER AND FORECASTING
VOLUME 20
TABLE 3. Statistics for southern CA. 32.5°–35°N, 117°–120°W (mm) OBS OLD NEW
FIG. 11. Rain rate (mm h⫺1) estimated from AMSU_NEW, AMSU_OLD, SSM/I, and TRMM overpasses compared with hourly station observations of Burbank, CA, on 12 Feb 2003.
southern California, on 11 February 2003, where light to moderate rainfall amounts were predominant, the difference between the NEW estimates and the observed rainfall was 42% lower than that between the OLD and the observed rainfall. On 12 February 2003, where heavier and more frequent rain occurred during the day, NEW improved by 35% when compared to the gauge mean. Finally, on 13 February 2003, the rain was very light and intermittent and both NEW and OLD were very low, although NEW did retrieve some rainfall. Overall, for the 3-day total, the error in the NEW estimates was 34% lower than for the OLD estimates. Another way to compensate for the less frequent observations from the AMSU sensor is to average the estimates from each satellite pass over the southern California area (land only) and compare it to the mean hourly precipitation of 24 stations (rather than the daily totals as was previously done). The idea is that the satellites may miss observations between overpasses; the areal average would gather all the information from each individual satellite pass. A time series of the hourly areal mean precipitation for the 3-day period is presented in Fig. 12. First, we notice that compared to OLD, the improved algorithm intensifies moderate and heavy rainfall and keeps the light rainfall at the original magnitude. This may also be caused by NEW picking up a larger area of rainfall. Second, both the NEW and OLD algorithms capture the intensification and decay of the rain event. The only exception is beyond 48 h of the rainfall event, where the rain becomes very light and more showery in nature. Light rain is associated with weak convection or nonconvective rain. The
11 Feb 2003
12 Feb 2003
13 Feb 2003
3-day total
15.8 3.3 10.0
47.4 15.3 31.7
7.2 0.4 1.0
70.4 19.0 42.7
AMSU algorithm is developed for convective rain. Although the new algorithm introduced a convective index to separate stratiform or weak convective rain from convective rain, the retrieval for a nonconvective type of rain still needs to be recalibrated when more cloud data become available. In addition to the sampling issues previously discussed (e.g., the lack of enough AMSU observations during a 24-h period and the nonuniform distribution of surface observations), there is still the distinct possibility that the algorithm does not produce a large enough rain area and the estimated rainfall is biased too low for the light precipitation. It is well known that satellitebased methods are deficient in the estimation of precipitation over complex terrain. In addition, there is a limitation on the detection of the scattering signatures, therefore, the low limit of rain rates that passive microwave sensors may be able to detect, in particular, over land. Finally, there are uncertainties in the algorithm itself, such as in the retrieval of the scattering parameters, bulk volume density, and effective particle diameter (Zhao and Weng 2002).
4. Summary This paper has presented an evaluation of an improved AMSU rain-rate algorithm through a wintertime West Coast case. The improved AMSU rain-rate algorithm has been shown to have the ability to provide valuable rainfall estimates for a challenging winter season precipitation system that has varying rain intensities. This type of rain system is challenging to forecast
TABLE 2. Daily rainfall totals (mm) on 12 Feb 2003. Source
Rain rate (mm)
OBS OLD NEW SSM/I TRMM
106 45 84 96 42
FIG. 12. Mean hourly precipitation (mm h⫺1) of the southern CA area during the 3-day period.
OCTOBER 2005
773
QIU ET AL.
since visible and IR imagery are typically not coupled well with the surface rainfall and the AMSU-derived rain estimates offer additional forecast guidance, in particular, when the rainfall is offshore and out of WSR-88D range, and, after the rain moves inland and over data-sparse regions. As demonstrated by the global comparison, the CONUS validation, and this case study, the improved algorithm greatly reduces the previous positive bias over ocean, while increasing rainfall intensity and picking up more light rain over land. For a representative station in the study region (i.e., Burbank, California), the daily total estimated from the improved algorithm almost doubles the old estimate of 45 mm to 84 mm on 12 February 2003, which was much closer to the gauge rainfall observation of 106 mm. For the area average over southern California, the improved algorithm enhanced the 3-day total from the old estimate of 19 to 43 mm, a 34% reduction in error when compared to the surface gauge rainfall. During the time of the heaviest and longest duration of rainfall on 12 February 2003, the rainfall estimate with the improved algorithm increased by 35% over that of the old algorithm. In addition, the estimate of 32 mm for the day is closer to the observation of 47 mm. The results from this winter case study clearly show the enhanced ability of the improved algorithm in identifying both light and heavy rain over land. Even though the improved algorithm produces rain rates that are noticeably superior to its predecessor, the new algorithm still appears to underestimate the rainfall when compared to the station observations. However, it is difficult to directly compare microwave-based estimates of instantaneous rainfall to rain gauge measurements of accumulated rainfall because different quantities are involved—spatially coarse (15-km resolution) estimates of instantaneous area average rainfall rate versus point measurements of accumulated rainfall that are not evenly distributed in space. Furthermore, it is difficult for microwave-based methods to accurately estimate orographic precipitation because many of the contributing mechanisms (e.g., seeder–feeder) involve liquid-phase particles that cannot be detected using high-frequency microwave data. Also, there are a few uncertainties associated with the algorithm: errors may result from the uncertainties in the scattering parameters, bulk volume density, and effective particle diameter. The algorithm may also miss the lightest rain that is below the capability of the sensor itself. This is the subject of ongoing research at NOAA/NESDIS. The current rain-rate retrieval relies on scattering signals from ice particles over land, which results in the limitations of stratiform and warm rain retrieval. Although the introducing of a convective index helps to separate
convective and stratiform rain, the algorithm usually does a better job for convective rain. When more cloud data are available, the retrieval for stratiform rain may be recalibrated. A multispectral algorithm may provide help for the warm rain retrieval. As reviewed in Kuligowski (2002), a number of researchers have recognized the value of combining microwave-based estimates of rainfall with infrared-based estimates. Also as demonstrated in the CONUS validation, the better precipitation detection of AMSU can be used to supplement WSR-88D radar-based algorithms during cool seasons. A new snowfall detection algorithm over land using AMSU measurements (Kongoli et al. 2003) has recently been combined with the improved rain-rate algorithm as the current NOAA operational AMSU product for falling snow and rain areal extent retrievals over the United States. This can be found at the Microwave Surface and Precipitation Products System (MSPPS) Web site (http://www.orbit.nesdis.noaa.gov/ corp/scsb/mspps/main.html). As we accumulate enough data, we will be able to further assess the performance of the improved algorithm during different seasons and for different types of storm systems. We will also compare the AMSU rain estimates with algorithms using different sensor types [e.g., the microwave-based GPROF algorithm (Kummerow et al. 2001) and the GOES-based Hydroestimator (Scofield and Kuligowski 2003)]. Acknowledgments. The authors would like to acknowledge Huan Meng, Charlie Dean, Roderick Scofield, and Robert Kuligowski whose contributions substantially improved this study and manuscript. We also acknowledge the support of T. Schott (NESDIS/ Office of Systems Development, Suitland, Maryland). We acknowledge the contributions of John Janowiak who developed and maintains the CONUS validation Web site. A portion of this study was supported and monitored by NESDIS’s Center for Satellite Applications and Research of the National Oceanic and Atmospheric Administration (NOAA) under Contract DG133E-02-NC-0058 issued to QSS Group, Inc. The views, opinions, and findings contained in this report are those of the author(s) and should not be construed as an official National Oceanic and Atmospheric Administration or U.S. government position, policy, or decision. REFERENCES Ferraro, R. R., S. J. Kusselson, and M. Colton, 1999: An introduction to passive microwave remote sensing and its applications
774
WEATHER AND FORECASTING
to meteorological analysis and forecasting. Natl. Wea. Dig., 22 (3), 11–24. ——, F. Weng, N. C. Grody, and L. Zhao, 2000: Precipitation characteristics over land from the NOAA-15 AMSU sensor. Geophys. Res. Lett., 27, 2669–2672. ——, and Coauthors, 2002: NOAA satellite-derived hydrological products prove their worth. Eos, Trans. Amer. Geophys. Union, 83, 429–437. ——, and Coauthors, 2005: NOAA operational hydrological products derived from the Advanced Microwave Sounding Unit (AMSU). IEEE Trans. Geosci. Remote Sens., 43, 1036– 1049. Higgins, R. W., W. Shi, E. Yarosh, and R. Joyce, 2000: Improved Unites States precipitation quality control system and analysis. NCEP/Climate Prediction Center Atlas 7, NOAA, Washington, DC, 50 pp. Kongoli, C., P. Pellegrino, R. Ferraro, N. Grody, and H. Meng, 2003: A new snowfall detection algorithm over land using measurements from the Advanced Microwave Sounding Unit (AMSU). Geophys. Res. Lett., 30, 1756–1759. Kuligowski, R., 2002: A self-calibrating GOES rainfall algorithm for short-term rainfall estimates. J. Hydrometeor., 3, 112–130. Kummerow, C., and Coauthors, 2001: The evolution of the Goddard Profiling Algorithm (GPROF) for rainfall estimation from passive microwave sensors. J. Appl. Meteor., 40, 1801– 1820. McCollum, J., W. Krajewski, R. Ferraro, and M. Ba, 2002: Evalu-
VOLUME 20
ation of biases of satellite rainfall estimation algorithms over the continental United States. J. Appl. Meteor., 41, 1065– 1080. McMurdie, L., and C. Mass, 2004: Major numerical forecast failures over the northeast Pacific. Wea. Forecasting, 19, 338– 356. Scofield, R., and R. Kuligowski, 2003: Status and outlook of operational satellite precipitation algorithms for extremeprecipitation events. Wea. Forecasting, 18, 1037–1051. Stocker, E. F., 2003: A precipitation processing system for the Global Precipitation Measurement mission. Proc. Int. Geoscience and Remote Sensing Symp. (IGARSS ’03), Toulouse, France, IEEE, 1704–1706. Turk, J., E. Ebert, H.J. Oh, B.J. Sohn, V. Levizzani, E. Smith, and R. Ferraro, 2003: Validation of an operational global precipitation analysis at short time scales. Preprints, 12th Conf. on Satellite Meteorology and Oceanography, Long Beach, CA, Amer. Meteor. Soc., 705–707. Weng, F., and N. C. Grody, 2000: Retrieval of ice cloud parameters using a microwave imaging radiometer. J. Atmos. Sci., 57, 1069–1081. ——, L. Zhao, R. Ferraro, G. Poe, X. Li, and N. Grody, 2003: Advanced Microwave Sounding Unit cloud and precipitation algorithms. Radio Sci., 38, 8068–8079. Zhao, L., and F. Weng, 2002: Retrieval of ice cloud parameters using the Advanced Microwave Sounding Unit. J. Appl. Meteor., 41, 384–395.