This paper describes the complete implementation of a blind image denoising .... of the denoised patch P, which we shall call âbasic estimationâ, is described in ...... pixel center (resp. in red, purple, green and blue in Figure 6) located at the ...
2014/07/01 v0.5 IPOL article class
Published in Image Processing On Line on 2015–01–28. Submitted on 2014–09–17, accepted on 2014–11–25. c 2015 IPOL & the authors CC–BY–NC–SA ISSN 2105–1232 This article is available online with supplementary materials, software, datasets and online demo at http://dx.doi.org/10.5201/ipol.2015.125
The Noise Clinic: a Blind Image Denoising Algorithm Marc Lebrun, Miguel Colom, Jean-Michel Morel CMLA, ENS Cachan, France ({marc.lebrun, colom, morel}@cmla.ens-cachan.fr)
Abstract This paper describes the complete implementation of a blind image denoising algorithm, that takes any digital image as input. In a first step the algorithm estimates a Signal and Frequency Dependent (SFD) noise model. In a second step, the image is denoised by a multiscale adaptation of the Non-local Bayes denoising method. We focus here on a careful analysis of the denoising step and present a detailed discussion of the influence of its parameters. Extensive commented tests of the blind denoising algorithm are presented, on real JPEG images and on scans of old photographs. Source Code The source code (ANSI C), its documentation, and the online demo are accessible at the IPOL web page of this article1 . Keywords: denoising; noise estimation; signal dependency; frequency dependency; multiscale approach; patch based; blind denoising
1
Introduction
Blind denoising is the conjunction of a noise estimation method and of a denoising method. To be useful to all image users, who generally have only access to the end result of a complex processing chain, blind denoising must be able to cope with both raw and preprocessed images of all sorts. Yet most denoising algorithms published in the literature and even their IPOL implementations only deal with white noise. This is the case for DCT denoising [27], TV denoising [9], K-SVD [15], NLmeans [3], BM3D [10] and NL-Bayes [12]. Blind denoising has been considered by Portilla [21], [20], Rabie [22] and Liu, Freeman, Szeliski and Kang [16]. Portilla’s method is an adaptation of the BLS-GSM algorithm modeling wavelet patches by a Gaussian scale mixture (GSM), combined with a Bayesian least square (BLS) estimation. Liu, Freeman, Szeliski and Kang [16] have also proposed a denoising framework for JPEG images which performs an automatic estimation of a “noise level function” which is an upper estimate of the noise variance, followed by a removal of colored noise. Contrarily to Portilla’s method, no code is available for this complex method. 1
http://dx.doi.org/10.5201/ipol.2015.125
Marc Lebrun, Miguel Colom, Jean-Michel Morel, The Noise Clinic: a Blind Image Denoising Algorithm, Image Processing On Line, 5 (2015), pp. 1–54. http://dx.doi.org/10.5201/ipol.2015.125
Marc Lebrun, Miguel Colom, Jean-Michel Morel
The method proposed by Rabie [22] works only for Gaussian uniform colored noise, which is estimated on flat image regions. Contrarily to the Noise Clinic, this method only deals with a signalindependent Gaussian noise. An entropy-based noise level estimator is proposed in [8], giving a “noise level” but not a complete noise model. For the Noise Clinic we shall rely on a method proposed by Colom et al. [5]. This method is an adaptation of the Ponomarenko et al. method [19] which builds a frequency dependent noise model. JPEG images constitute the overwhelming majority of digital images for which the image formation history has been lost. Thus we pay a special attention to them and to the particular noise structure left by JPEG compression. Nevertheless, the proposed method is adapted to any signal dependent colored noise. For example a JPEG image obtained by scanning an old photograph is a valid patient for the Noise Clinic. The Noise Clinic was introduced in [14] and its theory and a sketch description is given in [13]. Here, our goal is to present a thorough description of its implementation to make it fully reproducible. For several steps, we nevertheless rely on the IPOL description of the noise estimation algorithm [6] and on the IPOL paper [12]. Plan of the paper. Section 2 describes the adaptation of the NL-Bayes denoising method to a signal and frequency dependent noise model. Section 3 describes the noise model and gives the algorithm computing the signal dependent noise patch covariance matrix. Section 4 is dedicated to the multiscale denoising procedure. Section 4.2 gives a thorough parameter analysis. Section 5 describes experiments on real noisy images with unknown history. The Noise Clinic is compared with Portilla’s blind denoising [21] and with the results of the commercial software Neat Image.
2
A Generalized Nonlocal Bayesian Algorithm
In order to help the reader with the huge amount of notations introduced in this section, a brief description is presented in tables 1 and 2, including notations and parameters. NL-Bayes has been originally developed to deal with Gaussian signal-independent noise. Thus, small modifications of the original NL-Bayes are required to adapt it to signal-dependent colored noise. This also leads to several improvements of this algorithm discussed at the end of this section in order to better deal with noise estimations. Let us start with the classic set up where the noise is white Gaussian. This assumption is not so restrictive as it can be extended to raw image thanks to the Anscombe transform [1] transforming Poisson noise into approximately Gaussian white noise. The Gaussian white noise assumption permits to compare method results easily by their PSNR or RMSE on noise-free images u to which a known white Gaussian noise n of standard deviation σ has been added. We shall denote the noisy image u˜. Thus, in a simple experimental setup, denoising algorithms are applied on u˜ thus constructed, knowing σ. Once the denoised image uˆ is obtained, PSNR and RMSE are directly obtained from uˆ and u. Our selected method for blind denoising is NL-Bayes. This algorithm denoises all noisy square patches extracted from the noisy image u˜. The final denoised image uˆ is obtained by the classic “aggregation”, namely replacing each pixel value by an average of the denoised values obtained for all patches containing this pixel. P˜ denotes a reference patch extracted from the image, and P(P˜ ) a ˜ similar to P˜ . An easy Bayesian argument shows that if Q ˜ follows a Gaussian model, set of patches Q a first estimation of the denoised patch P , which we shall call “basic estimation”, is described in Algorithm 1 and can be obtained [11] by � � −1 basic ˜ ˜ ˜ P = P + [CP˜ − Cn ] CP˜ P − P (1) where
2
The Noise Clinic: a Blind Image Denoising Algorithm
u n σ u˜ uˆ P P˜ P(P˜ ) ˜ Q P basic P final P˜ basic
P˜ CP˜ Cbasic P˜ CN c Nc i I
original noise-free image noise standard deviation of the noise noisy input image denoised output image original noise-free reference patch reference noisy patch 3D group composed of similar patches to P˜ generic noisy patch basic estimation of P˜ obtained after the first step of NL-Bayes final estimation of P˜ obtained after the second step of NL-Bayes barycenter of P(P˜ ), i.e. average of all similar patches to P˜ barycenter of similar patches to P˜ basic empirical covariance matrix of the patches similar to P˜ empirical covariance matrix of the patches similar to P˜ basic covariance matrix of the noise the index of the current channel number of channels of the image intensity identity matrix Table 1: Notations introduced in Section 2.
κ×κ αc Nmin Nmax w h η×η τ γ kL kH
size of patches weight for each channel c during the basic estimation minimal number of similar patches at least contained in 3D groups maximal number of similar patches that a 3D group is allowed to contain width of the image height of the image size of the search window similarity threshold for similar patches thresholding parameter to determine if a 3D group belongs or not to an homogeneous area low threshold for homogeneous area criteria high threshold for homogeneous area criteria Table 2: Parameter notations introduced in Section 2.
• P˜ is the empirical average of the patches similar to P˜ X 1 ˜ P˜ ≃ Q, #P(P˜ ) ˜ ˜
(2)
Q∈P(P )
• Cn is the covariance matrix of the noise,
• CP˜ is the empirical covariance matrix of the patches similar to P˜ , which may be obtained by �� �t X � 1 ˜ ˜ ˜ ˜ Q−P Q−P . (3) CP˜ ≃ #P(P˜ ) − 1 ˜ ˜ Q∈P(P )
3
Marc Lebrun, Miguel Colom, Jean-Michel Morel
Algorithm 1 Description of the basic estimation of similar patches. � � Input : noisy 3D groups Pc (P˜ ) , one for each channel,
c � Input : For each intensity i, the corresponding covariance matrices of the noise Cni,c c , one for each channel. � Output : Basic 3D groups Pc (P basic ) c for each channel. for each c = 1 to Nc do Compute the average intensity:
1 i= #Pc (P˜ )κ2
X
κ κ X X
˜ c (p, q) Q
˜ c ∈Pc (P˜ ) p=1 q=1 Q
Get the corresponding noise covariance matrix: Cni,c Define a confidence interval for Pc (P˜ ): Tr(Cni,c ) mc = min (Pc (P˜ )) − #Pc (P˜ ) Tr(Cni,c ) Mc = max(Pc (P˜ )) + #Pc (P˜ ) Compute the barycenter P¯˜ Compute the covariance matrix of the noisy patches CP˜ Correct CP˜ ˜ c ∈ Pc (P˜ ) do for each Q Compute the estimation Qbasic c end for Force the estimated values into reasonable bounds: ˜ c ∈ Pc (P˜ ) do for Q for (p, q) ∈ [[1, κ]]2 do Qbasic (p, q) = min(max(Qbasic (p, q), mc )Mc ) c c end for end for end for � return Pc (P basic ) c .
⊲ Equation (2) ⊲ Equation (3) ⊲ Algorithm 6 ⊲ Equation (1)
In the following, we denote by barycenter the average among the third dimension of all similar patches P˜ as defined in Equation (2), and by mean of the set of similar patches P(P˜ ) the average value of all pixels of all similar patches 1 #Pc (P˜ )κ2
κ X κ X
X
˜ c (p, q). Q
˜ c ∈Pc (P˜ ) p=1 q=1 Q
In the Gaussian white noise case with variance σ 2 one has Cn = σ 2 I. The above “basic” estimate would be the optimal Bayesian estimate, if CP˜ and P˜ were the true covariance matrix and expectation of the patches similar to P˜ . In a second step of NL-Bayes, all the denoised patches obtained after the previous first step estimation can be reused to obtain a better unbiased estimation Cbasic for the P˜ covariance of the 3D group containing P . This is done by applying again (3), but to the denoised ˆ similar to the denoised patch Pˆ , all of these patches being obtained after the basic denoising patches Q basic step. Similarly, a new estimation P˜ of the average of patches similar to P can be obtained. This 4
The Noise Clinic: a Blind Image Denoising Algorithm
leads to a second Wiener-Bayes estimate described in Algorithm 2 � � basic basic �−1 � basic basic final ˜ ˜ ˜ . + CP˜ − Cn CP˜ P −P P =P
(4)
Algorithm 2 Description of the final estimation of similar patches. Input : noisy 3D group P(P˜ ), Input : basic 3D group P basic (P˜ ), Input : For each intensity i, the corresponding covariance matrix of the noise Cni . Output : Final 3D group P(P final ). for each c = 1 to Nc do Compute the average intensity: 1 ic = #Pc (P˜ )κ2
κ X κ X
X
˜ c (p, q) Q
˜ c ∈Pc (P˜ ) p=1 q=1 Q
Get the corresponding noise covariance matrix: Cni,c Define a confidence interval for Pc (P˜ ): Tr(Cni,c ) mc = min (Pc (P˜ )) − #Pc (P˜ ) Tr(Cni,c ) Mc = max(Pc (P˜ )) + #Pc (P˜ ) end for Compute the barycenter P¯˜ basic Compute the covariance matrix of the basic patches Cbasic : P˜ = Cbasic P˜
1 #P basic (P˜ ) − 1
X
Qbasic ∈P basic (P˜ )
�
Qbasic − P¯˜ basic
for each Qbasic ∈ P basic (P˜ ) do Compute the estimation Qfinal end for Make sure that the estimated values are not absurd: for c = 1 to Nc do ˜ c ∈ Pc (P˜ ) do for Q for (p, q) ∈ [[1, κ]]2 do Qfinal (p, q) = min(max(Qfinal (p, q), mc )Mc ) c c end for end for end for return P(P final ). The final algorithm is described in Algorithms 3 and 4.
5
⊲ Equation (2) �t �� Qbasic − P¯˜ basic ⊲ Equation (4)
Marc Lebrun, Miguel Colom, Jean-Michel Morel
Algorithm 3 Description of the first step of the modified NL-Bayes algorithm used in the Noise Clinic. Input : Noisy image u˜, � Input : For each intensity i, the corresponding covariance matrices of the noise Cni,c c , one for each channel, Input : w width and h height of the image, Output : Basic image ubasic . Initializations Parameters initialization ⊲ Section 4.2 Initialization of the mask of unused patches: ∀(i, j) ∈ [[1, h]] × [[1, w]], mask(i, j) = true Initialization of the aggregated estimated values: ∀c ∈ [[1, Nc ]], ∀(i, j) ∈ [[1, h]] × [[1, w]], vc (i, j) = 0 Initialization of the weight: ∀c ∈ [[1, Nc ]], ∀(i, j) ∈ [[1, h]] × [[1, w]], wc (i, j) = 0 Scan all pixels of the image for each (ir , jr ) ∈ [[1, h]] × [[1, w]] do Check that the current patch has not been processed yet if mask(ir , jr ) then Compute the 3D group of similar patches P(P˜ ) for (i, j) ∈ [[ir − η/2, ir + η/2]] × [[jr − η/2]] × [[jr + η/2]] do d(iη + j){1} = (i, j) ˜ P˜ ) Compute the distance: d(iη + j){2} = d(Q, ⊲ Equation (5) end for Select the similar patches randomly according to d ⊲ Algorithm 5 Compute the Bayes estimation ⊲ Algorithm 1 Apply the homogeneous area trick ⊲ Algorithm 7 Compute the aggregation of all estimates of this current 3D group for c = 1 to Nc do ˜ c ∈ Pc (P˜ ) do for Q Let (iQ , jQ ) be the position of the top left pixel of the patch Q for (p, q) ∈ [[1, κ]]2 do wc (iQ + p, jQ + q) = wc (iQ + p, jQ + q) + 1 vc (iQ + p, jQ + q) = vc (iQ + p, jQ + q) + Qbasic (p, q) c end for end for end for Update the mask ˜ ∈ P(P˜ ) do for Q mask(iQ , jQ ) = f alse end for end if end for Compute the basic aggregation for c = 1 to Nc do for (i, j) ∈ [[1, h]] × [[1, w]] do vc (i, j) ubasic (i, j) = c wc (i, j) end for end for return ubasic
6
The Noise Clinic: a Blind Image Denoising Algorithm
Algorithm 4 Description of the second step of the modified NL-Bayes algorithm used in the Noise Clinic. Input : Noisy image u˜, Input : Basic image ubasic , Input : For each intensity i, the corresponding multi-channel covariance matrix of the noise Cni , Input : w width and h height of the image, Output : Final denoised image ufinal . Initializations Parameters initialization ⊲ Section 4.2 Initialization of the mask of unused patches: ∀(i, j) ∈ [[1, h]] × [[1, w]], mask(i, j) = true Initialization of the aggregated estimated values: ∀c ∈ [[1, Nc ]], ∀(i, j) ∈ [[1, h]] × [[1, w]], vc (i, j) = 0 Initialization of the weight: ∀c ∈ [[1, Nc ]], ∀(i, j) ∈ [[1, h]] × [[1, w]], wc (i, j) = 0 Scan all pixels of the image for each (ir , jr ) ∈ [[1, h]] × [[1, w]] do Check that the current patch has not been processed yet if mask(ir , jr ) then Compute the 3D groups of similar multi-channel patches P(P˜ ) and P basic (P˜ ) for (i, j) ∈ [[ir − η/2, ir + η/2]] × [[jr − η/2]] × [[jr + η/2]] do d(iη + j){1} = (i, j) Nc 1 X d(Qbasic , Pcbasic ) Compute the distance: d(iη + j){2} = c Nc c=1 end for Select the similar patches randomly according to d ⊲ Algorithm 5 Compute the Bayes estimation ⊲ Algorithm 2 Compute the aggregation of all estimates of this current 3D group for c = 1 to Nc do ˜ ∈ P(P˜ )c do for Q Let (iQ , jQ ) be the position of the top left pixel of the patch Q for (p, q) ∈ [[1, κ]]2 do wc (iQ + p, jQ + q) = wc (iQ + p, jQ + q) + 1 vc (iQ + p, jQ + q) = vc (iQ + p, jQ + q) + Qfinal (p, q) end for end for end for Update the mask ˜ ∈ P(P˜ ) do for Q mask(iQ , jQ ) = f alse end for end if end for Compute the final aggregation for c = 1 to Nc do for (i, j) ∈ [[1, h]] × [[1, w]] do vc (i, j) ufinal (i, j) = c wc (i, j) end for end for return ufinal 7
Marc Lebrun, Miguel Colom, Jean-Michel Morel
2.1
Adaptation to Signal-Dependent Noise
Formulas (1) and (4) can be applied with a patch noise model Cn depending on each patch P˜ . This application only requires an estimate of the covariance matrix of the noise associated with each group of similar patches. The algorithm computing this matrix is given in Section 3. The noise model being signal dependent, for each intensity i in the range intensity [0, 255] of the image a noise covariance matrix Cni will be available. The noise model for each group of patches similar to P˜ will depend on P˜ through their mean i. The reference intensity for the current 3D group P(P˜ ) must therefore be estimated to apply formulas (1) and (4) with the appropriate noise covariance matrix. This intensity is simply estimated as the average of all pixels contained in P(P˜ ).
2.2
Computation of the Distance
The original NL-Bayes algorithm computes the distances for the first step only on the luminance (Y ) channel. The problem is that if two areas of different chrominance but similar luminance are close, then this distance will see both areas as unique. To avoid this bias, the distance during the first step will be computed over all channels Y, U, V . But as chrominance channels have more noise than the luminance channel, they are less precise. This justifies the use of a weighted distance as follows, based on the classic l2 norm between patches denoted by d2 Nc 1 X ˜ ˜ ˜ c , P˜c ) d(Q, P ) = αc d2 (Q Σα c=1
where Σα =
Nc X
αc with αY =
c=1
2.3
r
1 2
αU =
r
1 4
(5)
αV =
r
1 . 4
Selection of Similar Patches
The original NL-Bayes Algorithm [11] performs a selection of similar patches as follows: • Step 1: The Nmin most similar patches are kept, depending on their distance to the reference patch; • Step 2: Nmin most similar patches are chosen at least according to their distance to the th reference patch. If the distance of the Nmin patch is below a certain threshold, then P(P˜ ) is composed of all patches of the neighbourhood for which the distance is below this threshold. The most similar patches according to the l2 distance may be influenced by the local structure of the noise, especially when working with small size patches. Moreover, if the image is processed line by line, in perfect homogeneous areas the similar patches will be all chosen on one line. As the algorithm does not take an already estimated patch as a new reference one (for speed-up purposes), all similar patches of the line will be discarded and then will get at the end only one estimation, which may create line artifacts. To avoid this problem, a random patch selection will be used, as described in Algorithm 5. The selection of similar patches is done as follows: 1. A threshold τ is fixed depending on the trace of the covariance matrix of the noise Tr(Cn ) for Nc X the first step (τ = 3 Tr(Cn )2c αc2 ), or independently of the noise for the second step (τ = 3); c=1
8
The Noise Clinic: a Blind Image Denoising Algorithm
2. The distance to the reference patch is recorded for the all patches of the search window; 3. Let N be the number of all the patches whose distance is below τ ; 4.
• If N < Nmin , the Nmin most similar patches are kept;
• Else if N ≤ Nmax , the N most similar patches are kept;
• Else, Nmax patches are randomly selected among the N best.
Algorithm 5 Algorithm of random selection of similar patches depending on a distance table. Input : List of distances and positions d, Input : Similarity threshold τ , Input : Minimal number of similar patches Nmin , Input : Maximal number of similar patches Nmax , Input : Size of the search window η. Output : Index of similar patches index, Output : Number of similar patches kept N . The list d is sorted according to the distances, its first element is ds (1) = sort(d, 1) Count the number of patches susceptible of being similar if ds (Nmin ) > τ then N = Nmin for n = 1 to N do index(n) = ds (n){2} end for else Look for the maximal number of patches which distances are below τ N =0 for n ≤ η 2 do if d(n){1} ≤ τ then N =N +1 end if end for The similar patches are chosen randomly for n = 1 to min(N, Nm ), randomly chosen in [[1, N ]] do index(n) = ds (n){2} end for end if return index and N .
2.4
Local Correction of the Covariance Matrix
If the matrices {Cni }i∈[0,255] are not accurate enough, denoising can cause artifacts from the first step. A conservative estimation strategy must be applied on the first Bayesian step to avoid noise overestimation artifacts generally due to texture. This strategy ensures that the noise variances are always smaller than the noisy patch variances. This sanity check based on the diagonal values of both CP˜ and Cn covariance matrices leads to the following more conservative estimate of the diagonal elements of the patch covariance matrix used in (1) ∀p ∈ [[0, κ2 − 1]], CP˜ (p, p) = max (CP˜ (p, p) , Cn (p, p)). 9
(6)
Marc Lebrun, Miguel Colom, Jean-Michel Morel
Indeed, by the independence of the patch and of the noise, the true covariance of the noisy patch is the sum of the covariance of the patch and of the covariance of the noise. Thus, their variances on the diagonal add, and therefore we should always have CP˜ (p, p) ≥ Cn (p, p). This local correction is summarized in Algorithm 6. Algorithm 6 Local correction of the covariance matrix. Input : 3D group of similar patches P(P˜ ); Input : Patch size κ; Input : Covariance matrix of the noise Cn . Output : CP˜ , corrected empirical covariance matrix of patches similar to P˜ . Get CP˜ . for each p = 0 to κ2 − 1 do for each q = 0 to κ2 − 1 do CP˜ (p, q) =
�� � X � 1 ˜ ˜ Q(p) − P˜ (p) Q(q) − P˜ (q) #P(P˜ ) − 1 ˜ ˜ Q∈P(P )
end for end for Locally correct the covariance matrix for each p = 0 to κ2 − 1 do CP˜ (p, p) = max (CP˜ (p, p) , Cn (p, p)) end for return CP˜ .
2.5
Homogeneous Area Detection
The original NL-Bayes Algorithm [11] has a statistical test to determine if a 3D group belongs to an homogeneous area, and in this case the estimation of all the patches is replaced by the global mean over all the pixels contained in the 3D group. This criterion is merely based on the comparison of the empirical standard deviation of all pixels of P(P˜ ) with σ 2 . In our generalization of this algorithm, σ doesn’t exist since Cn 6= σ 2 I. So this criterion must be adapted to better take into account Cn in the following way: • First, compute the traces of both covariance matrices for each channel c, Tr(CP˜ ) and Tr(Cn ); • To ensure that the 3D group belongs to an homogeneous area and not to an edge, the barycenter P˜ of the 3D group is computed and compared to the mean of all the pixels of the 3D group P˜ �2 [[0,κ−1]]2 � 1 X ˜ ˜ P (p, q) − P . D= 2 κ p,q Then, if D ≤ γTr(Cn ), the 3D group is detected as belonging to an homogeneous area. Where γ is a thresholding parameters set to 1 in our implementation, used to determine whether a 3D group belongs to an homogeneous are or not. 10
The Noise Clinic: a Blind Image Denoising Algorithm
ˆ˜ a first estimation of Q ˜ obtained by (1). Then the basic estimate is ∀Q ˜ ∈ P(P˜ ), • Denote by Q Q
where
basic
˜ P ˆ˜ = Q ˆ˜ αQ + (1 − α)P˜ α=
and P˜ =
if Tr(CP˜ ) < kL Tr(Cn ) if Tr(CP˜ ) > kH Tr(Cn )
(7)
otherwise,
Tr(CP˜ ) − kL Tr(Cn ) , kH Tr(Cn ) − kL Tr(Cn )
κ X κ X X 1 ˜ q). Q(p, #P(P˜ )κ2 ˜ Q∈P( P˜ ) p=1 q=1
The thresholds (kL , kH ) are chosen equal to (4, 8) for the finest scale, and (2, 4) for lower scales. This homogeneous area detection is summarized in Algorithm 7. Algorithm 7 Detection and estimation of homogeneous area. ˆ Q ˜ ∈ P(P˜ )}, Input : Bayesian estimation of the 3D group: {Q, X X 1 ˜ q), Input : Mean of the noisy patches: P˜ = Q(p, #P(P˜ )κ2 ˜ ˜ p,q Q∈P(P )
Input : Barycenter of the noisy patches: P˜ , Input : Trace of the covariance matrix of the noise: Tr(Cn ), Input : Trace of the covariance matrix of the similar noisy patches: Tr(CP˜ ), Input : Thresholding parameters: kL , kH , γ. Output : Final estimation of the 3D group before aggregation. Computation of the difference to the barycenter �2 [[0,κ−1]]2 � 1 X P˜ (p, q) − P˜ D= 2 κ p,q
Detection if truly homogeneous area if D ≤ γTr(Cn ) and Tr(CP˜ ) ≤ kH Tr(Cn ) then if Tr(CP˜ ) ≤ kL Tr(Cn ) then
˜ ∈ P(P˜ ), ∀(p, q) ∈ [[0, κ − 1]]2 , Q(p, ˆ q) = P˜ ∀Q else α=
Tr(CP˜ ) − kL Tr(Cn ) kH Tr(Cn ) − kL Tr(Cn )
˜ ∈ P(P˜ ), ∀(p, q) ∈ [[0, κ − 1]]2 , Q(p, ˆ q) = αQ(p, ˆ q) + (1 − α)P˜ ∀Q end if end if ˆ ˜ ˜ return {Q} Q∈P(P )
11
Marc Lebrun, Miguel Colom, Jean-Michel Morel
3
Obtaining the Covariance Matrix of Noise Patches
In order to help the reader with the new notations introduced in this section, a summary is presented in tables 3 and 4, including new notations and parameters. DCT D Ni Mi
Discret Cosine Transform DCT matrix κ × κ stochastic noise patch model at intensity i estimated variance matrix in DCT space at intensity i Table 3: Notations introduced in Section 3.
Nb Nf Sf
number of bins used during the noise estimation (depends on the size of the image) number of iterations for the matrix filtering algorithm size of the filtering window Table 4: Parameter notations introduced in Section 3.
Colom et al., [4] and [5], proposed an adaptation of the Ponomarenko et al. [19] method estimating a frequency dependent noise to estimate noise in JPEG images. Given a patch size κ × κ, the method extracts from the image a set with fixed cardinality of sample blocks with very similar patches in DCT space, which are therefore likely to contain only noise. These noise blocks are transformed by a DCT, and an empirical standard deviation of their DCT coefficients is computed. This gives a noise model that is proved in [4] and [5] to be accurately consistent with the noise observed in JPEG images. This algorithm computes for every intensity i a multi-frequency noise estimate given by a κ2 × κ2 matrix � (8) Mi := E DNi (DNi )t where:
• D is the κ2 × κ2 matrix of the discrete cosine transform (DCT) ; • Ni denotes the κ × κ stochastic noise patch model at intensity i. For a given intensity i, the covariance matrix of the noise is by definition � Cov(Ni ) = E Ni Nit
which leads to
DCov(Ni )Dt = = = =
� DE Ni Nit D�t E DNi Nit Dt � E DNi (DNi )t Mi
(9)
thanks to Equation (8). Since D−1 = Dt , then from Equation (9) we get Cov(Ni ) = Dt Mi D.
(10)
This obtention is summarized in Algorithm 8. Since the estimation of the covariance matrix of the noise is channel independent, the pseudo-code only describes the computation for one channel. 12
The Noise Clinic: a Blind Image Denoising Algorithm
Algorithm 8 Obtention of Cn from the estimation of the variances of the noise in DCT space. Input : Set of diagonal matrices of the estimation of the variances of the noise in DCT space (Mi )i , ⊲ Equation (8) Input : DCT matrix D, Input : Patch size κ. Output : Set of covariance matrices of the noise (Cni )i . for each i do for each p = 0 to κ2 − 1 do for each q = 0 to κ2 − 1 do Cni (p, q) =
2 −1 κX
k=0
end for end for end for return (Cni )i .
3.1
D (k, p) Mi (k, k) D (k, q)
Are Noise Covariances Negligible in the Block DCT Space?
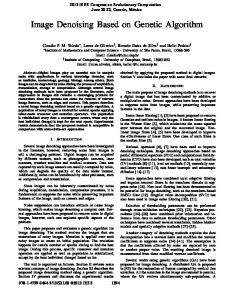
The method summarized in the preceding section only estimates the variances of the DCT coefficients of noise blocks and not their covariances. The covariance matrices are therefore assumed to be diagonal, which amounts to assume that the DCT decorrelates the noise. A formal argument can be given in favor of this assumption. Assume that the initial image noise was white Gaussian, and that the image has undergone a symmetric, real, periodic linear filter H. Then this filter corresponds to applying a diagonal operator to the image in the DCT frequency domain. Thus the noise covariance of the filtered noise remains diagonal in the DCT domain. Yet, this argument is only valid for a global image DCT. Here, because we need a signal dependent noise model, we are estimating it on local DCTs applied to each block. It is therefore no more true that the blocks have undergone a periodic convolution filter. Thus, it cannot be exactly true that after the application of a global linear filter, the noise block DCTs have a diagonal covariance. To check nonetheless the quantitative validity of this assumption, we tested three different filters applied to a white noise: • H1 with coefficients
1 4
�
1 1 1 1
�
supported by the pixels (− 12 , − 21 ), ( 12 , 12 ), ( 12 , − 21 ), (− 12 , 12 );
1 2 1 1 2 4 2 ; • H2 the centered filter with coefficients 16 1 2 1
1 2 4 8 4 2 1 1 2 4 8 16 8 4 2 . • H3 the centered filter with coefficients 88 1 2 4 8 4 2 1 The noise image u˜ was a 256 × 256 Gaussian white noise with mean 128, and standard deviation σ = 20. After convolution, we extracted N distinct κ × κ patches {Pn }n∈N from the image and a 2D normalized DCT was applied on them. Finally, their empirical κ2 × κ2 covariance matrix C was 13
Marc Lebrun, Miguel Colom, Jean-Michel Morel
computed as ∀(p, q), (i, j) ∈ [[0, κ − 1]]2 , N 1 Xˆ C(p, q, i, j) = P (p, q)Pˆ (i, j) N n=1 ! N ! N X 1 Xˆ P (p, q) Pˆ (i, j) . − 2 N n=1 n=1
(11)
These covariances matrices can be visualized by the absolute value of their coefficients |Ci,j |, normalized in [0, 1] so that the largest coefficient is set equal to 1, and the smallest equal to 0. The following colour code is used in the visualization: a coefficient appears in blue if it is near 0; in green if it is near 0.5 and in red if it is near 1. The results for various patch sizes are shown in Figure 1, 2 and 3. These illustrations and the quantitative tables 5, 6 and 7 confirm that the block DCT noise covariance matrices are nearly diagonal. κ mean {|Ci,j |}i6=j mean {|Ci,j |}i=j median {|Ci,j |}i6=j median {|Ci,j |}i=j
4 0.83 24.89 0.04 19.42
6 0.48 25.31 0.03 17.14
8 0.31 24.95 0.02 16.28
16 0.10 24.73 0.01 14.41
Table 5: Statistics of the estimated DCT covariance matrix of noise filtered by H1 .
κ mean {|Ci,j |}i6=j mean {|Ci,j |}i=j median {|Ci,j |}i6=j median {|Ci,j |}i=j
4 0.48 14.59 0.010 6.75
6 0.28 13.95 0.008 4.50
8 0.19 14.45 0.005 3.77
16 0.06 14.23 0.002 2.35
Table 6: Statistics of the estimated DCT covariance matrix of noise filtered by H2 .
κ mean {|Ci,j |}i6=j mean {|Ci,j |}i=j median {|Ci,j |}i6=j median {|Ci,j |}i=j
4 0.22 9.28 0.020 3.32
6 0.15 8.94 0.016 2.86
8 0.10 9.04 0.010 2.44
16 0.04 8.51 0.003 1.73
Table 7: Statistics of the estimated DCT covariance matrix of noise filtered by H3 . As one can see, strict covariance coefficients are really small before variance coefficients, which strengthen the DCT decorrelation assumption. So from now on, only variance coefficients will be considered in DCT space.
3.2
Covariance Matrix Filtering
Since the noise covariance matrices can only be estimated for sparse bins in the intensity range, an interpolation must be applied to obtain a covariance matrix of the noise for each intensity. The 14
The Noise Clinic: a Blind Image Denoising Algorithm
Figure 1: Visualization of the noise covariance matrices in DCT space after applying filter H1 to illustrate that it is almost diagonal. From left to right, patch size κ = 4, 6, 8.
Figure 2: Visualization of the noise covariance matrices in DCT space after applying filter H2 to illustrate that it is almost diagonal. From left to right, patch size κ = 4, 6, 8.
Figure 3: Visualization of the noise covariance matrices in DCT space after applying filter H3 to illustrate that it is almost diagonal. From left to right, patch size κ = 4, 6, 8.
covariance matrices must be smoothed before such an interpolation. This can be obtained by a regularization of the covariance matrices in DCT space before applying the inverse DCT to get back a covariance matrix in the image domain. We found that a robust regularization could be performed 15
Marc Lebrun, Miguel Colom, Jean-Michel Morel
as follows: 1. For each frequency independently, perform a linear interpolation between the bin values to obtain a noise curve for this frequency, giving the variance as a function of the signal i. Smooth this curve by applying a sliding average; 2. For every bin, replace each matrix coefficient by the median of its four neighbours and itself. This filtering is summarized in Algorithm 9. Since the filtering is channel independent, the pseudocode only describes the filtering for one channel. Algorithm 9 Covariance matrix filtering. Input : Number of bins Nb ; Input : Patch size κ; Input : Set of covariance matrices {Cb }b∈Nb of size κ2 × κ2 Input : Iteration number Nf ; Input : Filtering window size Sf ; Input : Mean values for each bin {mb }b∈Nb . ˜ b }b∈N . Output : Set of filtered covariance matrices {C b Iteration of the filtering for each scale n = 1 to Nf do Regularize frequency among matrices for (p, q) ∈ [1, κ2 ] × [1, κ2 ] do Interpolate standard deviation for each intensity value i ∈ [0, 255] into {Vi }i∈[0,255] for each b = 1 to Nb do Cb (p, q)2 − Cb−1 (p, q)2 α= mb − mb−1 Cb−1 (p, q)2 mb − Cb (p, q)2 mb−1 β= mb − mb−1 for each i = mb−1 + 1 to mb do Vi = αi + β. end for end for Smooth bin values for each b = 1 to Nb do 21 Sf X 1 Vi Cb (p, q) = 2Sf + 1 i=−S f
end for end for Regularize matrices for each b = 1 to Nb do For each frequency, replace it by the median of its neighbours for (p, q) ∈ [1,pκ2 ] × [1, κ2 ] do ˜ b (p, q) = median (Cb (p ± 1, q ± 1)2 , Cb (p, q)2 ) C end for end for end for ˜ b }b∈N . return {C b
16
The Noise Clinic: a Blind Image Denoising Algorithm
3.3
Computing the DCT Matrix
A κ × κ patch P is represented in 2D by a matrix p1,1 · · · .. P = .
pκ,1 · · ·
or in 1D by a vector
p1,κ .. , .
(12)
pκ,κ
P = (p1,1 , · · · , p1,κ , p2,1 , · · · , p2,κ , · · · , pκ,1 , · · · , pκ,κ )t .
(13)
This section defines a κ2 × κ2 matrix D such that DP = DCT (P ), where DCT is the two-dimensional orthonormal forward discrete cosine transform (DCT) defined by ∀(i, j) ∈ [[1, κ]]2 , DCT (xi,j ) = Xi,j � � � � κ−1 X κ−1 X 1 π p+ i = αi,j xp,q cos κ 2 q=0 �p=0 � � � π 1 cos q+ j , κ 2
and αi,j are the normalization coefficients 1 if (i, j) = (0, 0) √ κ 2 αi,j = if i = 0 and j > 0 or j = 0 and i > 0 κ 2 otherwise. κ
(14)
(15)
According to the indexation of Equation (13), one can set the indices of D coefficients as (i, j) ∈ [[1, κ2 ]] × [[1, κ2 ]], i = aκ + b, (a, b) ∈ [[1, κ]] × [[1, κ]] and j = mκ + n, (m, n) ∈ [[1, κ]] × [[1, κ]]. Thus we have D(i, j) = D(aκ + b, mκ � +�n) � � π 1 = αa−1,b−1 cos m−1+ (a − 1) κ 2� � � � π 1 cos n−1+ (b − 1) . κ 2
4 4.1
The Multiscale Algorithm The Mean Sub- and Up-Sampling Method
Classic denoising algorithms such as BM3D (Dabov et al. [7]), NL-means (Buades et al. [2]), K-SVD (Mairal et al. [17], [18]), Wiener filters applied on DCT (Yaroslavsky et al. [26], [25]) or on wavelet transform (Donoho et al. [24]) and the total variation minimization (Rudin et al. [23]) achieve good results for moderate noise (σ ≤ 20). Yet for larger noise artifacts inherent to each method (and different for each method) start appearing. In particular all keep an often disturbing low frequency noise. A natural idea to deal with low frequency noise is to involve a coarse to fine multiscale procedure denoising the image progressively at all scales. We refer to [13] for a discussion of the advantages of a multiscale procedure. The proposed multiscale algorithm subsamples recursively the 17
Marc Lebrun, Miguel Colom, Jean-Michel Morel
image into four channels that are partly redundant. The four channels are obtained by moving the sub-sampling grid by respectively (0, 0), (1, 0), (0, 1), (1, 1). In that way there is enough information for up-sampling after denoising the denoised images at the lower scale. We shall denote by s the current dyadic scale of the multiscale algorithm. For the particular case of white noise, the aim of the sub-sampling is to obtain from u˜s an image u˜s+1 where the standard deviation of the noise has been divided by two compared to the noise contained in u˜s . To get this result, one can use a filter f (i, j) satisfying X X 1 f (i, j) = 1 and f (i, j)2 = . 4 i,j i,j The simplest filter coping with these conditions is the average filter F, defined by ( 1 if (i, j) ∈ [(0, 0), (0, 1), (1, 0), (1, 1)] , F(i, j) = 4 0 otherwise.
which averages each group of four adjacent neighboring pixels. There are four different filter+subsample results, as shown in Figure 4. Moreover if the image u˜s is well-sampled, so is u˜s ∗ F. Thus, the difference image is not aliased. Since all sub-sampled images are available, the noise estimation can
Figure 4: Four different ways to average red neighbors of the yellow reference pixel. work with the same amount of samples at every scale. All sub-sampled images must also be denoised. They will be processed jointly in a single image, in order to avoid creating artificial borders. The four sub-sampled images are regrouped in one mosaic image, as shown in Figure 5 and described in Algorithm 11. The boundaries of the sub-images are in that way better denoised, because they are included in a smooth larger image. The sub-sampling method is summarized in Algorithm 10. As it is channel independent, the pseudo-code only describes the sub-sampling for one channel. The aim of the up-sampling is to go back to the upper scale, after denoising the four sub-images obtained by sub-sampling as seen in Section 4.1. The four sub-images u˜1 , u˜2 , u˜3 and u˜4 have their pixel center (resp. in red, purple, green and blue in Figure 6) located at the center of four pixels of u˜ (in black in Figure 6). Thus they are shifted by ± 12 in both coordinate directions. The reconstruction of the pixels of u˜ (see the example of the pixel in yellow in Figure 6) will be done by averaging their four neighbors, each one belonging to each sub-image. The up-sampling method is summarized in Algorithm 12. As it is channel independent, the pseudo-code only describes the up-sampling for one channel. Contrarily to raw images, in JPEG images the noise increases at lower scales, as illustrated in Figure 7, which are the noise curves of the image shown in Figure 21. This figure displays average noise curves for high and low frequencies respectively, in the three scales noise estimation from a JPEG image. The low-frequency noise is not altered by JPEG and becomes a high-frequency noise after three2 subsampling operations. 2
Since JPEG transform is based on the 8 × 8 DCT transform, after three subsamplings the 8 × 8 pixels patches
18
The Noise Clinic: a Blind Image Denoising Algorithm
Figure 5: Left: mosaic of the scale 1 sub-images. Right: mosaic of the scale 2 sub-images, The input image has scale 0.
Figure 6: Position of the center of pixels in the original image u˜ in black, in the four sub-images u˜1 in red, u˜2 in purple, u˜3 in green and u˜4 in blue. The yellow pixel will be reconstructed by averaging the top left red pixel, the top right purple pixel, the bottom left green pixel and the bottom right blue pixel of its four pixel neighborhood.
The whole coarse to fine multiscale procedure of the Noise Clinic is summarized in Algorithm 13. During the sub-sampling the four sub-images are kept and assembled in a mosaic to be denoised together. It follows that for each scale, the mosaic keeps the original image size. Thus the complexity for the algorithm is approximately equal to N times the complexity of the one scale algorithm.
4.2
Parameters
Even if the final algorithm is fully automatic, and the only parameter tunable by the user is the number of scales, other parameters listed below are part of the algorithm: • Patch size κ; • Number of similar patches⋆ Nmin ; become a single pixel. Thus, at the third scale the noise is only high-frequency and uncorrelated.
19
Marc Lebrun, Miguel Colom, Jean-Michel Morel
Algorithm 10 Sub-sampling of one image into four sub-images. Input : Image u of size w × h. Output : Four sub-images (uk )k∈[[1,4]] of size w2 × h2 . Check the size of u if w ≡ 1 (mod 2) then Add one column to u by symmetry. end if if h ≡ 1 (mod 2) then Add one line to u by symmetry. end if Average the pixels for each i = 0 to h2 − 1 do for each j = 0 to w2 − 1 do Get the first sub-image u1 (i, j) = 41 (u(2i, 2j) + u(2i + 1, 2j) + u(2i, 2j + 1) + u(2i + 1, 2j + 1)) Get the second sub-image if j = w2 − 1 then u2 (i, j) = 12 (u(2i, 2j + 1) + u(2i + 1, 2j + 1)) else u2 (i, j) = 41 (u(2i, 2j + 1) + u(2i + 1, 2j + 1) + u(2i, 2j + 2) + u(2i + 1, 2j + 2)) end if Get the third sub-image if i = h2 − 1 then u3 (i, j) = 12 (u(2i + 1, 2j) + u(2i + 1, 2j + 1)) else u3 (i, j) = 14 (u(2i + 1, 2j) + u(2i + 2, 2j) + u(2i + 1, 2j + 1) + u(2i + 2, 2j + 1)) end if Get the fourth sub-image if i = h2 − 1 and j = w2 − 1 then u4 (i, j) = (u(2i + 1, 2j + 1)) else if i = h2 − 1 then u4 (i, j) = 12 (u(2i + 1, 2j + 1) + u(2i + 1, 2j + 2)) else if j = w2 − 1 then u4 (i, j) = 12 (u(2i + 1, 2j + 1) + u(2i + 2, 2j + 1)) else u4 (i, j) = 41 (u(2i + 1, 2j + 1) + u(2i + 2, 2j + 1) + u(2i + 1, 2j + 2) + u(2i + 2, 2j + 2)) end if end for end for return (uk )k∈[[1,4]] . • Maximal number of similar patches Nmax ; • Size of the search window⋆ η; • Threshold to choose more similar patches⋆ ; • Thresholds for homogeneous area kL and kH ; • Number of scales N ; 20
The Noise Clinic: a Blind Image Denoising Algorithm
Algorithm 11 Construct a mosaic image from a set of sub-images. Input : Set of sub-images {uks }k∈[[1,4s ]] at the current scale s, Input : Size (ws , hs ) of sub-images. Output : Size (wm , hm ) of output mosaic image, Output : Mosaic image um . Obtention of the size of the mosaic √ s N= 4 wm = N w s hm = N h s Loop over sub-images for p = 0 to N − 1 do for q = 0 to N − 1 do Loop over pixels for i = 0 to hs − 1 do for j = 0 to ws − 1 do Position initialization n = pN + q if p ≡ 0 (mod 2) then di = i else di = hs − 1 − i end if if q ≡ 0 (mod 2) then dj = j else dj = ws − 1 − j end if Copy pixel values into the mosaic um (di + phs + i, dj + qws + j) = uns (i, j) end for end for end for end for return (wm , hm ) and um . • Multiplicative factor γf . Parameters followed by ⋆ are directly dependent on the size of the patches, as determined in [12]. The other parameters will be discussed in this section. 4.2.1
Influence of the Patch Size κ
As shown in [12], the patch size directly depends on the noise strength. Here, the noise is signal dependent, and it will be very difficult to adapt the patch size to the intensity (and noise level) of the current 3D group. Furthermore, the size of the patches used during the noise estimation is the same as the one used during the denoising. To avoid useless complexity, a fixed size was chosen for all intensity values. It must be as small as possible, to avoid loosing detail by inaccurate local patch models in the Bayesian estimate. Furthermore, the algorithm being multiscale, the real size in ratio to the original image size doubles at each scale, which justifies again taking the smallest possible 21
Marc Lebrun, Miguel Colom, Jean-Michel Morel
Algorithm 12 Up-sampling of four sub-images into one. Input : Four sub-images (uk )k∈[[1,4]] of size w2 × h2 . Output : Image u of size w × h. for each i = 0 to h − 1 do for each j = 0 to w − 1 do Get the indexes of sub-images p1 = ⌊ 2i ⌋; p2 = ⌊ i−1 ⌋; q1 = ⌊ 2j ⌋; q2 = ⌊ j−1 ⌋. 2 2 Top left pixel if i = 0 and j = 0 then u(i, j) = u1 (p1 , q1 ) First row else if i = 0 then u(i, j) = 12 (u1 (p1 , q1 ) + u2 (p1 , q2 )) First column else if j = 0 then u(i, j) = 12 (u1 (p1 , q1 ) + u3 (p2 , q1 )) All the rest of the image else u(i, j) = 14 (u1 (p1 , q1 ) + u2 (p1 , q2 ) + u3 (p2 , q1 ) + u4 (p2 , q2 )) end if end for end for return u. size. For these combined reasons, the size of patches for all steps and all scales in the Noise Clinic was fixed to κ = 4. 4.2.2
Maximal Number of Similar Patches Nmax
The aim of this parameter is to allow the possibility to chose the similar patches randomly. Since in homogeneous areas the color estimation is obtained as an average of the colors of the whole 3D group, we need the largest possible number of similar patches to get the smallest noise influence on it. Yet taking Nmax = η 2 is not optimal. Indeed, the algorithm is sped up by never taking as reference patch a patch that has previously been taken in group of similar patches. Thus in homogeneous areas all patches of the search window will not be re-used as reference patches. This may cause staircase artifacts in homogeneous areas. In order to avoid them, one solution is to chose randomly the similar η2 patches, which leads to chose Nmax smaller than η 2 . According to these arguments, Nmax = is a 2 good compromise. The interest of the random selection among the eligible patches is illustrated in Figure 8. 4.2.3
Influence of the Threshold of Similarity τ
The number of eligible patches for the random selection depends directly on τ , being defined by ˜ such that d(Q, ˜ P˜ ) ≤ τ basic } for the first step, and by {Q ˜ such that d(Q, ˜ P˜ ) ≤ τ final } for the {Q second step. The value of τ final is the same as the one determined in [12], i.e. τ final = 3. The value of τ basic is 22
The Noise Clinic: a Blind Image Denoising Algorithm
Noise curve
12
Noise curve
25
10
8
Standard deviation
Standard deviation
20
6
4
15
10
5 2
0 0
50
100
150
200
0 0
250
50
100
Intensity
Noise curve
12
150
200
250
200
250
200
250
Intensity
Noise curve
25
10
8
Standard deviation
Standard deviation
20
6
4
15
10
5 2
0 0
50
100
150
200
0 0
250
50
100
Intensity
Noise curve
12
150 Intensity
Noise curve
25
10
8
Standard deviation
Standard deviation
20
6
4
15
10
5 2
0 0
50
100
150
200
0 0
250
Intensity
50
100
150 Intensity
Figure 7: Average noise curves for a typical JPEG-encoded image (shown in Figure 21). From left to right: low frequencies, high frequencies. From top to bottom: scale 2, scale 1, scale 0. Instead of being divided by two at each scale (as it should happen with white noise), the noise grows in lower scales, where JPEG has not removed it.
set to 3
Nc X
αc2 Tr(Cn )2c , since typically the distance between similar patches corrupted by Gaussian
c=1
noise of standard deviation σ should be below 3σ 2 . 23
Marc Lebrun, Miguel Colom, Jean-Michel Morel
Algorithm 13 Noise Clinic Input : Noisy image u˜0 , Input : Number of scales N . Output : Denoised image uˆ0 . Part 1 : Builds the image scale pyramid and records the difference images for each scale s = 1 to N − 1 do Let {˜ uks−1 }k∈[[1,4s−1 ]] be the set of noisy subsampled images obtained at the previous scale. (For scale s = 1, it is u˜0 ); for k = 1 to 4s−1 do 4(k−1)+i Downsample u˜ks−1 into 4 sub-images : {˜ us }i∈[[1,4]] ⊲ Section 4.1, Algorithm 10 Save difference images for this scale : d˜ks−1 = u˜ks−1 − U {˜ u4(k−1)+i }i∈[[1,4]] s
�k
.
end for if s = N − 1 then k Set {˜ vN ukN −1 }k −1 }k = {˜ k Build the noisy mosaic image m ˜ N −1 from {˜ vN ⊲ Algorithm 11 −1 }k∈[[1,4N −1 ]] . end if end for Part 2 : Estimates noise and denoises bottom-up in the pyramid for s = N − 1 to 0 do Estimate the noise covariance matrices {Dt Mi D}i on m ˜ s. ⊲ Section 3, Algorithm 8 Denoise m ˜ s with the modified NL-Bayes by using {Dt Mi D}i to obtain m ˆ s. ⊲ Section 2, ⊲ Algorithms 3 and 4 if s > 0 then for k = 1 to 4s−1 do Up-sample {ˆ us,4(k−1)+i }i∈[[1,4]] ⊲ Algorithm 12 k k ˜ Add the saved details ds−1 to get v˜s−1 . end for k Build the mosaic image of the next scale m ˜ s−1 from {˜ vs−1 }. ⊲ Algorithm 11 else uˆ0 = uˆ10 end if end for return uˆ0 . 4.2.4
Influence of the Thresholds for the Homogeneous Areas, kL and kH
Those parameters are quite crucial. If they are taken too small, the homogeneous area algorithm will be inactive, and much noise will be left on homogeneous areas. If they are chosen too large, a lot of detail will be removed. The homogeneity criterion must be applied at all scales, but for lower scales this criterion must become far more conservative. Indeed, despite the fact that we got the same amount of pixels at each scale, the noise estimator is not as accurate as at the finest scale because sub-images are too small, and large details may be seen as noise which is removed with the homogeneity criterion. Determining optimal values for these parameters is hard, because they depend on the accuracy of the noise estimation, and directly on the image. Our choice will be to set conservative values to these parameters, simply securing that the criterion is visually helpful for a large proportion of 24
The Noise Clinic: a Blind Image Denoising Algorithm
With random selection
Without random selection
Figure 8: From left to right: Blind denoising with and without the random selection of similar patches on a detail of “Dog” image.
images, but that it never degrades images by causing excessive blur. Therefore, the retained values are kL kH
Lower scales 2.0 4.0
Finest scale 4.0 8.0
The importance of setting conservative values and the crucial importance of these two parameters are illustrated in Figure 9. One can observe that the sky is well denoised with (kL = 4, kH = 8) for the finest scale, and that the details of the trees and the houses are preserved, whereas if (kL , kH ) are taken too large, details start disappearing, without getting any improvement on the sky. To improve the detection of homogeneous areas, the criterion based on the difference between the mean and the barycenter of the 3D group helps slightly (see Algorithm 7), especially on borders, as shown in Figure 10. One can see that this improvement does not affect the sky, but helps preserve tiny details on the trees and the houses. 4.2.5
Influence of the Number of Scales N
Theoretically any number of scales can be chosen. At a very coarse scale the noise should be null and estimated as such, so that no denoising would eventually occur. However, if too many scales are chosen, one may observe some detail loss and color attenuation with the Noise Clinic. At the first scale this sort of detail is small and hardly distinguishable from noise; it will be hopelessly removed by the denoising. Yet, for lower scales, some huge details may disappear that are clearly not noise. There are two reasons at least for this phenomenon: As more scales are used, even if all sub-images are used to estimate the noise, the noise estimation accuracy gets harder for the lowest scales. Indeed when sub-images are too small, there are no more homogeneous areas left in them to estimate the noise. Furthermore, in such small images some signal may be confused with noise, thus causing a noise overestimation. Thus, it is almost always better to use a minimal number of scales, in most cases not more than three: as JPEG compression works on 8 × 8 patches, after three scales the influence of the JPEG 25
Marc Lebrun, Miguel Colom, Jean-Michel Morel
Original noisy image
kL = 2, kH = 4
Crop of the noisy image
kL = 4, kH = 8
kL = 8, kH = 16
kL = 16, kH = 32
Figure 9: Blind denoising with increasing kL , kH parameters for the finest scale on “Postcard” image, with (kL = 2, kH = 4) for lower scales.
compression is no more visible. However, for some images that have undergone a zoom in, threshold transforms, or for scans of old photographs, this rule is no more valid. We found that for some images with very low frequency noise it was sometimes better to use up to five scales. From that point of view our “blind denoising” is not fully blind and requires an user’s evaluation on the number of scales involved. For all these reasons, a conservative default value is set to N = 2 on the web-demo, but the possibility to change this parameter is let to the user. We found that the value N = 2 works for a strong majority of images of unknown origin. Illustrations of the use of the “right” number of scales are presented in Figures 11, 12 and 13. 26
The Noise Clinic: a Blind Image Denoising Algorithm
Original noisy image
kL = 2, kH = 4, γ = 1
kL = 4, kH = 8, γ = ∞
Crop of the noisy image
kL = 8, kH = 16, γ = 1
kL = 16, kH = 32, γ = ∞
Figure 10: Blind denoising with increasing kL , kH parameters for the finest scale and with (γ = 1) and without (γ = ∞) the improved homogeneous criteria based on the difference between the mean and the barycenter of the 3D group on “Postcard” image, with (kL = 2, kH = 4) for lower scales.
For the “Bears” image in Figure 11 using only two scales gives a very nice result by eliminating the noise whereas tiny details such as the fur of the bear or wavelet on water remains. The corresponding difference image shows that only noise has been removed since one cannot distinguish any structure on it. By using four scales these tiny details are blurred out, since they may appear as noise at lower scales. These details therefore pop up in the corresponding difference image. For the “Girls” image in Figure 12, which presents a strong low-frequency noise, using two scales 27
Marc Lebrun, Miguel Colom, Jean-Michel Morel
Noisy image
Denoised image (2 scales)
Difference image
Denoised image (4 scales)
Difference image
Figure 11: Blind denoising when varying the number of scales on the “Bears” image.
is not enough. Going up to three scales provides a better result removing correctly low-frequency noise without destroying tiny details such as hairs. Notice the low frequency of the noise observable in the difference image for the three scales result. For the “Postcard” image in Figure 13, one can observe how tiny details remain when the number of scales increases, while some large details such as the clouds are removed if too many scales are being used. These details are seen as noise by the algorithm, whereas they really are structure. If only two scales are used, a slight low-frequency noise still remains. All results seen independently are equally agreeable, so the final choice must be left to the user. 4.2.6
Influence of the Multiplicative Factor γf
Some underestimation of the noise can be observed on old photographs. For such images, the webdemo allows the user to increase (or decrease) γf , which directly multiplies the noise curve at each 28
The Noise Clinic: a Blind Image Denoising Algorithm
Noisy image
Denoised image (2 scales)
Difference image
Denoised image (3 scales)
Difference image
Figure 12: Blind denoising when varying the number of scales on the “Girls” image.
step and each scale by this coefficient. One can tune the denoising result with this parameter. Yet for most images, the default value of γf = 1 is valid. Figure 14 shows an example of the influence of 29
Marc Lebrun, Miguel Colom, Jean-Michel Morel
Noisy image
Denoised image (2 scales)
Difference image
Denoised image (3 scales)
Difference image
Denoised image (4 scales)
Difference image
Figure 13: Blind denoising when varying the number of scales on the “Postcard” image.
the multiplicative factor.
30
The Noise Clinic: a Blind Image Denoising Algorithm
Noisy image
Denoised image (3 scales, γf = 1.0)
Difference image
Denoised image (3 scales, γf = 1.5)
Difference image
Denoised image (3 scales, γf = 2.0)
Difference image
Figure 14: Blind denoising when varying the multiplicative factor on the “Dujardin” image. 31
Marc Lebrun, Miguel Colom, Jean-Michel Morel
The default parameter values are summarized in Table 8. Description
Default value 4 2 κ −1 2 2 (lower scale) - 4 (finest scale) 4 (lower scale) - 8(finest scale) 1.0 2κ2
Parameter κ η N kL kH γ Nmin Nmax γf τ
Size of patches Size of the search window Number of scales Lower threshold for homogeneous area Higher threshold for homogeneous area Threshold to separate homogeneous area from edges Minimal number of similar patches Maximal number of similar patches Multiplicative coefficient of the estimated noise Similarity threshold
αY
Coefficient for weighting distance on the first step
αU
Coefficient for weighting distance on the first step
αV Nf Sf
Coefficient for weighting distance on the first step
q2
Number of iterations for the noise estimation filtering Size of the noise estimation filtering
5 10
η2 2
1.0 3.0 q
1 1 4
q
1 4
Table 8: Default parameter values of the Noise Clinic algorithm.
5
Results
5.1
Estimated Noise Curves and Illustrative Denoising Results
The Noise Clinic was applied to real noisy images for which no noise model was available. For each experiment we shall present the noisy input image and for each scale: • the noisy image where noise has already been removed at coarser scales; • the denoised image at this scale; • the difference image = noisy - denoised at this scale; • the average noise curve over high frequencies; • the average noise curve over low frequencies. For each scale larger than 1, the subsampled images are up-sampled to keep the original image size. Similarly, the noisy image shown at each scale is the sum of the upsampled version of the denoised sub-images of the previous scale and of the still noisy difference image kept in reserve. In other terms this image contains the remaining noise at the current scale; the noise at coarser scales has in principle already been removed. Visual results are shown in figures 15, 17, and 19. The corresponding noise curves are presented in Figures 16, 18, and 20. These experiments confirm that noise in JPEG images is not white, being signal and frequency dependent. Indeed, the noise curves are not flat, and they are not divided by two from a scale to the next, as they should if the noise were white.
32
The Noise Clinic: a Blind Image Denoising Algorithm
Noisy input image
Denoised output image
Difference image
Noisy (scale 2)
Denoised (scale 2)
Difference (scale 2)
Noisy (scale 1)
Denoised (scale 1)
Difference (scale 1)
Noisy (scale 0)
Denoised (scale 0)
Difference (scale 0)
Figure 15: Results of the Noise Clinic on the “Bears” image.
33
Marc Lebrun, Miguel Colom, Jean-Michel Morel
Low freq. av. curve (s. 2)
High freq. av. curve (s. 2)
Low freq. av. curve (s. 1)
High freq. av. curve (s. 1)
Low freq. av. curve (s. 0)
High freq. av. curve (s. 0)
Figure 16: Results of the noise estimation on the “Bears” image. The noise in this image is clearly colored: it increases with descending octaves instead of being divided by two, as it should if it were white.
34
The Noise Clinic: a Blind Image Denoising Algorithm
Noisy input image
Denoised output image
Difference image
Noisy (scale 2)
Denoised (scale 2)
Difference (scale 2)
Noisy (scale 1)
Denoised (scale 1)
Difference (scale 1)
Noisy (scale 0)
Denoised (scale 0)
Difference (scale 0)
Figure 17: Results of the Noise Clinic on the “Ship” image.
35
Marc Lebrun, Miguel Colom, Jean-Michel Morel
Low freq. av. curve (s. 2)
High freq. av. curve (s. 2)
Low freq. av. curve (s. 1)
High freq. av. curve (s. 1)
Low freq. av. curve (s. 0)
High freq. av. curve (s. 0)
Figure 18: Results of the noise estimation on the “Ship” image. The noise in this image is clearly not white: it has almost the same value whatever the scale, instead of being divided by two at each scale.
36
The Noise Clinic: a Blind Image Denoising Algorithm
Noisy input image
Denoised output image
Difference image
Noisy (scale 2)
Denoised (scale 2)
Difference (scale 2)
Noisy (scale 1)
Denoised (scale 1)
Difference (scale 1)
Noisy (scale 0)
Denoised (scale 0)
Difference (scale 0)
Figure 19: Blind denoising of the “Movie2” image.
37
Marc Lebrun, Miguel Colom, Jean-Michel Morel
Low freq. av. curve (s. 2)
High freq. av. curve (s. 2)
Low freq. av. curve (s. 1)
High freq. av. curve (s. 1)
Low freq. av. curve (s. 0)
High freq. av. curve (s. 0)
Figure 20: Noise estimation on the “Movie2” image, with typical concave shapes for the noise curves probably caused by the gamma-correction applied previous to compression.
38
The Noise Clinic: a Blind Image Denoising Algorithm
5.2
Result on a Typical Low-light JPEG Image Taken From a Cell Phone
The images shown in Figure 21 were taken in a bar with low light conditions, so the initial SNR was low. One can observe big colored spots caused by the demosaicking that are attenuated by the Noise Clinic. Yet, some structured JPEG artifacts are left behing, being self-similar.
Figure 21: Blind denoising on “Bar”, using three scales. From left to right, top to bottom : input noisy image, crop of the noisy image, crop of the output denoised image, crop of the difference image.
5.3
Results on Old Photographs
Figures 22, 23, and 24 show results obtained by the Noise Clinic on scans of old noisy photographs, the 1969 Apollo3 image and the 1998 Kleiner 4 image (it is advised to zoom in strongly on details). 3
This file is in the public domain because it was solely created by NASA. NASA copyright policy states that “NASA material is not protected by copyright unless noted”. http://dayton.hq.nasa.gov/IMAGES/LARGE/ GPN-2000-001849.jpg 4 Image licensed under the Creative Commons Attribution-Share Alike 3.0 Unported license, taken by Wikimedia Commons user Olaf1541, http://commons.wikimedia.org/wiki/File:Kleiner_hecht.png
39
Marc Lebrun, Miguel Colom, Jean-Michel Morel
Noisy image
Denoised image
Difference image
Figure 22: Top: original noisy image “Apollo”. Bottom: detailed result of the Noise Clinic by using 2 scales.
Noisy image
Denoised image
Difference image
Figure 23: Top: original noisy image “Kleiner”. Bottom: detailed result of the Noise Clinic by using 2 scales.
40
The Noise Clinic: a Blind Image Denoising Algorithm
Noisy image
Denoised image
Difference image
Figure 24: Top: original noisy image “Plane”. Bottom: detailed result of the Noise Clinic by using 2 scales.
5.4
Comparison to Portilla’s Blind BLS-GSM
Blind BLS-GSM introduced in [20] and [21] is a state-of-the-art blind denoising algorithm. It is multiscale and models wavelet coefficient patches at each scale, making a global Bayesian estimation of them as a Gaussian mixture. One can observe in Figure 25 how remarkably BLS-GSM deals with strongly structured noise, namely noise that is sparse in the Fourier domain. The Noise Clinic instead keeps it and even re-enforces it. In the images of Figure 26 with a less singular noise, the Noise Clinic performs instead better. This is due to the fact that the Noise Clinic is inherently local and therefore probably makes a better local distinction between noise and signal.
5.5
Comparison to One of the Best Commercial Software for JPEG Denoising: Neat Image
We end this experimental section with a comparison to the celebrated commercial software Neat Image 5 . Of course, as it is a commercial software, we cannot characterize the method underlying this software, so the comparison must remain purely qualitative. We used the free demo of this software with both “luminance” and “chrominance” denoising cursor put to 100%. For some images, Neat Image failed to estimate correctly the noise, so we used the manual tools for homogeneous area selection in order to produce the best visual result. It is important to notice here that this software is not fully automatic, contrarily to the Noise Clinic. For each produced images, the difference between the denoised result and the noisy input is given, to help the reader detect the denoising artifacts. The difference should contain only noise, and no image detail. These results are presented in Figures 27, 28, 29, 30, 31, 32. 5
Free demo available at http://www.neatimage.com/
41
Marc Lebrun, Miguel Colom, Jean-Michel Morel
Figure 25: Results of our blind denoising and of Blind BLS-GSM on several images from [20]. From left to right: Noisy image, result of the Noise Clinic, result of the Blind BLS-GSM algorithm. It is advised to zoom in by a 300% factor the digital document to examine details.
One can observe that Neat Image produces generally a smoother version than the Noise Clinic, with well flattened homogeneous areas, but to the cost of (sometimes) huge loss of image detail. On the contrary as one can easily observe on the difference images, the Noise Clinic rarely removes details, and it gives more “natural” looking results. It also appears that for small images, Neat Image fails to estimate correctly the noise, and generally produces an overestimation. Of course, the software gives a cursor for both luminance and chrominance denoising, to allow the user to manually adjust the denoising power. In the same spirit, the user may adjust the window for the noise estimation, to center it precisely on an homogeneous area. For a fair comparison, we used the automatic tools and cursor put to 100%. The Noise Clinic itself may be tuned too, by adjusting the thresholds of homogeneous area (kL , kH ) and the multiplicative factor γf .
42
The Noise Clinic: a Blind Image Denoising Algorithm
Figure 26: Comparing our blind denoising with Blind BLS-GSM on several images. It is advised to zoom in by a 400% factor the digital document to examine details. From left to right: Noisy image, result of the Noise Clinic, result of the Blind BLS-GSM algorithm.
43
Marc Lebrun, Miguel Colom, Jean-Michel Morel
Noisy input
Result of Neat Image
Difference with the noisy input
Result of the Noise Clinic using two scales
Difference with the noisy input
Figure 27: Comparison between the commercial software Neat Image and the Noise Clinic on the “Bears” image.
44
The Noise Clinic: a Blind Image Denoising Algorithm
Noisy input
Result of Neat Image
Difference with the noisy input
Result of the Noise Clinic using three scales
Difference with the noisy input
Figure 28: Comparison between the commercial software Neat Image and the Noise Clinic on the “Postcard” image.
45
Marc Lebrun, Miguel Colom, Jean-Michel Morel
Noisy input
Result of Neat Image
Difference with the noisy input
Result of the Noise Clinic using three scales
Difference with the noisy input
Figure 29: Comparison between the commercial software Neat Image and the Noise Clinic on the “Dog” image. 46
The Noise Clinic: a Blind Image Denoising Algorithm
Noisy input
Result of Neat Image
Difference with the noisy input
Result of the Noise Clinic using two scales
Difference with the noisy input
Figure 30: Comparison between the commercial software Neat Image and the Noise Clinic on the “Fibers” image.
47
Marc Lebrun, Miguel Colom, Jean-Michel Morel
Noisy input
Result of Neat Image
Difference with the noisy input
Result of the Noise Clinic using two scales
Difference with the noisy input
Figure 31: Comparison between the commercial software Neat Image and the Noise Clinic on the “Ship” image.
48
The Noise Clinic: a Blind Image Denoising Algorithm
Noisy input
Result of Neat Image
Difference with the noisy input
Result of the Noise Clinic using three scales
Difference with the noisy input
Figure 32: Comparison between the commercial software Neat Image and the Noise Clinic on the “Singer” image. Remark, by increasing the multiplicative factor γf up to 1.5, the Noise Clinic presents similar results than neat image (see Figure 33). 49
Marc Lebrun, Miguel Colom, Jean-Michel Morel
Noisy input
Result of the Noise Clinic using three scales, γf = 1.0
Difference with the noisy input
Result of the Noise Clinic using three scales, γf = 1.5
Difference with the noisy input
Figure 33: Illustration of the usefulness of the multiplicative factor γf to achieve visually better denoising result for difficult images. 50
The Noise Clinic: a Blind Image Denoising Algorithm
5.6
Validation
Whereas the purpose of the Noise Clinic is to denoise real-life images for which a “noise-free” ground truth is not available, we shall apply a “sanity check”, by comparing the Noise Clinic to two non-blind state-of-the-art denoising algorithms, BM3D and NL-Bayes. We have done a series of experiments on an ecclectic set of noiseless images to which white noise of a known variance was added. The contest was biased in the sense that BM3D and NL-Bayes assumed the noise to be Gaussian and were given the exact value. The Noise Clinic instead was applied blindly. One should therefore expect an inferior result for the Noise Clinic. The question is how much is lost by ignoring these two key pieces of information: a) that the noise is white Gaussian and b) the exact value of its standard deviation. A Gaussian noise with six different standard deviations was added to eight different noise-free images. Then the Noise Clinic was applied on those noisy images, with different number of scales. The average results over the eight different images are presented in Table 9. One can observe an average loss of approximately 0.8dB between NL-Bayes and the Noise Clinic (1 scale), and approximately 0.6dB between BM3D and the Noise Clinic (1 scale). The gap increases when using more scales. Nevertheless a clear gain in visual quality can be observed with 2 or 3 scales with respect to one scale. This (moderate) performance gap may be easily explained: • The NL-Bayes algorithm used in the Noise Clinic is slightly different from the classic non-blind one, especially the detection of homogeneous area. This detection is more subtle in the Noise Clinic to avoid to remove tiny details by overestimating the noise, whereas in NL-Bayes this detection takes into account the exact knowledge of the noise variance, which is not fair. The detection of flat regions is therefore sharper, and this accounts for most of the gap; • The noise estimation is of course noisy, depending on relatively few samples. It never gives a completely flat noise curve as can be expected. Then there is over- and under-denoising for some intensity ranges. σ 2 5 10 20 30 40
BM3D 45.76 40.61 36.84 33.23 31.18 29.71
NL-Bayes 46.16 40.96 37.06 33.43 31.22 29.63
Noise Clinic 1s. 45.07 40.31 36.26 31.55 30.08 28.59
Noise Clinic 2s. 44.30 39.64 35.95 31.47 29.22 27.94
Noise Clinic 3s. 43.09 39.13 35.47 30.58 28.51 27.93
Table 9: Average results in PSNR over eight noise-free images, corrupted by a white Gaussian noise of standard deviation σ. In bold the best PSNR for a given σ.
6
Disclaimers, How to Use the Sliders in the Online Demo
This method seems satisfactory for most JPEG images with unknown origin and with scanned old photographs. It compares favourably to commercial software, which tends to lose more detail. Nevertheless we observed that it was sometimes useful to boost the noise estimation by a factor that goes up to two, to improve the visual result. The reader is invited to check this fact for example with the “Singer” image, (see Figure 33). Also a decision must sometimes be made to increase the number of scales, up to three, to deal with thick grain. Thus, we left two sliders in the online demo. The method does not apply to impulse or multiplicative noise, that should be estimated and removed 51
Marc Lebrun, Miguel Colom, Jean-Michel Morel
by a separate procedure. Nevertheless, multiplicative noise can be handled by the Noise Clinic after it has been transformed to additive noise by taking the logarithm of the image. The local noise estimation procedure does not cope with highly structured noise, which is sparse in the frequency domain, like in the third infrared image of Figure 25. Strongly compressed images where blocking effects dominate over noise cannot be improved by the present method.
Acknowledgments Work partially supported by DxO-Labs, the Centre National d’Etudes Spatiales (CNES, MISS Project), the European Research Council (Advanced Grant Twelve Labours), and the Office of Naval Research (Grant N00014-97-1-0839).
Image Credits by NASA, not protected by copyright. , taken from [20] (C) J. Portilla.
, taken from the article “Gaussian KD-Trees for Fast High-Dimensional Filtering” by A. Adams, N. Gelfand, J. Dolson and M. Levoy. by Wikimedia Commons (user Olaf1541), Creative Commons Attribution-Share Alike 3.0 Unported license.
, Wikimedia Commons, public domain.
, NL-means archive.
References [1] F. J. Anscombe, The transformation of Poisson, binomial and negative-binomial data, Biometrika, 35 (1948), pp. 246–254. [2] A. Buades, B. Coll, and J.M. Morel, A non local algorithm for image denoising, IEEE Computer Vision and Pattern Recognition, 2 (2005), pp. 60–65. DOI: http://dx.doi.org/10. 1109/CVPR.2005.38. 52
The Noise Clinic: a Blind Image Denoising Algorithm
[3]
, Non-Local Means Denoising, Image Processing On Line, 2011 (2011). http://dx.doi. org/10.5201/ipol.2011.bcm_nlm.
[4] M. Colom and A. Buades, Analysis and Extension of the Percentile Method, Estimating a Noise Curve from a Single Image, Image Processing On Line, 3 (2013), pp. 332–359. http: //dx.doi.org/10.5201/ipol.2013.90. [5] M. Colom, M. Lebrun, A. Buades, and J.M. Morel, A non-parametric approach for the estimation of intensity-frequency dependent noise, in Proceedings of IEEE International Conference on Image Processing, 2014. [6]
, Obtaining a Complete Intensity-Frequency Noise Model from a Single Image, Image Processing On Line, (2014). Submitted.
[7] K. Dabov, A. Foi, V. Katkovnik, and K. Egiazarian, Image denoising by sparse 3D transform-domain collaborative filtering, IEEE Transactions on image processing, 16 (2007), pp. 3736–3745. DOI: http://dx.doi.org/10.1109/TIP.2007.901238. ´ bal, The generalized R´enyi image entropy as a noise indica[8] S. Gabarda and G. Cristo tor, Noise and Fluctuations in Photonics, Quantum Optics, and Communications, 6603 (2007). http://dx.doi.org/10.1117/12.725086. [9] P. Getreuer, Rudin-Osher-Fatemi Total Variation Denoising using Split Bregman, Image Processing On Line, 2012 (2012). http://dx.doi.org/10.5201/ipol.2012.g-tvd. [10] M. Lebrun, An Analysis and Implementation of the BM3D Image Denoising Method, Image Processing On Line, 2012 (2012). http://dx.doi.org/10.5201/ipol.2012.l-bm3d. [11] M. Lebrun, A. Buades, and J.M. Morel, A Nonlocal Bayesian Image Denoising Algorithm, SIAM Journal Image Science, 6 (2013), pp. 1665–1688. http://dx.doi.org/10.1137/ 120874989. [12]
, Implementation of the “non-local Bayes” (NL-Bayes) image denoising algorithm, Image Processing On Line, 2013 (2013), pp. 1–42. http://dx.doi.org/10.5201/ipol.2013.16.
[13] M. Lebrun, M. Colom, and J.M. Morel, Multiscale Image Blind Denoising, IEEE Transactions on Image Processing, (2014). Submitted. [14]
, The Noise Clinic, a universal blind denoising algorithm, in Proceedings of IEEE International Conference on Image Processing, 2014.
[15] M. Lebrun and A. Leclaire, An Implementation and Detailed Analysis of the K-SVD Image Denoising Algorithm, Image Processing On Line, 2012 (2012). http://dx.doi.org/10.5201/ ipol.2012.llm-ksvd. [16] Liu, W. Freeman, R. Szeliski, and S. Kang, Automatic estimation and removal of noise from a single image, IEEE Transactions on Pattern Analysis and Machine Intelligence, 30 (2008), pp. 299–314. DOI: http://dx.doi.org/10.1109/TPAMI.2007.1176. [17] J. Mairal, M. Elad, and G. Sapiro, Sparse representation for color image restoration, IEEE Transactions on Image Processing, 17 (2008), pp. 53–69. DOI: http://dx.doi.org/10. 1109/TIP.2007.911828. 53
Marc Lebrun, Miguel Colom, Jean-Michel Morel
[18] J. Mairal, G. Sapiro, and M. Elad, Learning multiscale sparse representations for image and video restoration, SIAM Multiscale Modeling and Simulation, 7 (2008), pp. 214–241. DOI: http://dx.doi.org/10.1137/070697653. [19] N. Ponomarenko, V. Lukin, K. Egiazarian, and J. Astola, A method for blind estimation of spatially correlated noise characteristics, in IS&T/SPIE Electronic Imaging, International Society for Optics and Photonics, 2010, pp. 753208–753208. http://dx.doi.org/10.1117/12. 847986. [20] J. Portilla, Blind non-white noise removal in images using Gaussian scale mixtures in the wavelet domain, Benelux Signal Processing Symposium, (2004). [21]
, Full blind denoising through noise covariance estimation using Gaussian scale mixtures in the wavelet domain, in IEEE International Conference on Image Processing, vol. 2, 2004, pp. 1217–1220. DOI: http://dx.doi.org/10.1109/ICIP.2004.1419524.
[22] T. Rabie, Robust estimation approach for blind denoising, IEEE Transactions on Image Processing, 14 (2005), pp. 1755–1765. DOI: http://dx.doi.org/10.1109/TIP.2005.857276. [23] L. I. Rudin, S. Osher, and E. Fatemi, Nonlinear total variation based noise removal algorithms, Physica D: Nonlinear Phenomena, 60 (1992), pp. 259–268. DOI: http://dx.doi.org/ 10.1016/0167-2789(92)90242-F. `s, and D.L. Donoho, The curvelet transform for image denoising, [24] J.L. Starck, E.J. Cande IEEE Transactions on image processing, 11 (2002), pp. 670–684. DOI: http://dx.doi.org/ 10.1109/TIP.2002.1014998. [25] L.P. Yaroslavsky, Local adaptive image restoration and enhancement with the use of DFT and DCT in a running window, in Proceedings of Society of Photo-Optical Instrumentation Engineers (SPIE), vol. 2825, 1996, pp. 2–13. DOI: http://dx.doi.org/10.1117/12.255218. [26] L.P. Yaroslavsky, K.O. Egiazarian, and J.T. Astola, Transform domain image restoration methods: review, comparison, and interpretation, in Proceedings of Society of Photo-Optical Instrumentation Engineers (SPIE) Conference Series, vol. 4304, May 2001, pp. 155–169. DOI: http://dx.doi.org/10.1117/12.424970. [27] G. Yu and G. Sapiro, DCT image denoising: a simple and effective image denoising algorithm, Image Processing On Line, 2011 (2011). http://dx.doi.org/10.5201/ipol.2011. ys-dct.
54