Proceedings of the 35th Hawaii International Conference on System Sciences - 2002
The Role of Coordination and Architecture in Supporting ASP Business Models P. R. Balasubramanian George M. Wyner Nitin Joglekar Boston University School of Management
[email protected] Abstract The recent increase in the volatility of E-business environments and the increasing need for enterprise to participate in business webs, have forced enterprises to contemplate outsourcing key business services to Application Service Providers (ASPs) -- entities that deploy, host, and manage access to applications delivered over networks on a subscription basis. In this paper, we hypothesize that a critical success factor for a successful ASP relationship between a provider and a consumer is managing the coordination activities involved. This we believe can be managed using an enterprise architecture which is extended over and coordinated between the service provider and the consumer of the service. To support these premises, we describe a methodology derived from coordination theory that helps in identifying and analyzing the coordination process. We apply this methodology to the ASP value chain and use the results to derive an architecture to support these coordination activities.
1. Introduction Over the last several years, companies have begun using application service providers (ASPs) to meet their application requirements. ASPs have their roots in the outsourcing of such services as: payroll and accounting in the 1960s, client-server software in the 1980s, and web hosting in the 1990s. With the arrival of the “web” in the 1990s, ASPs have emerged as a viable option. Market analysts project that application service revenues will grow from $ 1.67 Billion in 2000 to $5.78 Billion by 2004[9]. Over the last few decades, application software delivery has evolved from custom development to prepackaged or common off-the-shelf software development. In parallel to this, IT architectures have moved from closed, mainframe-based, centralized arrangements to open, internet-based, distributed arrangements. Furthermore, rapid business model changes have led to
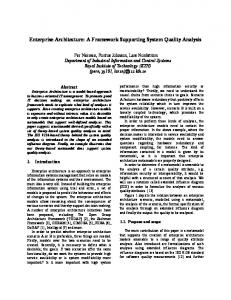
implementation speed up, escalation of risk and expenses over the application life cycle, a chronic shortage for qualified personnel, and increased total cost of ownership. To meet these trends, Application Service Providers (ASPs) offer a new model for companies to implement their business strategies. ASPs deliver (rental or lease basis) and manage (support) applications and computer services from remote data centers to multiple users via the Internet or a private network (www.allaboutasp.org) [10, 11]. Their core value propositions are to lower total cost of ownership, make monthly fees predictable, reduce timeto-market, provide access to market-leading applications, and allow businesses to focus on their core competencies [11]. An ASP’s value chain has four key sets of activities: solutions provisioning, solutions distribution, service integration and customer interface [11]. Provisioning covers activities related to the development of applications to be provided by ASPs to their customers and the development of the middleware that enables the remote delivery of these applications. Distribution describes the activities surrounding the delivery of applications to ASP customers. These activities include data center hosting, colocation services, and the enabling infrastructure for both the data center and network environment. Service integration activities are focused on integrating the ASP’s services into the customer’s operations. These activities include business process analysis, application customization and aggregation services, and customerbased integration. Customer interface activities focus on acquiring customers and managing the customer relationship.
Solutions Provisioning
Service Integration
Customer Interface
Source: Booz.Allen & Hamilton
Figure 1. ASP Value Chain
0-7695-1435-9/02 $17.00 (c) 2002 IEEE
Proceedings of the 35th Annual Hawaii International Conference on System Sciences (HICSS-35’02) 0-7695-1435-9/02 $17.00 © 2002 IEEE
Solutions Distribution
1
Proceedings of the 35th Hawaii International Conference on System Sciences - 2002
Even though the ASP industry is growing strongly, a major shakeout is already beginning. According to the Gartner Group, mergers, bankruptcies, and acquisitions will shrink the number of players in this market by as much as 40% by the end of 2002 [5]. ASPs are struggling to be profitable and to win over enterprises, which have been slow to adopt their services. A major reason for this is the lack of standards for information and knowledge transfer in service provisioning. Such standards will make it easier for businesses to sign up for and use services. For example, there is currently a disconnect between Service Integration and Solutions Distribution (e.g., managed network services and basic connectivity products and services) (see Figure 1). In general there is a need for activities that can manage the interactions between various components of the value chain in a standard way. The approach we will take to understanding and managing these activities is to analyze the structure of the process underlying ASP service delivery using the coordination theory perspective as developed by Malone and colleagues [12]. This theory is founded on a definition of coordination as “the act of managing dependencies between activities” [12]. We use the analysis to generate requirements definition document for planning the enterprise’s architecture. We begin in the next section with an introduction to coordination theory. In section 3, we describe the methodology for analyzing the structure of a process of a business from a coordination perspective. Then, in section 4, we apply our methodology to the context of ASPs. Next, we close the gap between the dependency requirements and solution strategy in section 5. We conclude with some suggestions for future work.
2. Coordination theory A principle benefit of coordination theory is that it allows us to abstract away certain key decisions about how a process is organized and to explore alternative ways of organizing the process. (The description of coordination theory given here closely follows the treatment given by Wyner [19].) In coordination theory, a process (e.g. a business process) is represented primarily as a set of activities and dependencies among those activities. The dependencies identified for a process are drawn from three types: A flow dependency (Figure 2a) captures the issues which arise when a resource flows from the activity which produces it to the activity which consumes it. The three issues which must be addressed in managing a flow dependency are: Usability. Does the resource as produced correspond to what is needed by the consuming activity? Synchronization. Does the resource arrive at the optimum (or satisfactory) time for use by the consumer?
Accessibility. How is the resource made available to the consumer? Three options frequently considered are: move resource to consumer, move consumer to resource, and colocate producer and consumer. A sharing dependency (Figure 2b) identifies the issues which arise when a single resource is consumed by multiple activities. A fit dependency (Figure 2c) identifies the issues which arise when a single resource is produced through the joint action of multiple activities. Producer
Consumer
Figure 2a. Flow dependency Consumer 1
Producer
Sharing Dependency
Consumer 2
Figure 2b. Sharing dependency Producer 1
Fit Dependency
Consumer
Producer 2
Figure 2c. Fit dependency Graphically, a process can be represented as a bipartite graph of activities and resources. (A bipartite graph contains two types of nodes such that each node of one type is linked only to nodes of the complementary type.) In general an activity may both consume and produce resources and these relationships are represented as resource flows into and out of activities. We will use the term resource flow graph (RFG) to refer to this kind of representation. (This approach to process modeling and the term resource flow graph are due to Gilad Zlotkin [20].)
2.1. Representing dependencies: the dependency diagram The dependencies associated with a process are represented in a dependency diagram. As with the resource flow graph described above, this is a bipartite graph. In this case the graph includes activities and their associated dependencies.
0-7695-1435-9/02 $17.00 (c) 2002 IEEE
Proceedings of the 35th Annual Hawaii International Conference on System Sciences (HICSS-35’02) 0-7695-1435-9/02 $17.00 © 2002 IEEE
Flow Dependency
2
Proceedings of the 35th Hawaii International Conference on System Sciences - 2002
We adopt the perspective, proposed by Zlotkin [20], that dependencies can always be framed in terms of resource flows. This resource-based approach to dependencies allows one to move in a natural way from a resource flow graph to a dependency diagram. It follows from the dependency definitions given above that each resource in a resource flow graph signals the presence of one or more dependencies according to the following scheme: Resource flows
Producer
resource
Dependencies
Consumer
is equivalent to
Producer
Flow Dependency
Producer
Sharing Dependency
Consumer1
Producer
resource
Consumer
Consumer1
is equivalent to
Consumer2
Consumer2
Producer1
Producer1
resource
Consumer
is equivalent to
Producer2
Fit Dependency
Consumer
Producer2
Figure 3. Mapping between resource flow graph and dependency diagram Note that it is entirely possible that a single resource may participate in multiple dependencies as illustrated in Figure 4. Resource flows
Dependencies
Consumer1
Producer
Flow Dependency
can be construed as
resource
Consumer2
Producer
While we could introduce a notation for representing coordination mechanisms, our experience to date is that this additional notation introduces a level of detail, and consequently complexity, that reduces the utility of the process map as a tool for reflection and innovation. Accordingly coordination mechanisms will be captured in the form of freeform comments about the dependency diagram. These informal descriptions will often draw upon the existing coordination literature (e.g. [20] [7] [12, 13]). For example, Zlotkin [20] identified a set of coordination mechanisms associated with resource sharing, where the choice of mechanism depends on key properties of the resource being shared. For example, a consumable, divisible resource such as petroleum can be shared by dividing it among multiple consumers. A non-divisible, non-consumable resource such as a piece of construction equipment (a hammer) can be shared by scheduling. A divisible, non-consumable resource such as bandwidth or a freeway can be allocated by partitioning into lanes or channels. Finally (arguably the most challenging case) a consumable, non-divisible resource such as an opera ticket can only be allocated to one of several competing parties, perhaps by means of a lottery or managerial fiat.
2.3. Representing distributed processes We introduce a multiplicity notation to represent the possibility of multiple instances of a single activity.
Consumer1
Sharing Dependency
Flow Dependency
2.2. Representing coordination mechanisms
Flow dependencies
Producers
Consumers
Consumer2
Figure 4. Single resource with multiple dependencies While one might choose to map a resource flow graph into a dependency diagram mechanically via the transformations given in Figure 3 above, one is also free to include only a subset of these dependencies. The rationale for this is that the dependency diagram is intended to convey the coordination issues which must be managed in a process. Those dependencies that are not problematic or that are outside the scope of the current analysis can be omitted from the diagram. This divergence between the resource flow graph and dependency diagram points to their complementary natures and hence the reason for employing both diagrams: the resource flow graph is easier to develop because it focuses on resource flows (a more tangible concept than dependency). The dependency diagram allows some of these flows to be abstracted away and focuses attention on the coordination issues raised by the flows.
Figure 5. Multiplicity notation When introducing multiple instances into a dependency diagram, it is important to keep track of possible changes in the dependency structure. For example, as illustrated in Figure 6, a flow dependency can become a sharing or fit dependency when one of the activities involved is replaced by multiple instances. Producer
Flow Dependency
Producers
Fit Dependency
Consumer
Figure 6. Flow becomes fit Note, however, that one might also have interpreted the change in the dependency in Figure 6 as multiple parallel flows, as in Figure 7. The choice of interpretation depends on which story you want to tell. Producer
Flow Dependency
Consumer
Producers
Flow dependencies
Consumer
Figure 7. Flow becomes parallel flows Choices such as this must be made and justified as part of the modeling process.
0-7695-1435-9/02 $17.00 (c) 2002 IEEE
Proceedings of the 35th Annual Hawaii International Conference on System Sciences (HICSS-35’02) 0-7695-1435-9/02 $17.00 © 2002 IEEE
Consumer
3
Proceedings of the 35th Hawaii International Conference on System Sciences - 2002
3. Methodology
Business strategy
The particular approach we will take is to develop a process model of the ASP delivery of service, working from a previously published description of an ASP [10]. We carry out an analysis of the coordination issues presented by the ASP business model and do so using Text-Based Process Analysis (TBPA), a method developed by Wyner [19] based on the process analysis and classification techniques developed for the process handbook project [13]. TBPA can be thought of as consisting of three phases: moving from a text to a dependency diagram, adding annotations about coordination mechanisms, and adding annotations and multiple instances to capture the distributed aspects of the process. The steps in the proposed process are as follows:
3.1. From text to dependency diagram 1.
Read through the text and search for point of view, activities, resources, and other components of the process. Note that in some cases the text itself may offer a more explicit account of a process, in which case one may already have lists of activities and even resource flows available. 2. Move these components into a process fragment diagram (e.g. Figure 8). This map consists mainly of activities and resources. (These are of primary interest since the next step is going to be a resource flow graph. However, at this point one may also capture other components such as agents or coordination mechanisms.) At this stage the activities and resources are for the most part not connected to each other and may be placed in an arbitrary order (often, as a matter of convenience, the placement reflects the order in which components were encountered in the text). Strategy
Identify processes for innovation
curr ent process infor mati on
selected process
Identify change levers
Process innovation
Develop process visions
External l ist of possi bl e im pact categori es
Business strategy
External l ist of possi bl e generic appli cations
Process requirements
Selected levers
see if I got this list right
Process
Understand existing processes
how does Davenpor t connec t thi s to the r est of the pr ocess?
Process understanding? Or constraints? See book.
Design and prototype new process
Process desi gn? prototy pe? im plem entati on?
Improve process
Input is process from desi gn or im prov e ac ti vity?
Inputs are from the other subactivi ti es?
Output is a process?
Does this incl ude im plem entati on? If yes, explain procname
clarify improve vs. innovate
Figure 8. Process fragment diagram for Davenport [6] 3. Once one obtains this process fragment diagram, one begins to look for resource flows which may connect different activities together. The many small fragments are thus replaced by a smaller number of larger fragments, as suggested in Figure 9.
Develop process visions
Process requirements
current process information
Identify processes for innovation
selected process External list of possible impact categories
selected process
Understand existing processes
Process understanding? Or constraints? See book.
Identify change levers
Selected levers
Benchmarking data External list of possible generic applications
selected process
Inputs from other activities...
Design and prototype new process
Process design? prototype? implementation?
Improve process
Process
Figure 9. Larger fragments 4. Search the process fragments for a point of view on the process, which may be implicit or explicit in the text. This often turns out to be a critical step in moving from the collection of process fragments in the previous step to the resource flow graph which follows. It seems that it is an explicit point of view which helps to select a subset of the process fragments and fit them together into a whole. Clearly there may be more than one process of interest and the same process may be viewed from several different viewpoints in the process fragment diagram. That is to be expected. One may in fact construct several process maps from a single text, or one may choose one particular point of view for one particular process and favor it over the others. What is important is that these choices and these issues are all captured and recorded for future review. Note that there is an inductive bottom-up process of connecting fragments of the process puzzle, and at the same time there is also a top-down process in which one constructs a point of view which serves as an organizing framework for the fragments. Different texts may lead to different tradeoffs between these two modes. There are texts where the process fragments easily fit together into a coherent process and where point of view is derived from this process map. In the other cases, point of view becomes the key to unraveling which elements of the process are to be connected. 5. From these efforts emerges a resource flow graph which stands as a coherent map of the process based on the activities and resources and flows derived in the preceding steps. The derivation of a resource flow graph is not a mechanical process. While it is systematic, it draws upon the same kind of skills as are employed by someone interpreting an ancient text or seeking for meaning in a work of literature. 6. The resource flow graph becomes the basis for a dependency diagram. As noted in section 2.1 above,
0-7695-1435-9/02 $17.00 (c) 2002 IEEE
Proceedings of the 35th Annual Hawaii International Conference on System Sciences (HICSS-35’02) 0-7695-1435-9/02 $17.00 © 2002 IEEE
Process requirements
selected process
4
Proceedings of the 35th Hawaii International Conference on System Sciences - 2002
this shift involves a certain degree of abstraction in which one hides from view any resource issues that are outside the scope or beneath the threshold of the current analysis. One also seeks to simplify the dependency diagram by a number of means: aggregating activities, hiding from view activities and resources which are part of coordination mechanisms (which are implicitly represented by the dependencies), and restricting the scope of the analysis, if necessary. The purpose of this simplification is to make the eventual diagram readily understandable (while maintaining its links to the context encountered during this simplification process). Arriving at the dependency diagram is a critical milestone in the analysis, since the steps which follow are essentially about annotating the diagram to represent additional issues. The reason that we retain the basic form of the dependency diagram is because our experience has shown it to be quite evocative and an exceptionally useful representation for understanding an individual process.
3.2. Include coordination mechanisms For purposes of innovation and classification, we have found that it generally suffices to annotate each dependency in the dependency diagram with an informal description of the associated coordination mechanism. The dependency diagram serves to structure and focus our examination of the text for accounts of the coordination mechanisms. For each dependency we now ask the text: how is that dependency coordinated? We are thus able to filter the text through the dependency diagram in order to pick out those portions of the story most relevant to the point of view we have chosen to bring to the text, a point of view now embodied in that dependency diagram.
3.3. Include distributed aspects of process To capture the distributed aspects of the design method, we use a combination of additional annotation and the multiplicity notation introduced in section 2 above. Annotation should capture the potential interaction among the coordination mechanisms, especially when they are distributed across multiple actors. The multiplicity notation should capture the possibility of multiple instances of an activity or dependency. As with coordination mechanisms above, the dependency diagram plays a critical role in focusing attention on the distributed issues, which may be found either explicitly in the text or implicitly in the diagram.
4. Analysis The first task in the TBPA method is to choose a text to analyze. For this study we have chosen a teaching note by Eisenmann and Pothen [10] which provides an MBA-level introduction to ASPs. This text seems appropriate because
it provides a generalized account at a high level; such a distilled account is both easier to analyze and more likely to capture common features across the variants of ASP found in actual practice.
4.1. Review of the text Following the TBPA methodology, we read through the text and identified key process components, including activities, resources, and enablers (physical mechanisms which realize activities). (Enablers are not used in the current analysis, which focuses on the dependency diagram, and abstracts away the issue of realization. Enablers are, however, included in the list of process components captured from the text, so that they are then available for subsequent analysis.) For example, consider this passage taken from Eisenmann and Pothen: ASPs allow companies to access application software on remote servers using the Internet. Through ASPs, application software is “rented”, i.e., customers make regular subscription payments to ASPs, rather than buying software and installing it on their own computers. ASPs’ customers are relieved of the burden of maintaining software – a large benefit for companies with limited or overtaxed Information Technology (IT) personnel. [10], [shading added] As you can see, we highlight terms which describe either actions taken or resources involved. The phrases are generally adopted with slight revisions. Here are several examples, drawn from the above paragraph: • Access application software. We identify an activity which we describe using the somewhat abbreviated phrase ACCESS APPLICATION. We also identify the corresponding resource (application), which is clearly an input to this activity. • Internet. The Internet plays here the role of an enabler: a mechanism which in this case makes software accessible to users. • Rented and payments and buying software. Renting software and buying software are viewed as two different ways to pay for an application and thus give rise to the activity COLLECT PAYMENT FOR APPLICATION and the resource payment. Clearly one also needs the activity PAY FOR APPLICATION. This was inadvertently omitted from the initial collection of process fragments. Such errors are to be expected as part of the TBPA methodology. In this case the omission was discovered while constructing a consistent resource flow graph. The resulting collection of process fragments may be seen in Figure 10.
0-7695-1435-9/02 $17.00 (c) 2002 IEEE
Proceedings of the 35th Annual Hawaii International Conference on System Sciences (HICSS-35’02) 0-7695-1435-9/02 $17.00 © 2002 IEEE
5
Proceedings of the 35th Hawaii International Conference on System Sciences - 2002
Process fragments - ASP Collect payment for application
Includes metering usage and calculating rent or fee.
will use application instead of the various synonyms such as "software"
Share data Access application
application
application data
Request application
Acquire application
Internet
payment "on demand"
Remote server
connectivity Includes both purchase and rental
Install application
Application suite
I am doing some generalizing as I collect fragments. computer
application features
IT Personnel
Maintain application
Portal
application resources
application expertise
Users
ISP WAN Integrate applications
Website Application capabilities
Manage application capabilities
Deliver application capabilities
Offsite data center
Systems integrator
ISV Support application
Figure 10. Process fragments as drawn from text
4.2. Resource flow graph Having extracted this set of potential process components from the original text, we now assemble them into a resource flow graph. In order to do so we must collect, connect, and integrate the individual fragments. For example, some related activities may be aggregated into a larger activity which contains them. Resources will be connected to activities as both inputs and outputs. Furthermore, we may exclude certain elements as outside the scope of our analysis. Here are some excerpts from this analysis, which give a sense of how one deals with such an assortment of activities and resources: 1. We can identify certain activities such as INSTALL APPLICATION and MAINTAIN APPLICATION as being parts of a larger development process (thus we see that DEVELOP APPLICATION must be added to our set of activities). 2. Consider the resource application data. If one asks what activity is associated with this resource as either input or output, one arrives at the activity USE APPLICATION, again, not in the original list of activities, but necessary for consistency with this resource. 3. We have thus added to our set of activities two critical activities: DEVELOP APPLICATION and USE APPLICATION. 4. We can identify certain activities such as ACQUIRE APPLICATION, which can now be seen as managing the coordination issues which arise given the critical flow of applications from DEVELOP APPLICATION to USE APPLICATION. To make the case that ACQUIRE APPLICATION is a coordination activity, one must identify the resource flow which it helps to
manage. In this case, the acquiring of an application can be thought of as the user side of the resource flow between DEVELOP APPLICATION and USE APPLICATION. 5. In some cases, this kind of analysis can lead us to include multiple instances of an activity or resource. For example, the resource application data is shown in the initial diagram as having multiple instances. In making sense of this multiplicity of data resources, one is then led to represent the activity USE APPLICATION as itself a set of multiple instances.. While this kind of analysis can be carried out relatively quickly, a detailed accounting of all of the changes employed would include much more than we have said so far. The ongoing goal here is to assemble a resource flow graph from process fragments by means of such simplifications. The result of this analysis can be seen in Figure 11. Note the significant simplification and coherence which result from this step in the methodology. The simplification results in part from the elimination of the enablers, which, while identified as process fragments, are abstracted away when constructing a resource flow graph. However, the simplification also benefits from the aggregation of related activities and the restriction in scope. The coherence of the diagram stems in part from the simplification itself, which eliminates much of the complexity found in the original collection of process fragments, but also results from connecting and arranging the elements in a symmetric and meaningful way. Develop application expertise
application expertise
Develop applications
development resources
Receive payment
Use applications
application data
payment information
payment
Pay for application
Figure 11. A resource flow graph for Provide application services
4.3. Dependency diagram The resource flow graph represents the resource flows which must then be mapped to the coordination problems
0-7695-1435-9/02 $17.00 (c) 2002 IEEE
Proceedings of the 35th Annual Hawaii International Conference on System Sciences (HICSS-35’02) 0-7695-1435-9/02 $17.00 © 2002 IEEE
applets
6
Proceedings of the 35th Hawaii International Conference on System Sciences - 2002
created by these flows. This mapping involves replacing resource flows with dependencies. This mapping from resource flow graph to dependency diagram follows the guidelines described in section 2.1 above and results in the dependency diagram shown in Figure 12. Develop application expertise
Fit: application expertise Flow: application expertise Sharing: application expertise
Flow: applets
each of which both creates and consumes expertise. For example, in using an application one requires training but also gains experience. This experience is not only a useful input to USE APPLICATIONS, but is also a critical form of feedback for DEVELOP APPLICATIONS. In addition, one must account for the development of application expertise as a separate activity. That is, in addition to expertise developed as a byproduct of application development and application use, one can actively seek to create expertise as a primary goal, as in the development of training programs. Develop application expertise
Flow: application data
Fit: applets Develop applications
APPLICATIONS,
Sharing: application data
Use applications
Sharing: application data
Sharing: applets
Fit: application expertise Flow: application expertise
Flow: usage data
Sharing: development resources
Flow: cost data
Sharing: application expertise EXPERTISE
MANAGEMENT
Flow: application data
Fit: applets Develop applications
Flow: applets
Use applications
APPLICATION
Sharing: application data Sharing: application data
Sharing: applets INTEGRATION
DATA INTEGRATION
Pay for application
Figure 12. Dependency diagram for Provide application services
4.4. Dependency analysis
Receive payment
Having identified key dependencies, we now need to understand their implications for the ASP business process. We begin by observing that the 13 dependencies in Figure 12 can be grouped into four categories as shown in Figure 13. 1. Payment coordination. These dependencies are concerned with calculating payments due for applications delivered and transmitting payments from the user to the application provider. 2. Application integration. These dependencies concern the flow of application components, here referred to as applets, from DEVELOP APPLICATIONS to USE APPLICATIONS. Such applets must not only be delivered, but also integrated into a functioning application as well. This is done as part of development in the traditional software engineering model, but in the case of interoperating suites of applications, which employee technology such as ActiveX, and Publish & Subscribe, one may view some of this integration as occurring at the moment of use. 3. Data integration. The flow of data among multiple application instances poses a set of coordination problems, including how data are moved, shared, and fit together. 4. Expertise management. These dependencies are related to DEVELOP APPLICATIONS and USE
Flow: payment
Pay for application
PAYMENT COORDINATION
Figure 13. Dependencies grouped into categories.
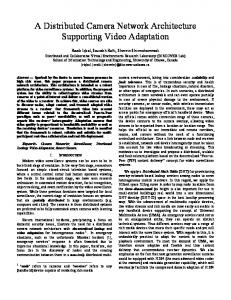
4.5. Dependency insights To gain insights into this dependency diagram we will use one particular kind of analysis well-suited to coordination issues: analyzing the assignment of coordination mechanisms to actors. This type of analysis is based on the intuition that one important coordination mechanism is the assignment of multiple interdependent tasks to a single actor, who will thus be in a position to manage the dependencies between these tasks. We will demonstrate that this approach can identify dependencies which are not clearly in the control of a single actor, and which therefore may require more intricate coordination mechanisms. We carry out this analysis by identifying the entity or entities responsible for carrying out each activity and managing each dependency. In the case at hand we identify three key organizational entities as illustrated in Figure 14: 1. The independent software vendor (ISV) is responsible for development tasks and also for receiving and allocating payments made in exchange for access to the applications developed.
0-7695-1435-9/02 $17.00 (c) 2002 IEEE
Proceedings of the 35th Annual Hawaii International Conference on System Sciences (HICSS-35’02) 0-7695-1435-9/02 $17.00 © 2002 IEEE
Flow: cost data
Flow: usage data
Flow: payment
Sharing: development resources
Receive payment
7
Proceedings of the 35th Hawaii International Conference on System Sciences - 2002
2.
The end-user is responsible for using the applications to perform business activities, for generating usage data based on how and when applications are used, and for initiating payments for the applications. The span of responsibility for the application service provider can then be understood as managing the dependencies which arise from the flow of application software from the developer to the user. This view of the ASP 's role is itself a useful consequence of this coordination analysis, highlighting as it does the coordination responsibility of the ASP. Develop application expertise
5. From dependency requirements to knowledge architecture: closing the gap
Fit: application expertise Flow: application expertise Sharing: application expertise
Flow: application data
Fit: applets Develop applications
Flow: applets
Use applications
Sharing: development resources
Flow: cost data
Flow: usage data
Receive payment
Flow: payment
Pay for application
ASP
Sharing: application data Sharing: application data
Sharing: applets
ISV
expertise from DEVELOP APPLICATION EXPERTISE to both DEVELOP APPLICATION and USE APPLICATION. • Fit dependency. The integration of multiple sources of application expertise for use either by DEVELOP APPLICATION or USE APPLICATION. • Sharing dependency. Use of a single source of application expertise in multiple situations (this includes, for example, managing bottlenecks created by limited resources for providing a particular kind of expertise). The next step is to explore the implications of this for the design of the system and its accompanying architecture to deal with the expertise management issue. We consider these issues in the next section.
END USER
Figure 14. Assignment of roles The importance of application expertise as a coordination issue for the delivery of application services can be seen in Figure 14: The flow of application expertise is not currently the sole responsibility of any of the organizational actors involved. This suggests that these dependencies may either be distributed among multiple actors or that some of these dependencies may currently be overlooked altogether. We explore these particular dependencies in further detail. We can see from Figure 14 that there are three distinct dependencies involving application expertise, and that these involve three distinct activities, two of which involve multiple instances (represented by the stacked activity boxes). This leads to a complex set of interactions, again suggesting that expertise sharing ought to be of particular interest as a source of coordination issues (and hence potential value to be added by the ASP). We consider each type of dependency in turn: • Flow dependency. There are three distinct sets of flows to be managed here: the flow of expertise across multiple instances of an activity (either DEVELOP APPLICATION or USE APPLICATION), the flow of expertise between DEVELOP APPLICATION and USE APPLICATION (in both directions), and the flow of
It follows from our analysis in the previous section that all ASPs are inevitably in the business of managing the critical dependency of expertise sharing across the value chain. The interesting challenge is in identifying the alternatives available for doing this. Consider the following three approaches: the shared experience approach, the modular approach, and the strategic approach [3]. Researchers subscribing to the shared experience approach believe that knowledge is socially constructed and embedded in social networks and it is the interaction between individuals and across organizations that creates knowledge. Organizations that follow this approach have knowledge management systems that support activities such as communities of practice, expert networks, affinity forums, virtual conferences, one-to-one collaboration, messaging, distance learning, conferencing / white boarding, and expertise/skill location [8, 14, 15, 17]. Proponents of the modular approach focus on reuse, which in turn is the process of converting organizational and individual knowledge into a standard form that makes it easily accessible by all in need of it, thus leveraging internal expertise on an enterprise-wide basis. This approach supports activities such as modular systems design [1, 16], search engine installation, content management, data mining, metadata management, and semantic analysis. Under the resource-based approach, firms assume that certain capabilities may not be imitated or traded and thus have the potential to yield a sustainable competitive advantage that leads to persistent above average results. In order to identify and cultivate such capabilities, firms spend a large amount of time on the strategic planning process. Once strategic capabilities have been identified, knowledge management systems have been used to track the progress of these capabilities and to capture the rationale behind their selection and evolution [2, 4, 18].
0-7695-1435-9/02 $17.00 (c) 2002 IEEE
Proceedings of the 35th Annual Hawaii International Conference on System Sciences (HICSS-35’02) 0-7695-1435-9/02 $17.00 © 2002 IEEE
8
Proceedings of the 35th Hawaii International Conference on System Sciences - 2002
Each of these approaches can be thought of as a bundle of coordination mechanisms for managing the three key expertise sharing dependencies. The following table summarizes the three sets of coordination mechanisms: Modular Shared Resourceexperience based Flow Interface Conversation Center for standards* excellence Fit Meta-data Consensus* Means-end analysis Sharing Repository Community Resource allocation* Table 1: Coordination mechanisms for knowledge sharing The modular approach manages the flow of expertise by developing standards the information producers and consumers can employ to facilitate knowledge exchange. The fit among possibly contradictory knowledge inputs is managed by meta-data which identifies and resolves such inconsistencies. Knowledge is shared across multiple users by placing it in a repository that can be accessed by all stakeholders. The shared experience approach manages the flow of expertise by means of conversations among stakeholders, who manage the fit of multiple viewpoints by consensusbuilding. The issue of widely sharing expertise is addressed by building communities which facilitate the distribution of knowledge. The resource-based approach manages the flow of expertise by formalized consulting-like engagements which may take the form of an internal (or external) center for excellence (consultancy). Fit issues are resolved by means-end analysis which arranges information inputs to be consistent with goals. Finally, the sharing dependency is managed by treating knowledge as one more resource to be allocated among the various stakeholders. Each of these three strategies is particularly strong in managing one of the three dependencies. These strengths are identified in Table 1 by an asterisk (*) in the appropriate cell. The modular approach excels in managing flows, by offering efficiencies in the form of standard interfaces. In contrast, the shared experience approach takes full advantage of natural propensities for creating shared understanding in order to build consensus and thereby manage the fit dependency. Finally, the resource-based approach is, almost by definition, especially well-suited to resource allocation and hence to managing knowledge sharing (by treating knowledge as an asset). As we just observed, each approach to knowledge sharing has its unique strengths. However, no approach is strong along all the dependencies. This provides an opportunity for an ASP to provide an architecture to support these additional coordination needs for managing expertise across all three dependencies.
An architecture is a systems design that specifies the way the overall functionalities of the design are to be decomposed into individual functional components and the way in which the individual functional components are to interact to provide the overall functionalities of the system design. The decomposition of the enterprise into manageable parts, the definition of what those parts are, and the orchestration of the interplay among those parts are called the Enterprise Architecture. The orchestration of the interplay is governed by a set of design rules/principles for the organization’s knowledge architecture. In thinking about such a knowledge management architecture, Balasbramanian et al [3] have proposed a framework consisting of the following three layers: the service layer, the knowledge layer, and the user layer. The Service Layer: The service layer consists of the data, models, documents, and other artifacts that capture the knowledge in the system. These (the data, models, documents, and artifacts) form the very bottom/first component of the service layer and might reside in a data server that is linked to a web server that connects these to the corporate Intranet. This layer helps the user selectively identify the knowledge, or specifically, the artifacts that are associated with some specific knowledge of interest to the user. The Knowledge Layer: Services provided by this layer processes the data provided by the service layer and presents the knowledge to users or other higher level applications that request knowledge from this layer. User Layer: This layer includes the browser capability required to distribute knowledge across the Internet or corporate Intranet. In the case of the former, access requires penetration of a firewall that secures the organizational knowledge from the rest of the world. Intelligent agents are useful for supporting intelligent search and retrieval of knowledge from the factory that acts as a knowledge repository. In the following table, we relate these layers of the architecture back to the three approaches to knowledge sharing by identifying the critical layers for each strategy and the value that they offer.
0-7695-1435-9/02 $17.00 (c) 2002 IEEE
Proceedings of the 35th Annual Hawaii International Conference on System Sciences (HICSS-35’02) 0-7695-1435-9/02 $17.00 © 2002 IEEE
9
Proceedings of the 35th Hawaii International Conference on System Sciences - 2002
Modular
Shared experience
Resourcebased
Conversation
Fit
Interface standards* Meta-data
Sharing
Repository
Community
Center for excellence Means-end analysis Resource allocation*
Architecture value proposition Architecture CSF
Providing meta-data
Connecting people
Knowledge layer
User layer
Flow
Consensus*
Alignment of knowledge and human resources
User + knowledge layer Table 2: Coordination architecture for knowledge sharing
6. Conclusions and future work In this paper, we identify coordination activities as a critical success factor for a successful ASP relationship between a provider and a consumer. In particular, we identify four key dependencies: payment coordination, application integration, data integration, and expertise management. In addition to this, we assign task responsibilities to key organizational entities such as, independent software vendor, end-user and application service provider. Finally, for the expertise management dependency, we summarize existing approaches and the associated coordination requirements which we link to an architecture. The linkages we have thus identified between the coordination problems inherent in the ASP model and knowledge management architecture allow us to clearly address the question: what value can an ASP offer, not only by providing application services, but by creating a knowledge management architecture to support the effective use of such services? As a next step, we plan to survey application service providers to validate the existing model and to identify variations. Also included in our agenda is an exploration of the impact of enterprise architecture on firm performance.
7. Reference
[5] J. Correia, "Sanity Check on the ASP Opportunity," Gartner, Inc., Stamford, CT, Research Brief OMAS-WW-DP0101, March 5 2001. [6] T. H. Davenport, Process Innovation: Reengineering Work through Information Technology, 1st ed. Boston: Harvard Business School Press, 1993. [7] C. Dellarocas, "A Coordination Perspective on Software Architecture: Towards a Design Handbook for Integrating Software Components,".: Massachusetts Institute of Technology, 1996. [8] L. P. Don Cohen, In Good Company : How Social Capital Makes Organizations Work. Cambridge: Harvard Business School Press, 2001. [9] A. Efstathiou, "An E-Sourcing Taxonomy," The Yankee Group, Boston, E-Sourcing Services Report Volume 10, Number 3, 2000. 2000. [10] T. Eisenmann and S. Pothen, "Application Service Providers," Harvard Business School Publishing, Cambridge, Note 801310, 2001. [11] B. Jaruzelski, F. Ribeiro, and R. Lake, "ASP101: Understanding the Application Service Provider Model," Booz.Allen & Hamilton, 2000. [12] T. W. Malone and K. Crowston, "The Interdisciplinary Study of Coordination," ACM Computing Surveys, vol. 26, pp. 87-119, 1994. [13] T. W. Malone, K. Crowston, J. Lee, B. Pentland, C. Dellarocas, G. Wyner, J. Quimby, C. S. Osborn, A. Bernstein, G. Herman, M. Klein, and E. O'Donnell, "Tools for inventing organizations: Toward a handbook of organizational processes," Management Science, vol. 45, pp. 425-443, 1999. [14] N. Nohria and R. G. Eccles, "Networks and Organizations: Structure, Form and Action,". Boston: Harvard Business School Press, 1992, pp. 544. [15] I. Nonaka and H. Takeuchi, The Knowledge-Creating Company. New York: Oxford University Press, Inc., 1995. [16] H. A. Simon, The Sciences of the Artificial, Third ed. Cambridge: The MIT press, 1996. [17] E. Wenger, Communities of Practice: Learning, Meaning, and Identity. Cambridge: Cambridge University Press, 1999. [18] B. Wernerfelt, "A resource based view of the firm," Strategic Management Journal, vol. 5, pp. 171-180, 1984. [19] G. M. Wyner, "Let a Thousand Gardeners Prune: Cultivating the Distributed Design of Complex Organizations," in Sloan School of Management. Cambridge, Massachusetts: Massachusetts Institute of Technology, 2000. [20] G. Zlotkin, "Managing Shared Resource," MIT Center for Coordination Science, Unpublished working paper February 13 1995.
[1] C. Alexander, Notes on the Synthesis of Form. Cambridge, Massachusetts: Harvard University Press, 1964. [2] P. Balasubramanian, K. Nochur, J. C. Hendersen, and M. M. Kwan, "Managing process knowledge for decision support," Decision Support Systems, vol. 27, pp. 145-162, 1999. [3] P. Balasubramanian, G. Shankaranarayanan, and M. Schilling, "Designing the Enterprise Architecture for Knowledge Management," Boston University, Boston 2000-07, 2000. [4] J. B. Barney, "Firm resources and sustained competitive advantage," Journal of Management, vol. 17, pp. 99120, 1991.
0-7695-1435-9/02 $17.00 (c) 2002 IEEE
Proceedings of the 35th Annual Hawaii International Conference on System Sciences (HICSS-35’02) 0-7695-1435-9/02 $17.00 © 2002 IEEE
10