PNL Document Number: PNL-SA-24175
Three Neural Network Based Sensor Systems for Environmental Monitoring Paul E. Keller, Richard T. Kouzes, Lars J. Kangas Pacific Northwest Laboratory P.O. Box 999, K1-87 Richland, WA 99352
[email protected],
[email protected],
[email protected]
1. INTRODUCTION TO THE PROBLEM Enormous amounts of hazardous waste were generated by more than 40 years of plutonium production at the Hanford Site. There are an estimated 1700 waste sites distributed around the 560 square miles of southeastern Washington that comprise the Hanford Site.1 This waste includes nuclear waste (e.g., fission products), toxic chemical waste (e.g., carbon tetrachloride, ferrocyanide, nitrates, etc.), and mixed waste (combined radioactive and chemical waste). The current mission at the Hanford Site is environmental restoration and waste management.
As part of this mission, the Pacific Northwest Laboratory is exploring the technologies required to perform environmental restoration and waste management in a cost effective manner. This effort includes the development of portable, inexpensive systems capable of real-time identification of contaminants in the field. The objective of our research is to demonstrate the potential information processing capabilities of the neural network paradigm in sensor analysis. The initial portion of this effort involves the development of three prototype systems, where each prototype combines a sensor array with a neural network. These prototypes are discussed in this paper. Artificial neural networks (ANNs) are used in a wide variety of data processing applications where real-time data analysis and information extraction are required. One advantage of the neural network approach is that most of the intense computation takes place during the training process. Once the ANN is trained for a particular task, operation is relatively fast and unknown samples can be rapidly identified in the field. 2. SENSOR DATA ANALYSIS Environment
ABSTRACT Compact, portable systems capable of quickly identifying contaminants in the field are of great importance when monitoring the environment. One of the missions of the Pacific Northwest Laboratory is to examine and develop new technologies for environmental restoration and waste management at the Hanford Site (a former plutonium production facility). In this paper, three prototype sensing systems are discussed. These prototypes are composed of sensing elements, data acquisition system, computer, and neural network implemented in software, and are capable of automatically identifying contaminants. The first system employs an array of tin-oxide gas sensors and is used to identify chemical vapors. The second system employs an array of optical sensors and is used to identify the composition of chemical dyes in liquids. The third system contains a portable gamma-ray spectrometer and is used to identify radioactive isotopes. In these systems, the neural network is used to identify the composition of the sensed contaminant. With a neural network, the intense computation takes place during the training process. Once the network is trained, operation consists of propagating the data through the network. Since the computation involved during operation consists of vector-matrix multiplication and application of look-up tables (activation function), unknown samples can be rapidly identified in the field.
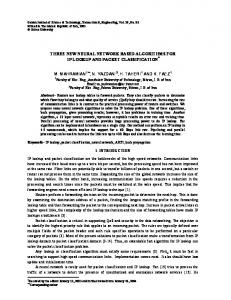
Feature Values
Labeled Patterns
(measurements: electrical response, wavelength, etc.)
(e.g., chemical composition, isotope identification, etc.)
Sensing System Neural Network
Figure 1. Sensor system combined with an ANN. There are many real-time (rapid response) and remote sensing applications that require an inexpensive, compact, and automated system for identifying an object (e.g., target, chemical, isotope). Such a system can be built by combining a sensor array with an ANN. A generic system is shown in Figure 1. The quantity and complexity of the data collected by sensor arrays can make conventional analysis of data difficult. ANNs, which have been used to analyze complex data and for pattern
This research was supported by the Northwest College and University Association for Science (Washington State University) under Grant DE-FG06-89ER-75522 with the U.S. Department of Energy. Pacific Northwest Laboratory is operated for the U.S. Department of Energy by Battelle Memorial Institute under contract DE-AC06-76RLO 1830. This paper was presented at the IEEE Electro/94 International Conference in Boston, MA, USA during 10-12 May 1994. 378
PNL Document Number: PNL-SA-24175
recognition, could be a better choice for sensor data analysis. A common approach in sensor analysis is to build an array of sensors, where each sensor in the array is designed to respond to a specific analyte. With this approach, the number of sensors must be at least as great as the number of analytes being monitored. When an ANN is combined with a sensor array, the number of detectable analytes is generally greater than the number of sensors.2 A sensor array is composed of several sensing elements, where each element measures a different property of the sensed sample. Each object (e.g., target, chemical, isotope) presented to the sensor array produces a signature or pattern characteristic of the object. By presenting many different objects to the sensor array, a database of signatures can be built up. From this database, training sets and test sets are generated. These sets are collections of labeled patterns (signatures) representative of the desired identification mapping. The training sets are used to configure the ANNs. The goal of this training is to learn an association between the sensor array patterns and the labels representing the data. When a chemical sensor array is combined with an automated data analysis system (such as an ANN) to identify vapors, it is often referred to as an artificial nose. Several researchers have developed artificial noses that incorporate ANNs for use in applications including monitoring food and beverage odors,3 automated flavor control,4 analyzing fuel mixtures,5 and quantifying individual components in gas mixtures.6 Several ANN configurations have been used in artificial noses including backpropagation-trained, feed-forward networks; Kohonen’s self-organizing networks; Hamming networks; Boltzmann machines; and Hopfield networks. 3. CHEMICAL VAPOR SENSOR SYSTEM Chemical Vapor
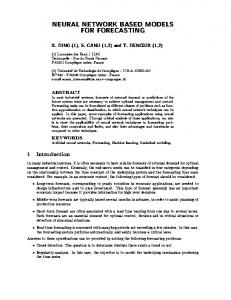
Chemical Sensor Array 9 3 2 8 12 4 10 1 11 5 6 7
Identified Chemical Neural Network
Figure 2. Chemical vapor sensing system. The first prototype system, shown in Figure 2, identifies and quantifies chemicals vapors. It employs an array of nine tin-oxide gas sensors, a humidity sensor, and two temperature sensors to examine the environment. Although each sensor is designed for a specific chemical, each responds to a wide variety of chemical vapors. Collectively, these sensors respond with unique signatures (patterns) to different chemicals. During the training process, various chemicals with known mix-
tures are presented to the system. In the initial studies, the backpropagation algorithm was used to train the ANN to provide the correct analysis of the presented chemicals. The nine tin-oxide sensors are commercially available Taguchi-type gas sensors obtained from Figaro Co. Ltd. (Sensor 1, TGS 109; Sensors 2 and 3, TGS 822; Sensor 4, TGS 813; Sensor 5, TGS 821; Sensor 6, TGS 824; Sensor 7, TGS 825; Sensor 8, TGS 842; and Sensor 9, TGS 880). Exposure of a tin-oxide sensor to a vapor produces a large change in its electrical resistance.7 The humidity sensor (Sensor 10: NH-02) and the temperature sensors (Sensors 11 and 12: 5KD-5) are used to monitor the conditions of the experiment and are also fed into the ANN. The prototyped ANN was constructed as a multilayer feedforward network and was trained with the backpropagation of error algorithm by using a training set from the sensor database.8 The parameters used to train this ANN are listed in Table 1. This prototype was initially trained to identify eight household chemicals: acetone, correction fluid, contact cement, glass cleaner, isoproponal alcohol, lighter fluid, rubber cement (Naphtha and Hexane), and vinegar. Another category, “none”, was used denote the absence of all chemicals except those normally found in the air. This resulted in nine output categories from the ANN. Figure 3 illustrates the network layout. Table 1. ANN Training Parameters Type: Backpropagation in batch mode Architecture: 12-6-9 feedforward Activation: Logistic Learning Rate: 0.01 Momentum: 0.9 No. of Epochs: 15000 Σƒ
Sensor Inputs TGS 109 TGS 822 TGS 822 TGS 813 TGS 821 TGS 824 TGS 825 TGS 842 TGS 880 NH-02 5KD-5 5KD-5
Σƒ
Σƒ
Σƒ
Σƒ
Σƒ
Σƒ
Σƒ
Σƒ
Σƒ
Σƒ
Σƒ
Σƒ Σƒ Σƒ
None Acetone Correction Fluid Contact Cement Glass Cleaner Isopropanol Lighter Fluid Rubber Cement Vinegar
Fig. 3. ANN used to identify household chemicals. During operation, the sensor array “smells” a vapor, the sensor signals are digitized and fed into a computer, and the ANN (implemented in software) then identifies the chemical. This identifica-
This paper was presented at the IEEE Electro/94 International Conference in Boston, MA, USA during 10-12 May 1994. 379
PNL Document Number: PNL-SA-24175
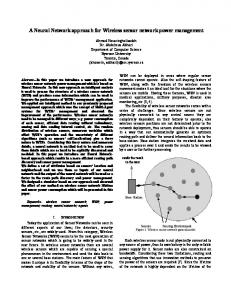
tion time is limited only by the response of the chemical sensors, but the complete process can be completed within a few seconds. Figure 4 illustrates both the sensor response and the ANN classification of the system for a variety of test chemicals presented to the prototype.
Sensor Values
ANN Output None
1 2 3 4 5 6 7 8 9 101112
1 2 34 5 6 7 8 9
Acetone
4. OPTICAL SENSOR SYSTEM Lamp
Optical Chemical Dye Sensor Array
Identified Chemical
3 2 4 7 1 5 6
Neural Network
Figure 5. Optical sensor array system. The second prototype system, shown in Figure 5, employs an array of optical sensors and identifies the composition of chemical dyes in solution. Light is passed through the dye solution and into an array of seven optical sensors. Each optical sensor consists of a silicon detector covered by a narrow bandpass interference filter and is sensitive to a specific wavelength of light in the visible and nearinfrared spectrum. The output of each sensor provides an input to the ANN. By examining the absorption of the liquid at different wavelengths, the ANN is able to identify and quantify the dyes. Initial tests with this system have just begun. 5. RADIATION SENSOR SYSTEM
1 2 3 4 5 6 7 8 9 101112
1 2 34 5 6 7 8 9
Unknown Object
Energy Spectra Gamma-Ray Spectrometer
Glass Cleaner
Identified Isotopes Neural Network
Detector (NaI, Ge)
1 2 3 4 5 6 7 8 9 101112
1 2 34 5 6 7 8 9
Rubber Cement
1 2 3 4 5 6 7 8 9 101112
1 2 34 5 6 7 8 9
Vinegar
1 2 3 4 5 6 7 8 9 101112
1 2 34 5 6 7 8 9
Figure. 4. Sample responses and ANN classifications. The numbers correspond to sensors and ANN outputs that are shown in Figure 3.
Figure 6. Gamma-ray spectrometer with ANN. The third prototype system, shown in Figure 6, contains a portable gamma-ray spectrometer and is used to identify and quantify radioactive isotopes. The gamma-ray spectrometer consists of a sodium iodide (NaI) crystal, photomultiplier, pulse height analysis circuit, and multichannel analyzer. There are 512 channels of data produced by the spectrometer. All 512 channels are fed into the ANN. The ANN is configured as an optimal linear associative memory9 where each neuron implements a linear activation function. There is a single processing layer in the ANN where the number of output neurons is equal to the number of isotopes being identified (eight in this case). This ANN is shown in Figure 7 and described in Table 2. One feature of this approach to gamma-ray spectral analysis is that the whole spectrum is used in the identification process instead of individual peaks in the spectrum. For this reason, it is potentially more useful for processing data from lower resolution gamma-ray spectrometers (like those employing NaI detectors).10 Table 2. ANN Training Parameters Type: Optimal Linear Associative Memory Architecture: 512-8 feedforward network Activation: Linear
This paper was presented at the IEEE Electro/94 International Conference in Boston, MA, USA during 10-12 May 1994. 380
PNL Document Number: PNL-SA-24175
Channel Channel Channel Channel Channel
Input Layer (1/channel) 1 2 3 4 5
Output Layer (1/isotope) Σƒ
Na 22
5000
Σƒ
Mn 54
4000
Σƒ
Co 57
3000
Co 60 Cs137 Eu152-154 Ra 226 Th 232
2000
Σƒ
Channel 507 Channel 508 Channel 509 Channel 510 Channel 511 Channel 512
Σƒ Σƒ Σƒ Σƒ
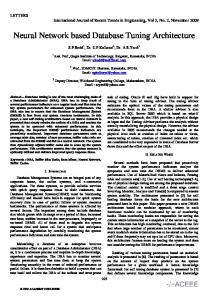
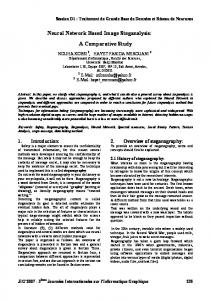
Fig. 7. ANN used to identify radioactive isotopes. This system was trained with the spectra of eight radioactive isotopes: sodium (Na 2 2 ) , manganese (Mn54), cobalt (Co57 ), cobalt (Co 60), cesium (Cs137 ), europium (Eu152-154 ), radium (Ra226), and thorium (Th232). The spectra of these isotopes are illustrated in Figure 8. Operation consists of presenting an unknown sample to the system, generating a gamma-ray spectrum, and passing the spectrum to the ANN which produces a classification of the unknown sample. The values on the output neurons are proportional to the quantities of each radioactive isotope found in the sample. Figure 9 illustrates an example of the classification and quantification of a sample composed of equal amounts of Cobalt60 and Cesium137. The resulting classification by the ANN correctly identifies the composition of the sample as being composed of equal quantities of both isotopes.
Na22
Mn54
Sensor Values ANN Output 50% Cobalt60 and 50% Cesium137
Co57
1000 0
1
256
512 1 2 3 4 5 6 7 8
Figure 9. Sample spectrum and ANN classification. 6. DISCUSSION Three prototype systems that employ neural networks for sensor analysis were presented. The first prototype combined an array of tin-oxide gas sensors with a neural network and was used to identify common household chemicals. The second prototype combined an array of optical sensors and was used to identify chemical dyes in solution. The third prototype combined a gamma-ray spectrometer with a neural network and was used to identify radioactive isotopes. Initial results demonstrated the pattern recognition capabilities of the neural network paradigm in sensor analysis. These prototypes also demonstrated several advantages of this approach over conventional analytical techniques including compactness, portability, real-time analysis, and automation. Further work will involve comparing neural network sensor analysis to more conventional techniques, exploring other neural network paradigms, and evolving the preliminary prototypes to field systems. 7. REFERENCES 1. Barbara Goss Levi, “Hanford seeks short- and long-term solutions to its legacy of waste,” Physics Today, vol. 45, no. 3, pp. 17-21, March 1992.
Co60
Cs137
Eu152-154 2. B.S. Hoffheins, Using Sensor Arrays and Pattern Recognition to Identify Organic Compounds, MS-Thesis, The University of Tennessee, Knoxville, TN, 1989.
Ra226
Th232
Figure 8. Gamma-ray spectra of each isotope in the training set. There are 512 channels per spectrum.
3. J.W. Gardner, E.L. Hines and M. Wilkinson., “Application of Artificial Neural Networks to an Electronic Olfactory System,” Measurement Science and Technology, vol. 1, no. 5, pp. 446-451, May 1990. 4. T. Moriizumi, T. Nakamoto and Y. Sakuraba, “Pattern Recognition in Electronic Noses by Artificial Neural Network Models,” in Sensors and Sensory Systems for an Electronic Nose, J.W. Gardner and P.N. Bartlett, Eds. Amsterdam, The Netherlands, Kluweer Academic Publishers, 1992, pp. 217-236.
This paper was presented at the IEEE Electro/94 International Conference in Boston, MA, USA during 10-12 May 1994. 381
PNL Document Number: PNL-SA-24175
5. R.J. Lauf and B.S. Hoffheins, “Analysis of Liquid Fuels Using a Gas Sensor Array,” Fuel, vol. 70, pp. 935-940, August 1991. 6. H. Sundgren, F. Winquist, I. Lukkari and I. Lundström, “Artificial Neural Networks and Gas Sensor Arrays: Quantification of Individual Components in a Gas Mixture,” Measurement Science and Technology, vol. 2, no. 5, pp. 464-69, May 1991. 7. Product literature from Figaro USA, Inc., P.O. Box 357, Wilmette, IL 60091, USA. 8. D.E. Rumelhart, G.E. Hinton and R.J. Williams,“Learning internal representations by error propagation,” in Parallel Distributed Processing: Explorations in the Microstructures of Cognition. Vol. 1: Foundations, D.E. Rumelhart and J.L. McClelland, Eds. Cambridge, MA, MIT Press, 1986, pp. 318-362. 9. Teuvo Kohonen, in Self Organization and Associative Memoriy, third ed., New York, NY, Springer-Verlag, 1989. 10. P. Olmos, J.C. Diaz, J.M. Perez, G. GarciaBelmonte, P. Gomez, V. Rodellar, “Application of neural network techniques in gamma spectroscopy,” Nuclear Instruments and Methods in Physics Research, vol. A312, pp. 167-173, 1992.
This paper was presented at the IEEE Electro/94 International Conference in Boston, MA, USA during 10-12 May 1994. 382