The zonal map has many applications: it can be used for the computation and ren- .... A concentric ring of distance 7 is defined as the set of cells with a Manhattan distance ... 8( Iog ( D , in which ( is the average number of neighbors per atom.
Time Critical Computing and Rendering of Molecular Surfaces Using a Zonal Map Henk Huitema, Robert van Liere Center for Mathematics and Computer Science CWI, Kruislaan 413, 1090 GB Amsterdam, the Netherlands. e-mail: huitema,robertl @cwi.nl �
Abstract We describe the zonal map, a data structure used for the visualization of large, time dependent molecular configurations in virtual environments. The governing idea of the zonal map is to use the user’s line of sight to define a region of interest onto which time critical algorithms can be applied. Two examples of time critical algorithms are given: for computing and rendering of solvent-accessible surfaces of protein molecules. We show that substantial performance gains can be obtained by using the zonal map.
1 Introduction Virtual environments have shown great promise as a research tool for the exploration of molecular data. The additional depth information and intuitive interaction inherent to virtual environments can aid in obtaining insight to the 3-D structure and properties of a molecular configuration. Various implementations of virtual environments for molecular modeling and molecular dynamics are underway. There are a vast number of visualization methods to represent molecules; e.g. stick, ball-and-stick, CPK space-filling methods, surfaces, etc. Each method highlights certain molecular properties. A problem with many of these methods is that of performance. Rendering large molecules – for example combining a CPK and a surface representation of a 5000 atom molecule – at a performance of minimal 10 frames a second is currently not possible. Recent developments have addressed the problem of performance by developing techniques that enhance the rendering speed at the cost of a less detailed representation of the molecule. Higher detail representations are used when a part of the molecule is perceptually more important and lower detail representations are used when the part of the molecule is perceptually less significant. However, when studying molecular data in virtual environments, the goal is to visualize highly detailed molecule representations at close range. It is likely that the molecule being visualized will not move adequately far away from the viewer to allow the rendering algorithm to switch to a lower level of detail. The approach taken in this paper is not to compromise the level of detail of the representation. Instead, time critical algorithms are used to compute and render parts of the molecule representation at a high level of detail at predictable frame rates. This is realized by the zonal map: a data structure containing geometrical information of the molecule. A view dependent region of interest is defined in which the representation is rendered at a high level of detail. The size of the region of interest depends on the time critical algorithms that operate on the atoms in the region. The motivation for a view dependent region of interest is that this is the area of the molecule where the user is focusing her attention on. Since the region of interest is close the user, we render the molecule representation with a high level of detail. Molecule representations outside the region of interest need not be computed and rendered at all. 1
The zonal map has many applications: it can be used for the computation and rendering of many molecular representations, data culling, visibility, and adaptive molecular algorithms. This paper will focus only on using the zonal map for time critical computing and rendering of the solvent accessible surfaces of the molecule. The rest of the paper is organized as follows: First, we briefly review related work on molecular visualization and time critical rendering. In section 3 we discuss the zonal map and give two examples of time critical algorithms. In section 4 we show how the time critical algorithms are managed, in which we take advantage of pipelining in a multi-threaded environment. Finally, in section 5 we show some timing results for various molecules.
2 Related work Numerous academic and commercial efforts have used virtual environments for the study of molecules. Many have placed emphasis on interactive protein modeling and molecular dynamics, [1, 2, 3], while others have concentrated on the interactive display of molecule representation, [4, 5]. Haase et. al., for example, developed techniques for rapid interaction, fast rendering of large molecules (including techniques as level of detail, fast sphere rendering, multi-pipe rendering, sorting for transparent surfaces), and on perceptual issues (such as shadows for additional size and position cues). Our approach for computing and rendering molecular surfaces differs from Haase’s techniques in that we require that our techniques are applicable to large, time dependent, molecular configurations. Haase’s techniques for surface rendering are less suitable when the molecular structure changes over time, since they rely on a number of pre-processing steps on the molecule. Time critical computing for virtual environments has been an extensive topic of study. Funkhouser and S´equin presented an adaptive display algorithm for interactive frame rates during visualization of complex virtual environments, [6]. Their algorithm uses hierarchical model representations in which objects are described at multiple levels of detail. The predictive algorithm adjust image quality adaptively to maintain a uniform target frame rate. This is achieved by maximizing a benefit/cost ratio for rendering graphical objects in a scene. Transitions from one level of detail to the next are based on image-space metrics; e.g. the ratio of the image-space area of the representation to the distance of the representation from the viewer. Tests indicate that the algorithm performs at near uniform frame rates with large walk through models. The zonal map technique differs from the techniques based on hierarchical model representations in that we require the highest level of detail at all times. We use the notion of a view dependent region of interest in which the highest level of detail is used for the molecular surface. Outside the region of interest we may or may not display the surface. Our experience is that providing maximal detail in the region of interest outweighs the approach in which less detail is given. Obviously, this observation is application dependent and will not hold for walkthroughs. Bryson and Johan report on an alternative method of time critical computing in interactive time-varying visualization environments, [7]. Assuming a scene consists of a number of individual visualizations, this method carefully assigns a time budget to each individual visualization. They report on different techniques that may used to allow the visualizations to meet their time budget. An example is that of a local isosurface, where there is a fixed cost per polygon so that the only way to control the time required to compute the isosurface is to control the number of polygons. One can start from a point in space a generate isosurface triangles until the time budget is used up. Although computing the geometry in this way is similar to our approach, the zonal map also provides structure information and properties of the object (in our case a molecule). This information can be used by the visualization techniques to control and optimize which fragments of the object are to be visualized. The definition of a molecular surface – due to Richards [8] – is the surface which an exterior probe-sphere touches as it is rolled over the spherical atoms of the molecule. There 2
are many algorithms for analytical computation of molecular surfaces, e.g. [9, 10]. These algorithms vary in their time complexity. In this paper we use an adapted version of the algorithm described by Varshney and Brooks. We use this algorithm because the source code is publically available, but believe that the zonal map technique will also apply to the other computation algorithms of molecular surfaces.
3 The Zonal Map 3.1 Data structure The zonal map is defined as a regular 3D grid of cells. Each atom is represented as a sphere ����� � ��� . Each cell contains a list of with a center and a van der Waal’s radius; ���� atoms for which the corresponding sphere intersects the cell. � The data structure can be written in pseudo-C code as: struct zonal_map { int natoms; Atom *atoms; }[NX][NY][NZ];
/* number atoms in cell */ /* list of atoms */
The resolution of the zonal map depends on various geometric properties of the molecule, such as its bounding box. Usually, each cell is configured to span approximately 0.2 nm. We use the Manhattan distance compute the distance between two cells. The Manhattan distance is the distance between two cells measured along axes at right angles. For example, two cells at � and ��� , have a Manhattan distance of � � � ��� ��������� � ��� ��������� � ��� ��� � . Using the Manhattan distance between two cells, instead of the Euclidean distance between two cells, simplifies the definition of a region in the zonal map. Associated with the zonal map are the view dependent notions of a focus cell and a region of interest:
! focus cell A focus cell is defined as the cell which is at the user’s center of attention. The line of sight obtained from the user’s head position and orientation is used for this purpose. The focus cell is computed by first finding all spheres which intersect the line of sight and selecting the sphere with the smallest distance to the user. The focus cell is the cell in the zonal map which contains the center of the selected sphere. We denote the focus cell as "$# .
! region of interest
A concentric ring of distance % is defined as the set of cells with a Manhattan distance of % to " # . The notation:
"'&(%) *"+#-,.�0/1" � ��2�3 %�453 676 3 % 8�9 : 6�&;" � )"%@? is used to denote the concentric ring of distance % . A region of interest of size less than or equal to A ;
A is the set of cells whose Manhattan distance to "�# is
BDCFE
&GAH *" # ,=�
J
I
�LK�M
"'&(9* N" # ,
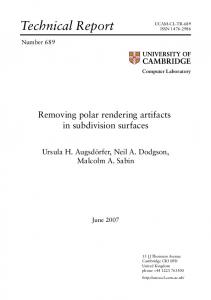
As an example, consider the 2D zonal map with a resolution of 7x7 (see figure 1). A region of interest of size 3 is shaded. Twelve atoms and their van der Waal’s radius are
3
Figure 1: A 2D zonal map. The user’s line of sight determines the focus-cell. The Manhattan distance to the focus-cell is used to determine concentric rings around the focus-cell (shaded cells).
shown; three atoms are outside the region of interest. 1 atom resides in "'&� , . 3 atoms reside in "'&�� , . 2 atoms reside in "'&�� , . 3 atoms reside in "'&�� , . The goal of a time critical algorithm operating using the zonal map can be stated as: Maximize : BFCFE &(%) *" # , % �� �� � � L A (1) Subject to:
������� ����
�� ��������
(2)
in which �� �������� is the target time and ������� �� is the actual time used by the time critical algorithm operating in the region of interest. In the next two sections we give examples of time critical compute and render algorithms of solvent surfaces.
3.2 Time critical computation of solvent surfaces An algorithm for the computation of smooth molecular surfaces is described Varshney and Brooks in 1993, [10]. The algorithm uses the notion of a feasible cell to determine those atoms that contribute to the surface of the molecule. A property of this algorithm is that it can compute the surface by considering only the neighbors of an atom that are close enough to effect the probe placement. The complexity of the surface generation algorithm C is &���� �"!#� , , in which � is the average number of neighbors per atom. Although the algorithm can be parallelized, the computation of the surface of a large molecular configuration may still take a few seconds. The goal of our time critical approach is to restrict the computation of the surface to user’s region of interest. This leads to the following time critical algorithm for computing solvent surfaces: ComputeSurface (in "$# , in $
%(')
�� %�&�����
)
������� ��
0 ' while $ ������� ��*� $ �� %�&�%�+� do foreach $ �-, "'&G%) N"