Topology Modeling of Distribution Network Based on Open-source GIS Yuxing Duan, Chengyou Wang*
Wenjun Zhou
School of Mechanical, Electrical & Information Engineering Shandong University at Weihai Weihai 264209, P. R. China
[email protected],
[email protected]
Integrated Electronic Systems Lab Co. Ltd. Jinan 250100, P. R. China
[email protected]
Acquisition) applications. Power system requires the operating system to be security, stability, etc. Hence, the GIS software had better be run on Linux system which is stable and open. Considering the reasons mentioned above, open-source GIS becomes an important topic in power system.
Abstract—Based on the analysis of spatial data structure of GIS (Geographic Information System), this paper describes the model of the electrical equipment in distribution network combined with the characteristics of electrical model. In this paper, the distribution network topology model which is based on GIS is studied. Moreover, detailed data structures are given. A topology analysis method is proposed to establish the distribution network model; the connection between electrical equipments can be generated automatically according to the terminal position of equipment primitives. On the platform of uDig which is a crossplatform and open-source desktop application framework, the topology data is organized and modeled. Software of DMS (Distribution Management System) which is developed based on this model can run on different operating systems. It solves the problem that DMS usually cannot cross-platform. Key words- distribution network; open-source GIS; topological model; spatial database; cross-platform
I.
INTRODUCTION
Network topology structure is essential in many advanced applications of DMS (Distribution Management System), such as power flow calculation, load forecasting, network reconfiguration, outage analysis, etc [1-2].
II.
GIS DATA ANALYSIS
Data is essential in GIS system. There are two types of data in GIS. One type is called spatial data which is in relation to spatial location and spatial relationship; the other is called attribute data which is the non-spatial attribute information of geographic entity. In traditional applications, the data mentioned above are stored separately. Attribute data is stored in relational database and spatial data is stored as a file because of its particularity. Relational database adopts relational model, has a lack of geometric data type and spatial function, so it cannot calculate and research spatially. With the development of database technology, it is the direction that GIS software describes and stores spatial data in object-oriented manner. However, the object-oriented database cannot support the SQL sentence based on commercial standards. Its usage in electric GIS is not maturity enough [7].
GIS (Geographic Information System) has characteristics of intuitive display and supports efficient spatial analysis and topology analysis. At present, GIS has been widely used in DMS [3-4]. Most of the static data (network topology data) required for advanced applications of DMS are from GIS spatial data. The way to describe the power system topology is different from the usual sense of GIS topology description. This will need a method to transform the topology analysis of spatial data described in GIS to the way that the power system can deal with [5-6]. Nowadays, the commercial GIS platform is usually adopted to implement distribution network GIS application. It is mainly developed and run on the platform of Windows series operating system. Because most of the distribution network monitor is based on UNIX, Linux and other operating systems, it is difficult to use GIS-based SCADA (Supervisory Control And Data *Corresponding author:
[email protected]. This work was supported by the Independent Innovation Foundation of Shandong University (No. 2010ZRJD001).
978-1-4577-0365-2/11/$26.00 ©2011 IEEE
The paper chooses open-source cross-platform GIS software uDig as the development platform. By making full advantage of object-oriented technology, each type of equipment is abstracted to the specific primitive object. When user draws the power wiring diagram in the GIS interface, the software will automatically generate the primitive object of the electrical equipment. The connection node object will be generated automatically according to the terminal position of equipment primitives. It includes the equipment primitives joined together, so the connectivity of the electrical equipments can be generated automatically. Graphic data and attribute data are stored in uniform by using open-source spatial database PostgreSQL/PostGIS. It realizes the integrated management of the graphic and attribute data, and solves the problem of separation between graph and data which exists in the power system for a long time.
527
Line (L) and User (U). The equipment that can supply power such as substation bus is called Source, Switch includes breaker, section switch, etc, distribution transformer is called User and the line that connects Source, Switch, User is called Line.
A. PostgreSQL/PostGIS Introduction PostgreSQL is an open-source object-relational database system. It is compatible with the data in pure relational database. Besides, it supports object-oriented data modal, SQL standard sentence and SQL sentence extension. A little foundational types of geometric entity have defined in PostgreSQL, including point, line, line segment, box, polygon circle, etc. Besides, PostgreSQL defines a series of functions and operators to manipulate and calculate geometric type. PostGIS adds support for geographic objects to PostgreSQL. For instance, it perfects spatial data type and spatial analysis and provides some functions to deal with spatial information such as spatial object, spatial index, spatial function, spatial operator, etc.
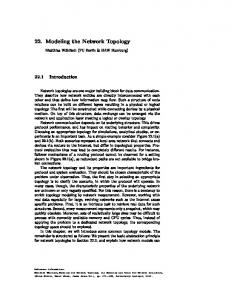
Fig. 1 shows simple distribution network structure [8]. h
1 a
Primary Key
Geometric information
Topology information
5
4 d
e
8
6 f
i
10 l
j
m
9
According to the definition introduced above, distribution network D can be described as follows: D = { Vi, Sj, Lm, Un | i=1,2, …,k; j=1,2, …,l; m=1,2, …,p; n=1,2, …,q }, where k, l, p, q indicates the number of each type of equipment respectively. Based on the object-oriented technology, the electrical equipment model can be defined uniformly as follows: Equipment {Equ_ID, Equ_name, Equ_type, Association attribute, Management attribute}. In the model, Equ_ID is the unique identifier of equipment which is given by GIS platform using uniform coding rules; Equ_name is the name of equipment which is named by users; Equ_type is the subdivision of analog equipment, for example, switch includes section switch, interconnection switch, etc; Association attribute is used to indicate the logic connectivity of equipments; Management attribute is the information that is required to manage and manipulate equipments.
Others
The advantage of the structure is that the spatial data and nonspatial data can be managed together. So, the difficulty of maintaining the integrity of data which is caused by managing data separately can be overcome. III.
3 c
Figure 1. Distribution network structure.
GEOGRAPHIC ENTITY INFORMATION Graph information
2 b
k
B. Spatial Information Management There are two tables in public mode of the database which is created based on PostGIS template, spatial_ref_sys table and geometry_columns table. The first one stores spatial references of OGC (Open Geospatial Consortium) criterion. The second one stores the information of all geometric fields in current database. There are two steps to create a spatial table including geometric field in PostGIS. The first step is to create an ordinary table and then add geometric field to the table. In spatial database, the spatial data of geographic entity can be stored in geometric field which mapped as the column of relational database. Besides, geographic entity includes information such as graph attributes, topology relations, etc. So, the table that stores geographic entity can be designed as Tab. I. TABLE I.
7
g
B. Analysis and Design of Equipment Primitive According to the characteristics of electrical equipments in distribution network, the equipment primitive is designed to meet the requirements of power industry in the aspects of relevant symbols. These symbols’ attributes such as color, line type, line width and so on are used to represent different running states and different component types. At the same time, code can be written to make objects respond to different types of events, laying a good foundation for a variety of operations and analysis in the network map in the future.
DISTRIBUTION NETWORK MODEL
Distribution network is made up of many types of electrical equipments, which can be abstracted as a collection of many objects. In order to display distribution network structure on GIS platform, it is necessary to represent electrical equipments in distribution network as standard graphic symbols. The main difficulty of topology modeling is how to model electrical equipments and how to determine the connectivity among equipment components.
The general class of electrical equipment is designed to supply functions as follows:
A. Equipment Modeling Distribution network mainly consists of substations, feeder lines, switches, distribution transformers and other equipments. Electrical equipments can be classified into four types according to their functions and operating methods, Source (V), Switch (S),
528
•
Determine the style of primitive according to each specific type of equipment;
•
Determine all kinds of primitive attributes.
The general primitive object is defined as follows according to the electrical equipment model. General primitive object {Pri_ID, Pri_name, Pri_type, Connectivity, Attributes}. Specific electrical equipment object is extended from the general primitive object based on its own features. For example, switch object can be defined as follows: Switch object {Switch_ID, Switch_name, Switch_type, Equ1_ID, Equ2_ID, State, Ter1_ID, Ter2_ID …}.
•
For terminal, the connection node object is generated according to the two terminal objects, and the coordinates of both terminals are set to be the same. Therefore, the connection between equipments can display intuitively in geographical wiring diagram.
•
For bus, the connection node object is generated according to current terminal object. The connection node object stores the bus object and terminal object.
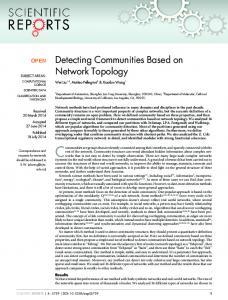
When customer draws in the map, the software will automatically generate the connection node object. The generating process of connection node is shown in Fig. 2.
Electrical equipment has terminal. It can be connected with other equipments through the terminal. The terminal can also be set to float. As one bus can be connected with a variable number of outlets, it can be considered as a special terminal. Terminal class is defined in GIS platform. When creating equipment primitive object, terminal objects are generated automatically according to the type of the equipment. When two or multiple terminals connect, a connection node object is generated which includes conjoint terminal objects. The data structure of the terminal object and connection node object is as follows: Terminal object{Ter_ID, Equ_ID, Coordinate_X, Coordinate_Y} Connection node object {Node_ID, Ter1_ID, Ter2_ID, Ter3_ID} In geography wiring diagram, what the user operates is a variety of equipment primitives. But for drawing and all kinds of analysis behavior, what the system operates is the ultimate object of the database backend. So, it is necessary to establish absolute connection between the corresponding primitive objects and data. For each type of equipment, the corresponding table is created in GIS spatial database. Each primitive object establishes the connection with the database by primary key. IV.
TOPOLOGY MODELING METHOD
Each primitive object contains terminal, the connection between primitive objects can be judged by the position of their terminals. There will be some minor deviations between terminals inevitably when drawing with the mouse. These deviations will directly affect the connections between components and the topology of the whole map. It will affect all the related operations that conduct on the diagram in the future. Therefore, it is necessary to consider that the two terminals within allowable deviation are connected to correctly express distribution network structure.
Figure 2. Generating process of onnection node.
According to the connection node generation process shown in Fig. 2, the connection node objects in distribution diagram shown in Fig. 1 are shown in Tab. II.
In this paper, a small circle with radius r is set up in the terminal of primitive as sensitive area to facilitate connections between terminals. Since the particularity of the bus, the sensitive area of the bus primitive is the rectangular area whose center line is the bus.
In Tab. II, the symbol such as b1, b2 is the terminal identifier of the equipment primitive. The connection node object contains terminals that connect to each other, and further determines the corresponding primitive connectivity. According to the connection node table, the relationship of equipment primitives can be obtained to complete the association attribute of electrical equipments. The topology modeling flow that generates the connectivity of equipment primitives is shown in Fig. 3.
Utilizing the point buffer analysis function of GIS development platform, by traversing the bus objects and terminal objects, all objects in the circle which center on current terminal with a radius r can be get. For different objects, the corresponding treatment methods are different.
529
TABLE II. Node_ID 1 2 3 4 5 6 7 8 9 10
CONNECTION NODE TABLE
Ter1_ID a b2 c2 d2 e2 f2 g2 i2 j2 l2
Ter2_ID b1 c1 d1 e1 f1 g1 h1 j1 k1 m1
V.
Topology modeling is a very important part in realizing GIS functions and determines the quality of GIS software. It will not only affect the query speed of GIS, but also affect the performance of GIS. In this paper, the geographic wiring diagram of distribution is established on the open-source software uDig. The connection relationship of electrical equipments is generated automatically in drawing process. The paper describes the equipment model of distribution network. Then, the design of equipment primitives is studied. Besides, concrete data structure is given. At last, a topology analysis method based on GIS is proposed to establish distribution network model. Electric data and GIS data are described as unified data structure and stored in spatial database, realizing integrated management of graphic and attribute data. The GIS system this paper developed costs little and can run on different operating systems. Advanced applications of DMS which is developed based on this model can run on Linux system. It satisfies the requirement of power system that the operating system should be security and stability.
Ter3_ID
i1 l1
Begin Traverse connection node object Get terminal objects that connect together Get corresponding equipments that connect together Whether the equipment has association attribute?
ACKNOWLEDGMENT The authors would like to express appreciations to Lili Qi for her valuable comments and other helps.
N
REFERENCES
Y
[1]
Complete the association attribute of the equipments N
Traverse over?
[2]
Y End [3]
Figure 3. Flow chart of topology modeling.
According to the topology modeling flow, topology connection relationship of all equipments in distribution network shown in Fig. 1 is shown in Tab. III TABLE III. Equ_ID b c d e f g i j l m
[4]
[5]
TOPOLOGY CONNECTION RELATIONSHIP OF EQUIPMENTS Equ1_ID a b c d e f f i i l
Equ2_ID c d e f g h g k j
CONCLUSION
Equ3_ID
Equ4_ID [6]
i i j l m
[7]
l
[8]
530
F. V. Gomes, S. J. Carneiro, J. L. R. Pereira, M. P. Vinagre, P. A. N. Garcia, E. J. Oliveira, and L. R. Araujo, “A new distribution system reconfiguration approach using optimal power flow technique and sensitivity analysis for loss reduction,” in: Proceedings of the IEEE Power Engineering Society General Meeting, San Francisco, USA, vol. 1, pp. 897-901, Jun. 2005. M. Horvat, J. Vorsic, A. Orgulan, and G. Skerbinek, “Reduction of active losses with reconfiguration of electricity distribution networks,” in: Proceedings of the IEEE Transmission and Distribution Conference, New Orleans, USA, vol. 1, pp. 154-159, Apr. 1999. T. Mohar, K. Bakic, and J. Curk, “Advanced planning procedure and operation of distribution network supported by SCADA and GIS,” in: Proceedings of the IEEE Power Engineering Society Winter Meeting, Singapore, vol. 4, pp. 2780-2785, Jan. 2000. N. G. Boulaxis, and M. P. Papadopoulos, “Optimal feeder routing in distribution system planning using dynamic programming technique and GIS facilities,” IEEE Transactions on Power Delivery, vol. 17, no. 1, pp. 242-247, Jan. 2002. C. W. Ten, E. Wuergler, H. J. Diehl, and H. B. Gooi, “Extraction of geospatial topology and graphics for distribution automation framework,” IEEE Transactions on Power Systems, vol. 23, no. 4, pp. 1776-1782, Nov. 2008. P. A. Parikh and T. D. Nielsen, “Transforming traditional geographic information system to support smart distribution systems,” in: Proceedings of the IEEE/PES Power Systems Conference and Exposition, Seattle, USA, pp. 1-4, Mar. 2009. F. Weng, L. Lin, and Y. Yang, “Discussion of a way of mapping CIM to relative model,” Modern Electric Power, vol. 22, no. 4, pp. 20-24, Aug. 2005. (in Chinnese) Q. Deng, K. Su, and L. Zhao, “Topology analysis and modeling for distribution network based on complicated equipments,” Engineering Journal of Wuhan University, vol. 42, no. 4, pp. 491-495, Aug. 2009. (in Chinese)