VM placement in the data center in the hope of maximizing the profit without violating the service level agreement. (SLA) and the power budget. To that end, we ...
2011 Fourth IEEE International Conference on Utility and Cloud Computing
Towards Profitable Virtual Machine Placement in the Data Center Weiming Shi and Bo Hong School of Electrical and Computer Engineering Georgia Institute of Technology, USA Email: {weimingshi,bohong}@gatech.edu the operation stage of the data center. Intuitively, the higher performance levels the services are provisioned, the more revenue is gained, but unfortunately the more energy costs are incurred. Hence, it is necessary for the data centers to operate under an advantageous operating configuration to gain profit, wherein the revenue overtakes the cost. It is well known that the revenue depends on the pricing model of the service provider. However, how to build up a competitive profitable pricing model depends on various factors which are more relevant to the market economy and the business model, and is out of the scope of our paper. Given the fixed pricing model and the incurred CI, a viable way for the data center to achieve the maximum ROI is to reduce the operational cost by operating under an efficient operating configuration, which clearly needs a careful planning. One way to increase the profit is to reduce the energy costs, as is evidenced by the efforts such as improving the power efficiency of the power systems in the data centers; advocating the PUE (Power Usage Effectiveness) initiated by Green Grid [3] as a metric towards building energy-efficient, environment-friendly data centers; adopting the virtualization-enabled solution (VMware [4], Xen [5], KVM [6]) to increase the utilization of the servers in the data center. These attempts reduce the energy costs for a fixed operating configuration of the data center to certain extent. However, the efficiency of these methods is gradually approaching the theoretic limit. For example, the power efficiency of the state-of-the-art UPS (Uninterruptible Power Supply) system is approaching 95% and the transformers and PDUs (Power Distribution Units) 98% [7]. The semiconductor chips, the horse power of the data centers are also hitting the so-called brick wall by Moore’s Law wherein the power consumption is expensive [8]. Therefore, there are strong economic incentives for the decision makers of the data center to consider maximizing the profit under the limited power budget. In this paper, we try to approach this problem by exploring the dimension of VM placement in the data center in the hope of maximizing the profit without violating the service level agreement (SLA) and the power budget. To that end, we first set up a model of a virtualized data center, and then formulate an optimization problem which aims to maximize the profit under the constraints of the performance requirement of the
Abstract—Motivated by the limit on the power usage effectiveness (PUE) of the data centers, the potential benefit of the consolidation, and the impetus of achieving maximum return on investment (ROI) on the cloud computing market, we investigate VM placement in the data center, formulate a multi-level generalized assignment problem (MGAP) for maximizing the profit under the service level agreement and the power budget constraint based on the model of a virtualized data center, and solve it with a first-fit heuristic. Numerical simulations show that the first-fit heuristic is effective in solving the large-scale instances of the MGAP with the sampled simulation setups. Keywords-Profit Maximization; VM Placement; Data Center; Multi-level Generalized Assignment Problem;
I. I NTRODUCTION Large-scale data centers are constructed to meet the ever-increasing demand for computing power from various domains such as enterprise computing and cloud computing. Typically, a data center is composed of power systems, cooling systems and computing systems [1]. Maintaining such large-scale infrastructures consumes enormous amount of energy and imposes a large carbon footprint on the environment. It was estimated that the power cost of a data center would exceed the cost of the original capital investment by 2012, and that the carbon footprint of data centers would exceed the airline industry by 2020 [2]. With these trends, it would be inadvisable to keep the data centers underutilized, which would unfortunately happen to some extent without careful planning in the data centers. Meanwhile, the IT industry is undergoing a paradigm shift towards leveraging the cloud computing infrastructure to augment or support their business. In one of the service models, namely IaaS (Infrastructure as a Service), computing resources are virtualized and provisioned as services to the customers who may further leverage the provisioned infrastructure to provide domain-specific services to their customers. From the perspective of the service providers, the data centers face the problem on how to maximize their profit given such large amount of energy costs for the operation of the data center. The profit is equal to the revenue minus the cost. The revenue is gained by provisioning the services to the clients, while the cost is incurred for the capital investment (CI) during the initial construction stage and for the maintenance and the service provision during 978-0-7695-4592-9 2011 U.S. Government Work Not Protected by U.S. Copyright DOI 10.1109/UCC.2011.28
138
clients and the affordable power budget of the data center infrastructure. The rest of the paper is organized as follows. In Section II, we provide the background information on our work. In Section III, we describe the system model which lays down the foundation for our discussion. In Section IV, we state the problem and formulate a multi-level generalized assignment problem (MGAP) to address the need of maximizing profit subjective to the SLA and power budget constraint. We provide one effective heuristic for the problem in Section V and show the simulation results in Section VI. Section VII summarizes the related work. Some concluding remarks are given in Section VIII.
After consolidating multiple VMs onto a small number of PMs, the extra idle PMs that would cost a large fraction of operational energy costs can be shut down. Although consolidation helps to save the energy costs, the degraded system performance would lead to the revenue losses. It is natural to relate the VM placement problem to the bin packing problem (BPP), if the resource consumption of the VM is treated as the item size and the resource capacity of the PM as the bin size. The object is to pack as many VMs as possible onto a small number of PMs so as to minimize the number of operating PMs. But certain subtleties differentiate it from BPP: 1) the resource consumption could be multidimensional in terms of the CPU time, the memory, the I/O and the power and may not be simply additive; 2) the SLA of VMs makes the sizes of VMs to be elastic; 3) packing as many as VMs onto a single PM may not be advisable in terms of the power budget and QoS as noted in the works [9] [10] where certain power efficient operating points exist for each PM. Moreover, other challenges exist: 1) VMs and PMs can be heterogeneous. Each has different performance requirement and would incur different resource budget on the host PMs. The incurred resource budget not only depends on the performance requirements of guest VMs, but also depends on the characteristics of the host PMs. 2) The result of the consolidation differs from different optimization objectives. For example, if the interconnect latency between two VMs is to be minimized, they can be consolidated onto a single PM. However, if the ensemble power consumption of those two VMs is to be minimized, it is possible to assign them to different PMs due to their different power characteristics. In this work, we try to address these issues. Instead of minimizing the power consumption, we treat the power budget as a special kind of system resource, quantify the elasticity of the VMs by the predefined performance levels, and endeavor to maximize the profit that can be obtained by provisioning the VMs to the clients without violating the SLA.
II. BACKGROUND I NFORMATION Virtual machine is referred to as VM, and physical machine is referred to as PM throughout the paper. Here we introduce the life cycle of a VM in IaaS model and the VM placement and consolidation for the resource planning of the data centers. A. VM Life Cycle in IaaS Model In IaaS model, the life cycle of a VM starts with the request from the client stating the configuration, the performance requirement and the life time. This request then goes to the data center probably through the interface of the web services. After receiving the request, the data center management system starts searching the resource pool, matching the available physical resources with the requirement, and provisioning the requested VM to the client. Then the client gets the control of the VM and starts running the workloads on it. During the life time, the data center management system will try to provision the VM at the required performance level requested by the client. When the requested life time expires, the VM is released and the physical resources associated with the VM is freed and becomes available for allocation to other VMs again. B. VM Placement and Consolidation
III. S YSTEM M ODELS
Consolidation is a potential way for the data centers to improve the system utilization, reduce the power footprint and increase the profit. It can be conducted at the start of the life time of the VMs when the management system needs to decide how to map the physical resources of the PMs to the provisioned VMs or at a regular frequency after some PMs have already been allocated to provision the VMs. The former is referred to as the VM placement and the latter as the VM consolidation in the literature. In both cases, a set of candidate VMs are needed to be assigned to a set of candidate PMs to fulfill the performance requirement subject to the resource and SLA constraints. The difference is the initial configuration of the system when the decision is made. VM consolidation needs to take into account the migration cost of the VMs while VM placement needs not.
A. A Model of a Virtualized Data Center The model of the virtualized data center under our consideration is composed of a set of interconnected PMs. For the simplicity of the discussion, we assume that the data center has a single-level hierarchy and that there are two levels of system managers, i.e., the global and the local manager, which are responsible for managing the resources in the data center. When the VM requests from clients come, they are first buffered in a service queue before being serviced. The global manager conducts the admission control and deploys the VM requests to the selected PMs based on the current management purpose of the data center and the system information collected from the PMs. The local manager is responsible for implementing the decision of
139
the global manager by scheduling the set of VMs on the assigned PM. It also accounts for monitoring and collecting the information needed by the global manager such as the aggregated resource capacity and the power consumption.
kinds of the SLAs: the hard SLA and the soft SLA. For the hard SLA, if the VMs are not provisioned at the requested levels, then no revenue will be obtained. For the soft SLA, clients are tolerant to the degraded performance levels to some extent, but the obtained revenue suffers certain loss according to the pricing model until no revenue will be obtained if the provision performance level is beyond the tolerance of the clients, which corresponding to k = 0. For instance, if the service levels of the initiated VMs are set at k = 3, then the performance levels can only take two values, i.e., k = {0, 3} for the hard SLA while the performance levels can be k ∈ {0, 1, 2, 3} for the soft SLA. These two kinds of SLAs together with their mixed variants (with different hard and soft SLA ratios) are versatile enough to model a wide range of runtime scenarios of the data centers. We define the SLA violation ratio as follows:
B. Service Level Agreement (SLA) 1) SLA Model: The service level agreement (SLA) is a part of the contract between the clients and service providers. It formally defines the levels of the services and the potential profits the service providers may obtain if the service is delivered to the clients at the agreed levels. From the perspective of the data center, the SLA serves as the constraint for its optimization purpose. The performance metrics in the SLA could be defined for an ensemble of clients or per client. In the context of cloud computing, various performance metrics of SLAs exist such as the averaged response time, the throughput, the mean time between failures (MTBF), etc. For the best interests of the clients, we consider a performance metric defined per client in our paper. For IaaS model which obtains the profit by provisioning the VMs, we take the following SLA model wherein the performance requirement of clients is abstracted as certain predefined performance levels K = {0, 1, · · · , K} of the VMs, and the associated revenue of each provisioned VM is related to its runtime performance level k ∈ K provisioned by the data center.
SV R = 1 − |J � |/|J|
where J � = {j : k(j) = k, j ∈ J}. |J � |/|J| is the hard SLA rate, and SV R represents the percentage of the VMs that are provisioned at the performance levels lower than the requested levels. C. System Resource VM placement inherently involves multiple system resources. Here we identify the power budget of a PM as an important single resource whose consumption deserves careful planning with the power capping mechanism in the data centers. The power usage per VM is related to various system resources such as CPU, memory, I/O, etc. The study on the VM power usage indicates that the power usage is mostly related to load level of the VM, i.e., the utilization of CPU and the memory [11] [12]. So we calculate the power consumption of the host PM with the following power model: P = a + e · u/U (2)
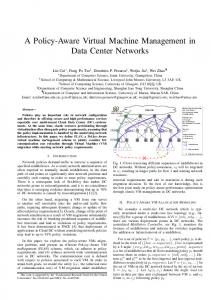
Service Level Agreement (K=4) 100 linear model
Revenue
80 60
sublinear model superlinear model
40 20 0 0
1 2 3 Performance Level (k)
Figure 1.
(1)
4
SLA Model
where the first term a is the idle power and the second term e · u/U is the dynamic power, which is further determined by the VM load level u/U of the host PM. Here idle power a and the maximum dynamic power e are predefined constants determined by the power efficiency of the PM; u is the amount of consumed computing resource, and U is the computing resource capacity, full utilization of which will consume the maximum dynamic power e. For example, if only the CPU resource is considered, and suppose that there are c processor cores C = {1, 2, · · · , c} on one PM, each operating at the frequency fc with an IPC (instructions per clock) value IP Cc , and the PM runs for T time units, then the computing resource of the PM can be defined as: � IP Cc · fc · T (3) U=
Figure 1 illustrates three different pricing models (K = 4) as a part of the SLA model. The revenue suffers certain loss if the provisioned performance level is below the required level but is still acceptable. Level k = 0 is reserved for the out-of-service which obtains no revenue. The revenue of the illustrated pricing model is a linear, sublinear and superlinear function of the performance level k ∈ K respectively, which we believe are versatile enough to fit a wide range of pricing models. The actual function forms of the pricing models may be tuned based on the need of the decision maker and the business purpose. 2) SLA Violation Metric: The elasticity of the VMs plays an important role in the VM placement problem. The more elastic the VMs are, the higher the chance that more VMs can be consolidated onto one PM. Hence we consider two
c∈C
140
U is essentially the number of instructions that can be committed by the PM and hence consumed by the hosted VMs in T time units. A constraint on the power budget can implicitly constrain the consumption of the system resources such as the computing resource usage in (2). Hence, we can treat the power budget as a kind of aggregated resource that implicitly incorporates other system resources in the power model. Note that our model could also apply to the general scenario wherein a detailed additive resource model is available to map the utilized system resources to a single metric that quantifies the resource consumption u and capacity U . However, some efforts are required to minimize the information loss incurred in the mapping. For instance, vastly different amount of resource utilization of different system resources (e.g., the memory and the CPU) could generate the same amount of power consumption because of the different power efficiency of the system resources. Hence the single metric (e.g. the power usage) alone impedes us from identifying the exact resource utilization of the VM (e.g. whether the power usage is mainly attributed to the memory or the CPU). This kind of information loss could be alleviated if we assume the available system configurations (e.g, the number of CPU cores and the amount of memory in the above case) of the VMs are known beforehand and that a proper weighting function can be designed to account for the difference in the power efficiency of the different system resources before mapping the multiple resource utilization to a single metric.
– the dynamic power corresponding to 100% load level ei = (1 − αi )Pi – the power consumption pi – the computing resource capacity Ui – the operational power cost rate mi – the power budget bi , bi ≤ Pi • each VM j ∈ J has the following attributes: – the performance level k ∈ Kj – the computing resource usage uijk – the revenue rijk We assume that the operational cost of the data center is mainly attributed to the power cost of the PMs. The problem is to maximize the total profit with a feasible assignment of J to I. An assignment is essentially a mapping from J to I which can be described by the decision vector x = (xijk ), i∈I,j∈J,k∈Kj . � 1 if PM i provisions VM j at level k xijk = 0 otherwise (4) Hence, the VM placement problem can be formulated as a mixed integer programming (MIP) problem: � �� � rijk xijk − mi pi (5) Maximize R = i∈I j∈J k∈Kj
such that
i∈I
p i ≤ bi ei � � pi = a i + ( uijk xijk ) Ui j∈J k∈Kj �� xijk = 1
∀i∈I
(6)
∀i∈I
(7)
∀j∈J
(8)
∀i∈I,∀j∈J,∀k∈Kj
(9)
i∈I k∈Kj
IV. P ROBLEM F ORMULATION
xijk ∈ {0, 1}
Here we consider the VM placement problem with the objective of maximizing the total profit subject to the SLA and the separable power budget constraint. VM placement is conducted by the global manager at the level of the data center. We focus on the decision making at the data center level and assume that the local manager can fulfill the inclination of the global manager by scheduling the assigned VMs properly under the separable power budget assigned to each PM. For the simplicity of our discussion, we also assume that we can omit the overhead caused by the system managers. The mathematical notations used in the paper are introduced as follows: • the set of candidate PMs: I = {1, 2, · · · , I} • the set of candidate VMs: J = {1, 2, · · · , J} • the set of performance levels: Kj = {0, Kj } int the hard SLA and Kj = {0, 1, 2, · · · , Kj } in the soft SLA • each PM i ∈ I has the following attributes: – the peak power Pi – the idle power rate αi , the lower the value, the higher the power efficiency – the idle power ai = αi Pi
Equation (5) defines the profit as the revenue minus the power cost. Constraint (6) ensures that each PM operates under its power budget. Equation (7) is the power model we stated in Section III-C. Constraint (8) ensures that each VM is assigned to only one PM and operates at only one performance level. Constraint (9) indicates the decision variable xijk is binary. All the parameters are implicitly assumed to take non-negative rational numbers. To preclude trivial solutions, we further assume that: ei ai + uijk ≤ bi ≤ Pi ∀i∈I (10) Ui ei � ai + min uijk > bi ∀i∈I (11) k∈Kj Ui j∈J
Constraint (10) ensures that the resource of one PM is enough to provision one VM at any performance level. Constraint (11) precludes the situation wherein all the VMs can be consolidated onto one PM. V. S OLUTION M ETHOD The formulated problem can be reduced to a multi-level generalized assignment problem (MGAP), if the VMs are
141
treated as the tasks, the PMs as the agents, and the power budget as the resource. MGAP is a variant of the wellstudied generalized assignment problem (GAP). It considers the problem of assigning the set of tasks of the multiple performance levels to the set of agents so that each task is assigned to only one agent at one performance level and the resource capacity of each agent is not violated. It is NPhard and even the problem of determining whether a feasible solution exists is NP-complete [13]. In our problem, we assume the computing resource usage of the VMs takes deterministic values. But our model is general enough to incorporate the stochastic nature of the underlying problem where the actual distribution of the computing resource usage of the VMs uijk could be estimated through data collection and statistical inference in the data center. In the stochastic case, we can derive a deterministic equivalent (DE) problem based on the proportional mean variance model proposed in [14] by assuming that uijk is normally distributed with known mean and variance, i.e., 2 uijk , σijk ), which depicts the scenario that no uijk ∼ N (¯ users are under-utilize or over-utilize the allocated VMs given the mean value as the required performance level. For small-scale instances of MGAP, exact solutions are accessible by leveraging the MIP solver that implements branch-and-bound methods such as provided by CPLEX [15]. But such existing exact solution techniques do not scale to the large-scale instance that models the data center. Therefore, we design a problem-specific heuristic algorithm. There exist some heuristic algorithms such as [16] [17]. We notice that the performance of the first-fit heuristic matches the more complicated heuristics in [16] in the sampled system setups. The complexity of the first-fit heuristic is lower than those heuristics, and the approximation ratio is within 20% of the optimum solution based on our simulation results. Hence, we explore the properties of the VM placement in the data center based on the result of the first-fit heuristic. The heuristic is listed in Algorithm 1. It iterates the list of the unallocated VMs and tries to assign the VMs to PMs which have extra power budgets to provision them. Line 3 finds the first-fit PM that satisfying the power budget and the hard/soft SLA constraint from the list of the candidate PMs. Line 4-8 decide whether the chosen PM is powered on or not, if not, power it on. Line 9-11 update the decision variable and the state variables. Line 12-14 remove the specified PM from the list of the candidate PMs as it can not even provision any VM at the lowest performance level. Line 17-18 calculate the results of the performance metrics
Algorithm 1 First-fit Heuristic Ju = J : the set of unallocated VMs Ip = ∅ : the set of candidate PMs in = 1 : the id of the next PM to be powered-on pijk : the dynamic power of VM j of level k on PM i fijk : the profit of VM j of level k on PM i b�i = bi : the residual power budget pm : the minimum power usage of VM Require: xijk = 0 1: while Ju �= ∅ do 2: j = Ju .next(); 3: ij = the first PM ∈ Ip ∪ in satisfying the SLA 4: if ij is not powered on then 5: Power on PM ij and add it to Ip 6: b�ij = b�ij − ipij 7: in = in + 1 8: end if 9: xij jkj = 1 10: b�ij = b�ij − pij jkj 11: update the profit with fijk 12: if b�ij < pm then 13: delete ij from Ip 14: end if 15: delete j from Ju 16: end while 17: calculate the number of powered-on PMs, the profit 18: calculate the SLA violation rate
second set is to investigate the sensitivity of the solution to the power efficiency, the SLA violation ratio, and the pricing model. For the simplicity of the simulation, all the PMs are set to be homogeneous in terms of the power efficiency. Our model is general enough to consider heterogeneous PMs where the extra step needed is an normalization of the power usage of the VMs versus the power efficiency related parameters of the heterogeneous PMs. Hence, the peak power Pi is set to be 650W and the idle power rate αi is sampled in the range [0.3, 0.7] for all PMs. The power cost rate mi is also set to take the same value $0.01/kWh, although it can take different values to model the situation of the multi-electricity market when the data center is distributed in different areas. The function forms we used for the linear, sublinear and superlinear pricing models are r = 10k, r = 10ln(1 + k), r = 10(1 + k)ln(1 + k) respectively. We define one unit of computing resource be equal to the resource consumption of one VM provisioned at performance level k = 1, and one unit of power budget be equal to the dynamic power usage of one VM provisioned at performance level k = 1 when the idle power rate αi = 0.3. The computing resource capacity of each PM U is set to be 16 units of computing resource, and the power budget of
VI. S IMULATION R ESULTS A. Simulation Setup We conduct two sets of simulations. The first set aims to estimate the approximation ratio of the first-fit heuristic and verify that it is suitable for solving the formulated MGAP which models the VM placement in the data center. The
142
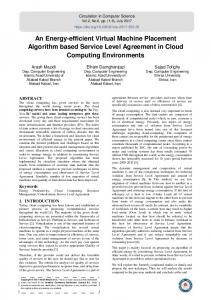
where Mr and Nr are the realization of the profit and the number of the powered-on PMs in the simulation. Note that AR(FF) is over-estimated in this way as the VMs are not divisible in reality. To have Mub /Mr and Nr /Nlb under various system setups, simulations are run with the idle power rate α sampled in the range [0.3, 0.7] with the granularity of 0.1, the hard SLA ratio set to 0, the number of VMs J sampled at 2i , i = [7, 15], i ∈ Z and the superlinear pricing model (corresponding to the largest profit loss). The results of Mub /Mr and Nr /Nlb are shown in the left subplot and the right subplot of Figure 2 respectively. Each curve corresponds to a sampled α. Note that we use the superlinear pricing model to estimate Mub /Mr , but better results are present for sublinear and linear pricing models, and are omitted in the left subplot for brevity. AR(FF) takes the maximum of these two values under the same system setup. It can be seen that the first-fit heuristic approaches the optimal values of the large-scale instances of the MGAP (within 20%), and that a lower value of α leads to lower AR(FF) because lower α provides more power budget and has the higher chance to consolidate multiple VMs onto one PM.
each PM bi to be 16 units of power budget. The number of the available performance levels K are set to 4. The revenue is designed to be proportional to the performance level k of the VM. The workload, i.e., the computing resource usage of each VM is assumed to have a normal distribution with the mean value linearly proportional to its performance level k. Given the number of VMs J, Jk the distribution of the number of instances of each level k ∈ {1, · · · , K} is set to be inversely proportional to k, i.e., Jk = (1 − 2k/(K(K + 1)))J to model the nonincreasing change of the demand with the increase of the price (proportional to k). Each data point is the average result of 10 runs of the simulation. B. Complexity and Quality of the Solution 1.2 1.19
1.04
1.03
1.02
1 2^7
α=0.3 α=0.6 2^8
α=0.4 α=0.7
α=0.5
α=0.3 α=0.6
1.17 1.16
α=0.5
1.14 1.13 1.12 1.11 1.1
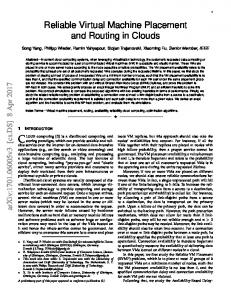
C. Sensitivity to the Power Efficiency and the Hard SLA Ratio and the Pricing Model
1.09 1.08
2^9 2^10 2^11 2^12 2^13 2^14 2^15
1.07 2^7
2^8
Number of VMs
Figure 2.
α=0.4 α=0.7
1.15
2^9 2^10 2^11 2^12 2^13 2^14 2^15 Number of VMs
Estimated Approximation Ratio
Normalized Number of Powered−on PMs
1.01
1.18
The complexity of the first-fit (FF) heuristic is O(IJ) in the worst case. With the proper setting of the threshold pm to remove a PM from the candidate list Ip , the complexity can be further reduced to O(J). FF is a simple online algorithm for solving the bin packing problem with an approximation ratio of 17/10 [18]. To verify the quality of the solution by the first-fit heuristic when the VMs are elastic, we establish the upper bound of the maximum profit Mub and the lower bound of the minimum required number of PMs needed to fulfill the service Nlb , and try to estimate the approximation ratio of the heuristic AR(FF) based on them. Nlb is obtained by assuming the VMs are divisible across the PMs. ��� ei Nlb = min� uijk /U (12) i∈I (bi − ai )
0.96
0.94
0.92
0.9
α=0.3 α=0.6
α=0.4 α=0.7
α=0.5
0.1 0.2 0.3 0.4 0.5 0.6 0.7 0.8 0.9
Figure 3.
0.96 0.94 0.92 0.9 0.88 0.86
1
0.84
α=0.3 α=0.6 0
α=0.4 α=0.7
α=0.5
0.1 0.2 0.3 0.4 0.5 0.6 0.7 0.8 0.9
1
Hard SLA ratio (HSR)
Sensitivity to the Hard SLA ratio, Idle Power Ratio
To test the sensitivity of the obtained solution to the power efficiency and the hard SLA ratio (HSR) and the pricing model, simulations are run with J = 215 , α sampled in the range [0.3, 0.7] with the granularity of 0.1, the HSR sampled in the range [0, 1] with the granularity of 0.1, and the linear (resp. sublinear, superlinear) pricing models taking the function forms described in VI-A. The simulation results are presented in Figure 3. The left subplot of Figure 3 shows the result of the normalized number of powered-on PMs versus the hard SLA ratio of the VMs, normalized w.r.t the maximum value obtained at HSR=1. The results of the normalized average number of powered-on PMs are independent of the pricing models. Each curve of it corresponds to a different α value. The right subplot of Figure 3 shows the results of the normalized profit of the superlinear pricing model versus
i∈I
AR(FF) is estimated by AR(F F ) = max{Mub /Mr , Nr /Nlb }
0.98
Hard SLA ratio (HSR)
Mub is obtained by deducting the power cost of the minimum number of powered-on PMs from the maximum revenue for provisioning all the VMs. � max rijk − Nlb · min(mi · P Pi ) (13) Mub = i∈I,k∈Kj
1 0.98
0.88 0
i∈I j∈J k∈K
j∈J
1
Normalized Profit of Superlinear Pricing Model
1.05
Approximation Ratio i.t.f the Profit
Approximation Ratio i.t.f the Number of Powered−on Machines
1.06
(14)
143
with the same simulation setup in VI-C. Each bar in the plot corresponds to a sampled system setup with the bars corresponding to the same hard SLA ratio grouped together. For a particular HSR, the SLA violation rate is expected to be 1-HSR. However, the first-fit heuristic manages to keep the SLA violation rate under 15% in the worst case under all sampled system setups, even the model has a large tolerance to the SLA violation when the HSR is lower,
1 0.99 0.98 0.97 0.96 0.95 0.94 0.93 0.92 0.91 0.9 0.89 0.88 0.87 0.86 0.85 0.3
Linear Pricing Model Sublinear Pricing Model Superlinear Pricing Model
0.4
0.5
Idle Power Rate α
Figure 4.
0.6
0.7
Normalized Average Number of Powered−on PMs
Normalized Average Profit
the idle power rate, normalized w.r.t the maximum value obtained at HSR=1. The first-fit heuristic manages to control the profit loss within 15% in the worst case, and the profit loss is further reduced to 5% for power efficient system (α = 0.3). Basically, the higher the HSR, the less profit loss is suffered. Better results and the same trend are present for the sublinear and linear pricing models but are omitted for brevity.
VII. R ELATED W ORK
1 0.95
Theoretical results related to this work can be found in [18]–[20]. Generalized assignment problem (GAP) is known to be APX-hard and has been shown to be e/(e−1)+� hard to approximate for some constant � > 0 [19]. The first-fit decreasing (FFD) heuristic has an approximation ratio of 11 9 which is shown to be tight [20]. The first-fit (FF) heuristic does not require sorting as is required by FFD heuristic and has an approximation ratio of 17 10 [18] FFD heuristic has shown to be effective in [21], [22] for mapping the physical resources to the virtual machines. Recently, Beloglazov et. al. compare several proposed heuristics [23] for the efficient energy management of the data center and present several open research challenges. While most of the research literature consider the problem of power management in the virtualized data center, few work targets at maximizing the profit from the perspective of the data centers. Two recent work with similar optimization objectives as ours are [24], [25]. In [24], the authors consider a multi-dimensional SLA-based resource allocation problem based on the queuing model and solve it by a greedy algorithm. In [25], the authors also consider the VM placement in data centers. But they consider an anti-collocation SLA constraint, formulate the problem as a combinatorial auction problem, and solve a relaxed linear programming problem with the column generation method. In our work, the pricing model takes discrete values that are proportional to the required performance levels of the VMs, and hence be more realistic than the continuous pricing model based on the actual resource utilization considered in [25].
0.9 0.85 0.8 0.75 0.7 0.65 0.6 0.55 0.5 0.45 0.4 0.3
0.4
0.5
Idle Power Rate α
0.6
0.7
Sensitivity to Idle Power Ratio and Pricing Model
Figure 4 shows the results of normalized average profit of the three pricing models and the normalized average number of PMs versus the idle power rate. Each data point takes the average value of all the sampled data points of the same idle power rate in Figure 3 and normalized w.r.t the maximum value obtained at α = 0.3. The left subplot shows the three normalized average profit corresponding to the linear, sublinear and superlinear pricing models. The right subplot shows the normalized number of powered-on PMs, which is independent of the pricing models. As we can see, the solution of the sublinear pricing model is more sensitive to the idle power rate than the linear and superlinear pricing models, and the higher the power efficiency (i.e., the lower the α) of PMs, the less powered-on PMs are needed and the more profit the system will obtain. An extrapolation of this trend to α = 0 would seems to be counter-intuitive as the data center would be ‘free’ to power on more servers than the case with a larger α. However, this situation would not happen with the FF heuristic as it breaks the tie by not powering on new PMs if the residual resource is enough.
VIII. C ONCLUSION AND D ISCUSSION
SLA Violation Ratio
D. SLA Violation Rate 15% 14% 13% 12% 11% 10% 9% 8% 7% 6% 5% 4% 3% 2% 1% 0%
This paper studies the profit maximization problem of the data center. We formulate an optimization problem from the perspective of the decision maker of the data center. Our work not only presents a general model for the resource planning in the data centers, but also identifies first-fit as a simple yet effective heuristic for VM placement in the data center which promises to retain profit for data centers. Currently, we adopt the linear power model wherein the power of the hosted VMs is additive. In the future work, a more detailed nonlinear power model wherein the power consumption of the VMs would depend on the operational points of the PMs can be investigated. We also assume that the local manager can successfully schedule the assigned
α=0.3 α=0.4 α=0.5 α=0.6 α=0.7
0%
10%
20%
30%
40%
50%
60%
70%
80%
90% 100%
Hard SLA Ratio
Figure 5.
SLA Violation Ratio
SLA violation rates are independent of the pricing models. The results are also obtained and presented in Figure 5
144
VMs to meet the SLA and power budget constraint. This may not always be true. More accurate information could be gained by leveraging the event-driven simulation framework such as Cloudsim [26]. Besides, we formulate the problem of a single scheduling period. With proper modeling of the migration cost, our proposed model can be extended to investigate the VM consolidation problem over a multiperiod horizon. Note that the modeling of the migration cost may depend on the memory footprints of the VMs.
[11] B. Krishnan, H. Amur, A. Gavrilovska, and K. Schwan, “VM Power Metering: Feasibility and Challenges,” ACM SIGMETRICS Performance Evaluation Review, vol. 38, no. 3, pp. 56–60, 2011. [12] M. Pedram and I. Hwang, “Power and Performance Modeling in a Virtualized Server System,” Power, 2011. [13] F. Glover, J. Hultz, and D. Klingman, “Improved computerbased planning techniques. part ii,” INTERFACES, vol. 9, no. 4, pp. 12–20, 1979. [14] D. Spoerl and R. Wood, “A stochastic generalized assignment problem,” in INFORMS Annual Meeting, Atlanta, GA, vol. 19, 2003, p. 22.
ACKNOWLEDGMENT
[15] “Ibm ilog cplex optimizer,” (accessed July 2011). [Online]. Available: www.ibm.com/software/integration/optimization/cplexoptimizer
This work is supported by the US National Science Foundation under award number CNS-0845583.
[16] A. French and J. Wilson, “Heuristic solution methods for the multilevel generalized assignment problem,” Journal of Heuristics, vol. 8, no. 2, pp. 143–153, 2002.
R EFERENCES [1] L. Barroso and U. H¨olzle, “The datacenter as a computer: An introduction to the design of warehouse-scale machines,” Synthesis Lectures on Computer Architecture, vol. 4, no. 1, pp. 1–108, 2009.
[17] A. Ceselli and G. Righini, “A branch-and-price algorithm for the multilevel generalized assignment problem,” OPERATIONS RESEARCH-BALTIMORE THEN LINTHICUM-, vol. 54, no. 6, p. 1172, 2006.
[2] “Quick start guide to increase data center energy efficiency,” GSA Public Buildings Service, Applied Research Program and DOE Federal Energy Management Program, October 2008.
[18] D. Johnson, A. Demers, J. Ullman, M. Garey, and R. Graham, “Worst-case performance bounds for simple one-dimensional packing algorithms,” SIAM Journal on Computing, vol. 3, p. 299, 1974.
[3] C. Belady, A. Rawson, D. Pfleuger, and S. Cader, “Green grid data center power efficiency metrics: Pue and dcie,” Consortium Green Grid, 2008.
[19] U. Feige and J. Vondrak, “Approximation algorithms for allocation problems: Improving the factor of 1-1/e,” in Foundations of Computer Science, 2006. FOCS’06. 47th Annual IEEE Symposium on. IEEE, 2006, pp. 667–676.
[4] C. Waldspurger, “Memory resource management in VMware ESX server,” ACM SIGOPS Operating Systems Review, vol. 36, no. SI, pp. 181–194, 2002.
[20] G. D´osa, “The tight bound of first fit decreasing bin-packing algorithm is ffd (i) 11/9 opt (i)+ 6/9,” Combinatorics, Algorithms, Probabilistic and Experimental Methodologies, pp. 1–11, 2007.
[5] P. Barham, B. Dragovic, K. Fraser, S. Hand, T. Harris, A. Ho, R. Neugebauer, I. Pratt, and A. Warfield, “Xen and the art of virtualization,” in Proceedings of the nineteenth ACM symposium on Operating systems principles. ACM, 2003, pp. 164–177.
[21] N. Bobroff, A. Kochut, and K. Beaty, “Dynamic placement of virtual machines for managing sla violations,” in Integrated Network Management, 2007. IM’07. 10th IFIP/IEEE International Symposium on. IEEE, 2007, pp. 119–128.
[6] A. Kivity, Y. Kamay, D. Laor, U. Lublin, and A. Liguori, “kvm: the Linux virtual machine monitor,” in Proceedings of the Linux Symposium, vol. 1, 2007, pp. 225–230.
[22] T. Wood, P. Shenoy, A. Venkataramani, and M. Yousif, “Black-box and gray-box strategies for virtual machine migration,” in Proc. NSDI, 2007.
[7] “Energy efficiency and environmental considerations for the data center,” (White Paper) Anixter International, August 2009.
[23] A. Beloglazov, J. Abawajy, and R. Buyya, “Energy-aware resource allocation heuristics for efficient management of data centers for cloud computing,” Future Generation Computer Systems, vol. In Press, Corrected Proof, 2011.
[8] K. Asanovic, R. Bodik, J. Demmel, T. Keaveny, K. Keutzer, J. Kubiatowicz, N. Morgan, D. Patterson, K. Sen, J. Wawrzynek et al., “A view of the parallel computing landscape,” Communications of the ACM, vol. 52, no. 10, pp. 56–67, 2009.
[24] H. Goudarzi and M. Pedram, “Maximizing profit in cloud computing system via resource allocation,” in Intl workshop on Data Center Performance.
[9] S. Srikantaiah, A. Kansal, and F. Zhao, “Energy aware consolidation for cloud computing,” in Proceedings of the 2008 conference on Power aware computing and systems. USENIX Association, 2008, pp. 10–10.
[25] D. Breitgand and A. Epstein, “Sla-aware placement of multivirtual machine elastic services in compute clouds,” in 12th IFIP/IEEE International Symposium on Integrated Network Management (IM11), Dublin, Ireland, 2011.
[10] H. Van, F. Tran, and J. Menaud, “Performance and power management for cloud infrastructures,” in 2010 IEEE 3rd International Conference on Cloud Computing. IEEE, 2010, pp. 329–336.
[26] R. Calheiros, R. Ranjan, C. De Rose, and R. Buyya, “Cloudsim: a novel framework for modeling and simulation of cloud computing infrastructures and services,” 2009.
145