TOWARDS THREE-DIMENSIONAL UNDERWATER MAPPING
WITHOUT ODOMETRY
Alistair Dobke, Joshua Vasquez,
Lauren Lieu, Ben Chasnov,
Christopher Clark
Harvey Mudd College
Claremont, California, USA
{adobke, jvasquez, llieu, bchasnov, clark}@hmc.edu
Ian Dunn, Zo¨e J. Wood California Polytechnic University San Luis Obispo, California, USA
[email protected],
[email protected]
Timothy Gambin
University of Malta, AURORA Trust
Msida, Malta
[email protected]
Abstract This paper presents a method for the creation of three-dimensional maps of underwater cisterns and wells using a submersible robot equipped with two scanning sonars and a compass. Previous work in this area utilized a particle filter to perform offline simultaneous localization and mapping (SLAM) in two dimensions using a single sonar [11]. This work utilizes scan matching and incorporates an additional sonar that scans in a perpendicular plane. Given a set of overlapping horizontal and vertical sonar scans, an algorithm was implemented to map underwater chambers by matching sets of scans using a weighted iterative closest point (ICP) method. This matching process has been augmented to align the features of the underwater cistern data without robot odometry. Results from a swimming pool and an archeological site trials indicate successful mapping is achieved.
I. Introduction Underwater robots are used for the study of harsh, inaccessible environments. These robots allow researchers to explore and collect samples from regions that are dangerous or costly for humans to explore. The application of underwater robots to retrieve data has led to advances in several areas including oceanographic research [15], marine biology, and marine archeology [6]. For example, in [24] underwater robots were shown to navigate
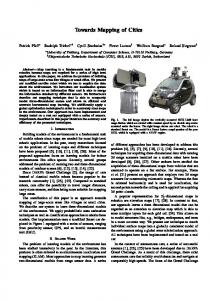
Figure 1: An ROV navigating through an ancient tunnel system in Malta (top) and corresponding render in the generated map (bottom)
rough terrain and efficiently gather data to survey hydrothermal vents. Small-scale (i.e. less than 0.5 meters) underwater robots are ideal for exploration of narrow passageways (see Fig. 1a) including wells, cisterns and var-
ious underwater chambers that feature tight tunnels and access points. Moreover, maps generated of cisterns can provide archaeologists with a detailed glimpse into the underlying structure of these sites. A robot navigating narrow passages and small entrances is unfortunately limited in payload. Furthermore tight passage ways and unpredictable obstacles make motion simulation difficult. This paper presents a strategy that does not require odometry sensors, e.g. Doppler Velocity Log, or motion modeling to construct maps of such underwater tunnel systems. Instead, an ICP algorithm is proposed that uses sonar scans to generate a global map of the underwater passageways. The algorithm relies on measurements from horizontal and vertical scanning sonars, a depth sensor, and a compass. This work is motivated by the multi-year, multiinstitutional project International Computer Engineering Experience (ICEX) that aims to construct maps of ancient water storage systems in collaboration with archeologists in Malta, Gozo, and Sicily. Data was gathered in cisterns and wells in locations that include catacombs, historic parks, modern theaters and conference centres where modern architecture has built on top of ancient sites. What follows is a brief description of related work in Section II, followed by the proposed mapping algorithm in Section III. Swimming pool and archeological site experiments used to validate the approach are documented in Section IV. Results and conclusions drawn from the experiments are presented in Sections V and VI respectively.
II. Background In recent years, implementations of SLAM algorithms have been used to navigate and map underwater terrain [7]. The constructed maps have been used for precise robot navigation and research applications in fields such as marine biology and archaeology. Underwater robot mapping techniques typically combine both odometry and additional sensor information to create a global map of the surrounding environment. Two common mapping techniques are visual mosaics and occupancy grids. The visual mosaic approach generates a composite view of the mapped region from local maps. For example, in
[16], a real time navigation system used underwater mosaics to navigate the seafloor. An occupancy grid, however, discretizes the space being mapped into a grid of cells. The log-likelihood algorithm is typically used to determine the liklihood that each cell of that grid is occupied [23]. Rather than fitting geometric contours to sensor measurements, the scan-matching technique compares and aligns data from raw measurements. In particular, the Iterative Closest Point (ICP) algorithm matches point clouds to determine the relative transformation between scan pairs by iteratively minimizing the distance between points in the data. ICP can be implemented for localization, map building, and path planning. For example, in [10] a pose-based SLAM algorithm was implemented with ICP to estimate robot displacement between consecutive sonar scans. Previous work in Maltese cistern mapping [5], [8], [21], [11] generated maps by visually mosaicking sonar scans, implementing underwater robot SLAM using mobile and stationary scans, and performing particle filter based mapping on sets of stationary scans. Over sixty single sonar data sets have been captured from different Maltese mapping expeditions in the field. Sonar scan mosaicking combined overlapping images by hand to create a composite map. Manual scan mosaicking is tedious and prone to error in estimating the length of overlapping walls between scans, especially for longer tunnels or large, rectangular chambers. In [21], the FastSLAM algorithm used a motion model of the underwater robot to estimate the robot's pose, however the unpredictablility of collision with obstacles severly limited the use of the motion model. Recent work [11] implemented an offline particle filter based pairwise scan matching technique and successfully generated two dimensional maps of Maltese cisterns. Unlike [11], this approach uses ICP based scan matching to determine relative horizontal robot translations between scans, and incorporates additional sonar scans in a perpendicular plane to construct three-dimensional maps. The algorithm uses overlapping stationary scans to localize the robot in the horizontal plane, without robot odometry or a motion model.
Algorithm 1 M = LatticeMap(Z)
1: 2: 3: 4: (a) Dual sonar configuration.
(b) Plot of signal strengths.
5: 6:
[α3 zh,3 zv,3 ] [α1 zh,1 zv,1 ]
[α2 zh,2 zv,2 ]
7: 8: 9: 10: 11: 12:
(c) Series of overlapping scan pairs at unknown poses. Figure 2: Method of data collection using the VideoRay Pro 3 by taking successive stationary horizontal and vertical scans.
III. Algorithm The purpose of this algorithm is to construct a 3D occupancy grid map M = {mi,j,k E [0, 1]|i, j, k E [0..Imax ]}, from a set of sonar measurements Z = {[αt zh,t zv,t ]|t E [0..tmax ]}. A scan pair measurement consists of the robot's compass readingαt and two corresponding 360° sonar scans: one in the horizontal plane, zh,t , and one in the vertical plane, zv,t . To obtain this data set, the robot must use two scanning sonars mounted as shown in Fig. 2a. Each stationary scan zt contains a series of scan angles Oi containing a vector of signal strengths. The returned signal strengths are a function of range and represent the echo intensities of the discretized sonar signal. These orthogonal scan pairs are assumed to be taken simultaneously at time t from a static robot pose Xt = [xt yt αt ], (see Fig. 2b). A series of stationary scan pairs were collected at unknown poses (xt , yt ) as shown in Fig. 2c. To accomplish this goal, the LatticeMap algorithm (Alg. 1) is proposed. LatticeMap begins by low-pass filtering the raw sonar data Z and converting it from polar coordinates to Cartesian coordinates, (step 1). These filtered measurements ˆ t at Z', are next used to estimate the robot's pose X each time step t (i.e. at each stationary scan locations). This estimation is accomplished by finding ˆ t that results in the best match between the pose X the horizontal sonar scan zh,t and the previous T horizontal scans. In this case, we determine the
13:
Z'+ preprocess(Z) for all T E T do for all t do Xpotential + 0 ( while X0 + poseGen (zh,t−T :t , αt ) do * ( , z( X + scan matcher(zh,t h,t−T :t , X0 ) ( ( q + match eval(zh,t , zh,t−T :t , X * ) Xpotential + (X * , q) end while ˆ t + max(Xpotential ) X end for end for ˆ ,Z') M + occupancyGrid(X
best match by generating a number of random robot poses X0 , and using these poses as initial guesses in an ICP algorithm which converges to a local minimum best pose X * , (step 6). The quality q of this pose is calculated using a match evaluation algorithm, (step 7). The best pose is that which has the highest q, (step 10). Once the estimated ˆ t are determined, the entire processed robot poses X measurement set Z', including vertical scans zv,t , are converted to a 3D occupancy grid, (step 13). The algorithm iterates through the scans and considers the scan at time t with respect to the previous T scans zh,t−T :t . Multiple passes with different values of T eliminate noise and generate a more consistent composite map. The key steps to Alg. 1, namely preprocessing, pose generation, scan matching, and match evaluation, are described below. A. Preprocessing
Preprocessing reduces the raw sonar measurement data in Z to the a filtered set of 2D cartesian coordinate points in Z' that represent wall locations in the corresponding environment. The effectiveness of the process depends on the environment and data collection method. Sonar data collected in narrow passageways is subject to a higher likelihood of multipath while data collected in open areas has increased noise levels at longer ranges. To start, each sonar scan is comprised of an array of strength of return measurements si,j for each
Raw data 4 2 0 2 4 4
2
0
2
Extracted points
4
4 Oc Frecupie e d
2 0 2
Cells in conflict Cells unmatched Cells in agreements Robot position
4 4
2
0
2
4
(a) Step 1: Raw data is filtered Figure 4: Step 7 of the LatticeMap algorithm: Scan matches are raytraced to produce occupancy grids, then overlayed. Cells in agreement add to the matchings score.
(b) Step 5: Initial poses are generated. ICP - Iteration 1
Target set
Model set
ICP - Iteration 21
Matched pts
angle the sonar faces Oi . That is, zh,t = {[Oi si,0 ... si,b ] | i E [0 : 360]}. In this case the index that increments from 0 to b corresponds to range from the sonar where the bth strength of return measurement is that at the maximum range. For each angle Oi , strength of returns corresponding to a predefined distance from the origin are zeroed (i.e. a deadzone). A low pass filter is then applied to strength of return arrays. All strength of return values are then zeroed but the n most intense points. Finally, the remaining non-zero strength signals are converted to points in an x-y Cartesian ( coordinate frame, i.e. zh,t = {[xj,t yj,t ] | j E [1 : n]}. See Fig. 3a.
Rejected pairs
(c) Step 6: Given an initial pose, the model set (yellow) are aligned with the points in the target set (black). Figure 3: Steps 1,5, and 6 of the LatticeMap Algorithm
B. Pose generation
The pose generation step creates initial robot poses X0 for the scan zh,t that the ICP algorithm will then use as a starting point for matching zh,t with previous scans zh,t−T :t . Several starting points for the ICP algorithm are required to search for the nearest local minimum [4]. The goal of the pose generator is to generate the minimum number of poses necessary to ide-
ally find the global minimum of the search space. Because overlap is assumed between consecutive scans, poses are only generated within the bounds of the previous scans zt−T :t as shown in Fig. 3b. Furthermore, generating several initial poses that will result in identical scan matches are prevented by defining a radius around each generated pose X0 within which no additional poses are generated. C. Scan Matching
The scan matcher uses an ICP algorithm to determine the pose offset X * between any model set of points zmodel and a target set of points ztarget given an inital offset X0 . Within the context of the LatticeMap algorithm, the model and target point ( and z ( sets will be zh,t h,t−T :t respectively. Fig. 3c shows an example of initial and final poses between two scans. As in preprocessing, implementation details are data-specific. The scan matcher shown in Alg. 2 uses an iterative approach to bring the two point clouds closer together until either of two stopping criterion are met: 1) the number of iterations reaches a specified maximum (step 2) or 2) the sum of square errors between correspondences reaches a threshold errorM in (step 6). As in [17], the three distinctive components of Alg. 2 are point matching (steps 3,4), correspondence rejection (steps 5-14), and minimization (step 15). The point matching component in step 3 considers all points of data. Points in the model set zmodel are matched with their k nearest neighbors by Euclidean distance in the target set ztarget . These correspondences are prioritized by distance and filtered such that no point in either set is repeated, (step 4). Next, the correspondence rejection component filters the remaining correspondences based on their Euclidean distance, (steps 9-14). The average µ and standard deviation ( of the correspondence distances are determined; the correspondences with distance d > µ + S × ( are rejected where S is a predefined scalar. Weighting the distances when calculating these statistics prevents outliers from overly affecting this process. For less noisy data sets, the correspondances can be further filtered by the difference between each corresponding point's
local normal vector [17]. These rejected coorespondences play no further role in the current iteration of scan matching. For the remaining correspondences, ∑ the sum of square errors S S E = ||ztargeti − 2 zmodeli || is calculated. If S S E < errorM in, the algorithm halts. Finally, for the minimization component, a prespecified error metric is minimized (step 15) using the singular value decomposition method [2] or a Levenburg Marquardt solver [1]. A weighted pointpoint error ∑ metric was used for noisier data which minimizes mi ||T ·zmodeli −ztargeti ||2 where T is the transformation matrix corresponding to x( [19]. Here the weight w of a point is proportional to the distance from the scan origin. For cleaner data sets, normal estimation is more∑reliable and a point to plane error metric is used: wi ||ni · (T · zmodeli − ztargeti )||2 where n is the estimated normal about a point [25]. The algorithm transforms zmodel by X * and repeats. After one of the two stopping criteria is reached, the final pose offest X * is returned. Algorithm 2 X * = ScanMatch(zmodel , ztarget , X0 ) 1: 2: 3: 4: 5: 6: 7: 8: 9: 10: 11: 12: 13: 14: 15: 16: 17:
T + X0 while iterations < maxI ters do M + KNearestNeighborsztarget (T · zmodel ) M ( + StableMarriage(Distances(M )) ∑ sse + m∗M ' ||mtarget − mmodel ||2 if sse < errorM in then break µ + Average(Distances(M ( ) ( + StandardDeviation(Distances(M ( )) for all m E M ( do if Distance(m) < µ + S × ( then wi + DistanceWeight(m) else wi + 0 end for ∑ T + argmin( wi ||T · zmodeli − ztargeti ||2 ) end while X* + T
D. Match Evaluation ( The match evaluator considers a scan zh,t−T :t and * matched scan zh,t with pose X and heuristcally score the quality of the matching q. The scans
are superimposed onto a grid and overlayed as shown in Fig. 4. A score is given to each pair of corresponding cells. If a cell occupancy in the grid ( of zh,t−T :t matches the cell occupancy in the grid of zh,t then that cell is given a positive score. Futhermore a ray is traced between the sensor positions of each scan. If the ray does not encounter any occupied cells, an additional score is given to the matching. As such, it is assumed that consecutive scans exist within line of sight of each other. Finally the score of the matching q is the sum of the scores of all the cells and the line of sight bonus. E. Occupancy Grid Generation
Given a set of processed scans Z' and correspondˆ , the occupancy grid generator produces ing poses X a map M = {mi,j,k E [0, 1]|i, j, k E [0..Imax ]} using an octree based log-odds approach [23]. A ˆ t to each ray is traced from the sensor origin X ( ( point in zv,t and zh,t , updating each cell m along the way according to log-odds(mi,j,k,t | Zt( ) = log-odds(Zt( | mi,j,k,t−1 ) + log-odds(mi,j,k,t−1 ).
IV. Experiment To validate the use of the mapping algorithm on an underwater robot system, a micro-ROV was deployed at a swimming pool of known size and several unexplored cisterns. A. Hardware Implementation
A VideoRay Pro 3 mounted with two Tritech Micron scanning sonars was used to collect data. The vehicle payload includes a depth sensor, compass, and video camera. The vehicle is driven with two thrusters placed parallel to each other in the horizontal plane to provide differential thrust control as wel as a single thruster aligned with the vertical plane for depth control. Custom software was developed using the Robot Operating System (ROS) framework [14] to allow for synchronized real time data capture of the control signals and sensors. The scanning sonars were mounted to scan in perpendicular planes. To create a 360° planar scan, the Tritech sonar transmits a directional acoustic
ping for each angle in increments of .4° to 1.8° at a rate of 10Hz-50Hz and records signal strength of return as a function of distance. A high intensity return signal represents strong acoustic reflection in the water at that position. However, due to noise and signal multipath, the highest intensity bin does not necessarily represent a wall or an object. B. Site Descriptions
The algorithm was validated using data sets collected at Maltese cistern and at a swimming pool with known geometry. At both sites, a series of 360° horizontal and vertical stationary scans was recorded as shown in Fig. 2b and Fig. 5. Motion between scans was limited to ensure overlap between consecutive scans as illustrated in Fig. 2c. A reference data set was collected at the Scripps College Tiernan Field House swimming pool located in Claremont, California. The pool is 25 meters in length, has vertical walls, a sloping bottom, and features a semicircular stairwell located in the center of the shallow end of the pool. This data set was used to validate the ICP matching algorithm accuracy. Field exploration was conducted in a cistern located below the Mediterranean Conference Center (MCC) in Malta. The MCC has its roots as a 16th century hospital originally belonging to the Order of St. John [3].
V. Results The LatticeMap algorithm was applied to three data sets: two from a swimming pool at Scripps College Tiernan Field House and one from a cistern at the Mediterranean Conference Center in Malta. The accuracy of the LatticeMap algorithm was validated by comparing the resulting map with the actual pool dimensions with dimensions extracted from the point cloud map generated by the LatticeMap procedure as shown in Fig. 6a. Additionally the generated poses were compare to truth poses as shown in Fig. 7. The generation of the pool data sets took roughly one minute while the cistern data set took five. The true pool dimensions were determined using a measuring tape with an uncertainty of 0.05m.
6
a
4 2
b
r
c
0 -2
d
-4
A
-6 -8
B
-10 -12
-25
-20
-15 Scan points Scan 15 points
-10 -5 Robot positions Scan 15 position
0
Figure 5: Point map of the Scripps Tiernan House pool. Scan 15 is highlighted to illustrate the range of the sonar. Plot includes scans from 23 locations.
Twenty-three stationary scan pairs were collected at the swimming pool (see Fig 5). The error of the LatticeMap algorithm was computed by measuring the dimensions of 9 different geometric parts of the swimming pool. For each part, the truth dimension was compared to the algorithm generated dimension by measuring 10 to 20 different locations on the point cloud generated map. The calculated standard error for the mapped pool dimensions are listed in Fig. 6, demonstrating that 5 out of 9 LatticeMap measurements are within the 95% confidence interval. Additionally, the poses generated by the LatticeMap algorithm were compared to truth poses for 18 scans as shown in Fig. 7. The error in y measurements is an absolute .1 m at all points while the error in x measurements in absolute .1m up to 7.5 meters then compounds at a rate of .1 meters/meter. The error in the x direction grows by approximately 2 cm per meter travelled by the ROV while the error in the y direction averages at .06 m; both errors are within the error of the truth measurements. The map created of MCC meets expectations based on a hand made mosaic of the site and shows that the algorithm can produce a feasible map even when scans are recorded in disjoint chambers as shown in Fig. 8. Furthermore, three-dimensional mesh rendering (Fig. 1b and 8) roughly matches video taken during data collection. To provide archaeologists with a 3D visualization of the MCC, surfaces of the MCC cistern data set
(a) Top down view of Scripps pool.
e α
f
(b) Cross section B.
g
α
a b c d e f g r a
(c) Cross section A. Truth (m, 0 ) Alg. (m, 0 ) 2.03 ± .03 2 6.91 ± .05 7.25 1.30 ± .02 1.25 23.82 ± .12 25 .25 .625 1.13 ± .02 1 3.19 ± .05 3.25 16.95 ± .95 25.9 ± 3.
Figure 6: Map of Scripps pool generated by LatticeMap and comparison to truth data. Standard error of distance measurements is reported.
are reconstructed using the level set technique as shown in Fig. 9. The method is similar to those described in [26] and [12] with some additional processing. Starting with an unorganized point cloud, the data is processed to remove outliers and
Absolute Global Errors
1
x error (meters)
0.8 0.6 0.4 0.2 0 -0.2
0
2
4
6
8
10
12
14
16
12
14
16
x position (meters) 0.2
Figure 8: Map of two rooms connected by a small tunnel in the MCC cistern.
y error (meters)
0.15 0.1 0.05 0 -0.05
0
2
4
6
8
10
x position (meters)
Figure 7: x position error vs. truth x position from 18 scans at the Scripps pool with errors bars reporting the error in truth measurements.
separate individual rooms/sections. For the MCC data set, each room and the connecting tunnel are separated to create three sections. For each section, an occupancy grid is generated and each surface is reconstructed individually. See [13], [26] and [12] for details on the surface reconstruction process. All sections are then merged volumetrically and the surface is generated using marching cubes [9].
VI. Conclusion In this paper an ICP-based three-dimensional underwater mapping method is demonstrated. Notably the algorithm does not require odometric information to generate a consistent global map. Results from two sites validate the method. Extensions to this algorithm may increase the accuracy of the generated maps by incorporating the uncertainty associated with sonar measurements. For example, [10] shows the use of the Mahalanobis distance metric. While most cisterns do not contain looping features, the algorithm could be extended to
Figure 9: Three-dimensional rendered visualization of Mediterranean Conference Center cisterns.
detect loop-closures due to backtracking. Finally, while three-dimensional maps were generated, they relied on the fact that all data was collected on the same z-plane. Removing this limitation and localizing in three dimensions would allow for the capture of richer three-dimensional features.
Acknowledgments The findings in this project are made possible by the support of the following: the National Science Foundation, the Rose Hills Foundation, the Harvey Mudd College Clay Wolken Fellowship, and the Harvey Mudd College Engineering Department. This project was also closely developed and executed in conjuction with research faculty member Dr. Jane Lehr at CalPoly San Luis Obispo. This material is based upon work supported by the National Science Foundation under Grant No. 1245813.
References [1] Agarwal, Sameer, and Keir Mierle. Ceres Solver: Tutorial & Reference. Google Inc (2012). [2] Arun, K. Somani, Thomas S. Huang, and Steven D. Blostein. Least-squares fitting of two 3-D point sets. Pattern Analysis and Machine Intelligence, IEEE Transactions on 5 (1987): 698-700. [3] Bain, Carolyn Lonely Planet Malta an Gozo. Lonely Planet, 2010. Print. [4] Besl, Paul J., and Neil D. McKay. Method for registration of 3-D shapes. Robotics-DL tentative. International Society for Optics and Photonics, 1992. [5] Clark, Christopher M., et al. Archaeology via underwater robots: Mapping and localization within maltese cistern systems. Control, Automation, Robotics and Vision, 2008. ICARCV 2008. 10th International Conference on. IEEE, 2008. [6] Eustice, Ryan M., Hanumant Singh, and John J. Leonard. Exactly sparse delayed-state filters for viewbased SLAM. Robotics, IEEE Transactions on 22.6 (2006): 1100-1114. [7] Fairfield, Nathaniel, George Kantor, and David Wettergreen. Real�Time SLAM with Octree Evidence Grids for Exploration in Underwater Tunnels. Journal of Field Robotics 24.1�2 (2007): 03-21. [8] Hiranandani, D., et al. Underwater robots with sonar and smart tether for underground cistern mapping and exploration. The 10th International Symposium on Virtual Reality, Archaeology and Cultural Heritage VAST. 2009. [9] Lorensen, William E., and Harvey E. Cline. "Marching cubes: A high resolution 3D surface construction algorithm." ACM Siggraph Computer Graphics. Vol. 21. No. 4. ACM, 1987. [10] Mallios, Angelos, et al. Scan matching SLAM in underwater environments. Autonomous Robots (2013): 1-18. [11] McVicker, William, et al. Mapping and visualizing ancient water storage systems with an ROV—An approach based on fusing stationary scans within a particle filter. Robotics and Biomimetics (ROBIO), 2012 IEEE International Conference on. IEEE, 2012. [12] Narayanan, H. Variational level sets in shape reconstruction from unorganised data sets. Project Report, University of Michigan 2005. [13] Osher, Stanley, and Ronald Fedkiw. Level set methods and dynamic implicit surfaces. Vol. 153. Springer, 2003. [14] Quigley, Morgan., Conley, Ken., Gerkey, Brian P.., Faust, Josh., Foote, Tully., Leibs, Jeremy., Wheeler,
Rob., and Ng, Andrew Y. ROS: an open-source Robot Operating System. ICRA Workshop on Open Source Software, 2009. [15] Rachmayer, Ralf, et al. Oceanographic Research Using Remotely Operated Underwater Robotic Vehicles: Exploration of Hydrothermal Vent Sites on the Mid-Atlantic Ridge At 37 North 32 West. Marine Technology Society Journal 32.3 (1998): 37-47. [16] Richmond, Kristof, and Stephen M. Rock. An operational real-time large-scale visual mosaicking and navigation system. OCEANS 2006. IEEE, 2006. [17] Rusinkiewicz, Szymon, and Marc Levoy. Efficient variants of the ICP algorithm. 3-D Digital Imaging and Modeling, 2001. Proceedings. Third International Conference on. IEEE, 2001. [18] Schofield, Oscar, et al. How do polar marine ecosystems respond to rapid climate change?. Science 328.5985 (2010): 1520-1523. [19] Segal, Aleksandr, Dirk Haehnel, and Sebastian Thrun. Generalized-ICP. Robotics: Science and Systems. Vol. 2. 2009. [20] Wang, Wei, and Christopher M. Clark. Modeling and simulation of the VideoRay Pro III underwater vehicle. OCEANS 2006-Asia Pacific. IEEE, 2007. [21] White, Cory, et al. The Malta cistern mapping project: Underwater robot mapping and localization within ancient tunnel systems. Journal of Field Robotics 27.4 (2010): 399-411. [22] Williams, Stefan B., et al. Autonomous underwater simultaneous localisation and map building. Robotics and Automation, 2000. Proceedings. ICRA'00. IEEE International Conference on. Vol. 2. IEEE, 2000. [23] Wurm, Kai M., et al. OctoMap: A probabilistic, flexible, and compact 3D map representation for robotic systems. Proc. of the ICRA 2010 workshop on best practice in 3D perception and modeling for mobile manipulation. Vol. 2. 2010. [24] Yoerger, Dana R., et al. Autonomous and remotely operated vehicle technology for hydrothermal vent discovery, exploration, and sampling. (2007). [25] Y. Chen, G. Medioni. Object Modeling by Registration of Multiple Range Images. Proceedings of the 1992 IEEE Intl. Conf. on Robotics and Automation, pp. 27242729, 1991. [26] Zhao, Hong-Kai, Stanley Osher, and Ronald Fedkiw. Fast surface reconstruction using the level set method. Variational and Level Set Methods in Computer Vision, 2001. Proceedings. IEEE Workshop on. IEEE, 2001.