Traffic sign detection and recognition have been an impor- tant issue for ... is based on FFT applied to the signature of the blob obtained from segmentation and ...
Traffic sign shape classification evaluation I: SVM using Distance to Borders S. Lafuente-Arroyo, P. Gil-Jim´enez, R. Maldonado-Basc´on, F. L´opez-Ferreras and S. Maldonado-Basc´on Dpto. de Teor´ıa de la Se˜nal y Comunicaciones Universidad de Alcal´a Alcal´a de Henares, Madrid e-mail:{sergio.lafuente, pedro.gil, rafael.maldonado, francisco.lopez, saturnino.maldonado}@uah.es Abstract— This paper deals with the detection and classification of traffic signs in outdoor environments. The information provided by traffic signs on roads is very important for the safety of drivers. However, in these situations the illumination conditions can not be predicted, the position and the orientation of signs in the scene are not known and other objects can block the vision of them. For these reasons we have developed an extensive test set which includes all kind of signs. In an artificial vision system, the key to recognize traffic signs is how to detect them and identify their geometric shapes. So, in this work we propose a method that uses a technique based on Support Vector Machines (SVMs) for the classification. The patterns generated by the vectors represent the distances to borders (DtB) of the objects candidate to be traffic signs. Experimental results show the effectiveness of the proposed method.
I. I NTRODUCTION Traffic sign detection and recognition have been an important issue for research recently: [1], [2], [3], [4], [5], [6] are some of these works. In this introduction a general description of the state of art of segmentation is given and in the introduction of [7] a general overview of the state of the art about shape classification for traffic signs is given. Basically, the structure of these kind of systems has two stages: one for the detection and one for the recognition. The detection stage is usually based on color segmentation in a given color space. In [8], a ratio of the RGB components is used assuming the red component as reference. In [9], a similar ratio was used where the reference is the sum of the three RGB components. A binarization is performed multiple times using different thresholds in the YUV color space in [10]. In [11], the proper thresholds for Hue and Saturation bands are applied. A non-linear transform over the Hue and Saturation components are applied in [1] and two look-up tables are used for the thresholding. In [12] the input image pixels are classified into two classes: chromatic and achromatic, and then the red rim of circular traffic sign is detected. For the recognition stage many different solutions have been proposed. A Neural Network (NN) is used for the classification following the Adaptive Resonance Theory paradigm in [1]. In [10] the identification of signs is carried out by a normalized correlation-based pattern matching using
a traffic sign database. In [13], the proposed sign recognition system consists of a nonlinear correlator. The scene and the reference pattern are both Fourier transformed and nonlinearly modified. The correlation plane between the input and the reference signals is obtained by the inverse Fourier transform. In [14] the recognition is done using matching pursuit (MP) in two processes: training and test. The training process finds a set of best MP filter based for each road sign. The testing process projects the input unknown road sign to different set of MP filter bases to find the best match. The detected sign is normalized and is correlated with all of the prototype in [2], a horizontal and vertical displacement of ± 3 pixels is allowed. Many of these works show partial solutions to the general problem of traffic sign detection and recognition and none of them show comparative results with other method. We have created a traffic sign image database test set that can be used to evaluate traffic sign detection and recognition algorithms. Two different methods for detection and classification of traffic signs according to their shape have been developed. The first method is based on Distance to Borders measurement and linear SVM and it is presented in this paper. The other is based on FFT applied to the signature of the blob obtained from segmentation and it is presented in [7]. For these reasons we have developed a test set that covers the most important common problems of traffic sign detection and is available at http://roadanalysis.uah.es. All the signs and properties described are for Spanish traffic signs. II. T EST SET CATEGORIES In this section we show the different categories we have introduced in the test set. A. Different shapes Traffic signs are classified into different shapes. The possible shapes are related to the color of the signs and are the meaning of it. It is necessary to point out that many objects, specially in urban environments, have the same shape and colors than traffic signs and so, they can be confused with the signs. A traffic sign detection system should detect these shapes and, due to different positions where the sign can be found, the module should detect deformed signs because of the projection of the image capture process.
Color Red Rim Red Rim (Up) Red Rim (Down) Red Blue Blue White Yellow
Shape Circle Triangle Triangle Octagonal Square Circle Circle Circle
Meaning Prohibition Danger Yield Stop Recommendation Obligation End of prohibition End of prohibition (construction)
TABLE I M EANING OF TRAFFIC SIGNS ACCORDING TO THE COLOR AND SHAPE
Fig. 2.
Fig. 1.
Images from category C (Different positions)
Images from category B (Different signs)
B. Different signs Traffic signs give drivers and pedestrians diagrammatic information. If we consider all the information messages, the total number of different signs is quite big. Depending on the computation complexity of the recognition stage, this process could be very slow. Fig. 1 shows some images with different signs.
Fig. 3.
Images from category D (Different angles of rotation)
C. Different positions Our aim is to find a traffic sign detection system invariant to shifts. Nevertheless, some authors reduce the looking zone in order to decrease the computation time. In this category we include some images where the traffic signs do not appear in the usual position. In Fig. 2 some images with different positions in the scene are illustrated. D. Rotation There are some occasions where, depending on the place where the images are taken, the traffic signs are turned on their transversal or longitudinal axis (see Fig. 3). For this reason, the traffic signs must be recognized and detected even if they are rotated. E. Occlusion In many situations traffic signs appear partially occluded because there are other elements in the scene such as tree branches, vehicles or other signs that can block the visibility of the signs (see Fig. 4).
Fig. 4.
Images from category E (Partially occlusions)
Fig. 5.
Images from category F (Different sizes)
a method similar to the proposed in [12]. The most important advantages of the classification chromatic/achromatic are orientated to the detection of white signs. In this way, we can detect the signs of a cluster individually. After extracting the candidate blobs, some of these are discarded according to their unsuitable size or aspect ratio regarding to two considerations: a) Irrelevant small blobs and very big blobs are rejected, respectively, like noise and non-interest objects, and b) Since all the signs are regular polygons and, in the ideal position their aspect ratio is , approximately, equal to the unity those blobs whose aspect ratio is much higher or much less than 1 are discarded too, because they may be either noisy blobs or traffic signs with very strong perspective distortion. Finally, each candidate blob in the image is oriented to a reference position in order to get an invariant method against possible rotations. B. Shape classification
Fig. 6.
Images from category G (Deteriorated signs)
F. Sign sizes Since images are captured in motion at different speeds, every traffic sign should appear in different frames or images. So, when the camera approaches to the traffic sign it will appear longer than in the previous image acquired. G. Deteriorated signs Sometimes traffic signs present strict deteriorations for various reasons. In fact, this factor can altere their forms and colors, increasing the complexity of the recognition and detection system. III. S YSTEM OVERVIEW The system that we present in this paper for detection and classification of traffic signs according to their shapes consists of two main stages: A. Segmentation Candidate blobs are extracted from the scene by thresholding using Hue and Saturation components for the colored signs. Intensity is not used in order to get an algorithm invariant to changes of illumination. On the other hand, a division in chromatic and achromatic is performed over every pixel using
Blobs obtained from the segmentation stage are classified into their shapes. For this purpose we have developed a method based on linear Support Vector Machines (SVMs). SVMs were introduced by Vapnik and an extensive tutorial about it can be found in [15]. In the simplest case the training data can be linearly separated and we label them as {xi , yi },where i = 1, ..., l, d and yi ∈ {R} . In our work the vectors xi are the distance to borders (DtB) for each blob how we describe later, the values yi are ’1’ for one class and ’-1’ for the others, d is the number of components of each vector and l is the number of training vectors. If an hyperplane w separates the two classes, the points which lie on it satisfy: w · x + b = 0, where w is normal to the hyperplane, |b|/kwkis the perpendicular distance from the hyperplane to the origin, and kwk is the Euclidean norm of w. For the linearly separable case, the support vector algorithm looks for the separating hyperplane that w y b should satisfy: y i (xi · w + b) − 1 ≥ 0
∀i
If we introduce positive Lagrange multipliers ai , i = 1, ..., l, one for each of the inequality constraints (equal to the number of training vectors) the objective is minimize Lp : Lp =
l l X X 1 2 αi ·y i (xi · w + b) + αi kwk − 2 i=1 i=1
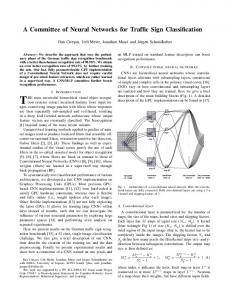
Once the optimization is finished, we determine on which side of the hyperplane lies a given test vector x and assign the corresponding label to it. The decision function is given by: f (x) = sgn(w · x + b) In this work, the vectors that we use as input for the linear SVMs are DtB as it was introduced in [6]. DtB are the distances from the external contour of the blob to the
(a)
Fig. 7. Linear separating hyperplanes for the separable two dimensional case: class C1 and class C2 . The support vectors are circled
(b)
(c) 1
1
0.8
0.8
0.6
0.6
0.4
0.4
0.2 0
0.2
0
5
10 D1
15
0
20
1
1
0.8
0.8
0.6
0.6
0.4
0.4
0.2
0.2
0
0
5
10 D3
15
0
20
0
5
10 D2
15
20
0
5
10 D4
15
20
0
5
10 D2
15
20
0
5
10 D4
15
20
0
5
10 D2
15
20
0
5
10 D4
15
20
(d)
Fig. 8.
Extraction of DtB vectors for a triangular shape
1
1
0.8
0.8
0.6
0.6
0.4
0.4
0.2 0
bounding-box in which it can be inscribed as we can see in Fig. 8. In the same way, Fig. 9 shows the four DtB vectors for three examples of signs with different shapes. The main advantage of this method is its robustness to several factors such as translations, rotations and scale. The algorithm is invariant to translation because does not matter where the candidate blobs appear in the scene. It is invariant to rotations because all blobs have been previously orientated in a reference position. And finally, it is invariant to changes of scale because 20 samples equally-spaced of every DtB vector are obtained independently of the size of the traffic signs. We use a different structure of classifying for each segmentation color. For example, in the case of red segmentated blobs we use eight linear SVMs; four for each possible shape: triangular and circular. Thus, the vectors extracted of a blob by red color feeds four SVMs to classify it as a possible circle (label ’1’) or no circle (label ’-1’) and another four SVMs to classify it as a possible triangle (label ’1’) or no triangle (label ’-1’). Then, four favorable votes are possible for each shape and, at least, two votes are required to assign a shapeclass to the blobs of interest. A majority voting method has been applied in order to get the classification. In case of tie, positives outputs of SVMs are computed to decide which is
0.2
0
5
10 D1
15
0
20
1
1
0.8
0.8
0.6
0.6
0.4
0.4
0.2 0
0.2
0
5
10 D3
15
0
20
(e) 1
1
0.8
0.8
0.6
0.6
0.4
0.4
0.2
0.2
0
0
5
10 D1
15
0
20
1
1
0.8
0.8
0.6
0.6
0.4
0.4
0.2
0.2
0
0
5
10 D3
15
0
20
(f) Fig. 9. DtB vectors for traffic signs. (a) Mask of red segmentation for a circular sign, (b) Mask of red segmentation for a triangular sign, (c) Mask of blue segmentation for a rectangular sign, (d) DtB vectors of (a), (e) DtB vectors of (b), (f) DtB Vectors of (c)
Number Imag. 30 30 30 30 40 40 30 37 40 23
(a) 1
1
0.8
0.8
0.6
0.6
0.4
0.4
0.2
0.2
0
0
5
10 D1
15
0
20
1
1
0.8
0.8
0.6
0.6
0.4
0.4
0.2
0.2
0
0
5
10 D3
15
0
20
0
0
5
5
10 D2
10 D4
15
15
20
20
(b) Fig. 10. DtB vectors for an example of occlusion. (a) Mask of red segmentation, (b) DtB vectors of (a)
the candidate shape and if the total number of votes is lower than 2, the object is discarded like noise. It is important to point out that octagonal signs are considered like circular because at high-medium distances their vectors are very similar to the corresponding for a circular shape. In the next stage of recognition, stop sign will be identified using the information of its inner area. In addition to the factors mentioned above, we can say that the method described is strongly robust to occlusions because we describe every geometric shape with four independent parameters. The worst case is when the occlusion blocks the vision of, at least, one of the two points that determine the rotation of the blob. These situations make more difficult the problem of classification with this method because the evolution of DtB vectors can be modified respect to the expected. IV. R ESULTS The classification algorithm mentioned has been tested using over 300 images approximately of our test set, where one or more traffic signs can be found in each frame. Table IV shows the results for all categories in the database. The parameters evaluated are: first, the classification success defined as the ratio between the number of signs whose geometric shapes are classified correctly and the total number of signs which have been isolated in the previous segmentation process. The second parameter is the number of false alarms yielded by the system since some segmented noisy blobs of the scene are classified by their shape as possible candidates to traffic signs and the third parameter expresses the loss probability, as the ratio between the number of lost signs (because
Category Dif. Shapes Dif. Shapes Dif. Shapes Dif. Shapes Dif. Signs Dif. Posit. Rotation Occlusion Dif. Sizes Deter. Signs
Subcateg. Circular Octagonal Rectang. Triangular -
Classif. Success 41/41 33/34 33/35 61/62 53/54 73/75 32/32 45/46 37/38 42/44
False Alarms 43 49 78 101 91 116 88 116 74 92
Loss Prob. % 22.23 11.2 8.11 28.28 17.25 26.32 29.27 47.62 50.95 25.00
TABLE II R ESULTS FOR EVERY CATEGORY
either they were not correctly isolated in the segmentation process or not correctly classified in the classification step), and the total amount of signs which appear in the images. We note that the most of cases of lost signs are produced because the segmentation of these signs was extremely difficult since other objects of the same color appear next to the sign or the size of signs is quite small when are captured at very high distances from the camera. For getting these results, the outputs of our system are compared with the position of the sign analyzed by a human operator. From the results summarized in this section we can conclude that our classifying method is very robust for all the problems considered although the number of false alarms caused by the presence of other objects in the scene of similar color and aspect respect to traffic signs is quite high. The loss probability is high specially in the categories of ”Different sizes” and ”Occlusions”. Firstly, in the category of ”Different sizes” there are signs at very high distance from the camera and some of them are not detected by our system and, secondly, in the category of ”Occlusions” some traffic signs have been discarded either by a difficult segmentation mask or because the number of votes at the output of SVMs is lower than the value of the threshold fixed (i.e. 2). However, it is necessary to point out that our system classifies successfully almost all the signs segmented correctly. An average of 10 signs from a different data set for every shape were chosen for the training process. V. C ONCLUSION This paper proposes a new method for classifying the shapes of traffic signs based on the capability of SVMs. The patterns we use are generated by the four DtB vectors for every sign and, in our aim, we use a linear classification taking advance of its low computational cost. Experimental results indicate that our system is robust under various conditions. However, the high number of false alarms will be reduced in future works analyzing other measures from blobs than the ones mentioned here. Therefore, in the next stage of recognition noisy blobs will be rejected according to the low similarity between the inner area of traffic signs and candidate blobs.
Fig. 11.
Traffic sign detection examples using SVMs algorithm
Fig. 12.
Traffic sign detection examples with rotations
In this paper only single images are considered. In future works, several consecutive images will be considered and so, using ”inter-frame” information, false alarms should be reduced as well as loss probability. Finally, the specific recognition of every sign has not been studied in this paper and it remains as a future research. ACKNOWLEDGMENT This work was supported by the project of the Ministerio de Educaci´on y Ciencia de Espa˜na number TEC2004/03511/TCM. R EFERENCES [1] A. de la Escalera, J. M. Armingol, and Mata M. Traffic sign recognition and analysis for intelligent vehicles. Image and vision computing, 21:247–258, 2003. [2] A. de la Escalera, J. M. Armingol, J. M. Pastor, and F. J.. Rodr´ıguez. Visual sign information extraction and identification by deformable models for intelligent vehicles. IEEE trans. on intelligent transportation systems, 5(2):57–68, 2004.
Fig. 13.
Traffic sign detection examples with partially occluded signs
[3] C. Fang, S. Chen, and Fuh C. Road sign detection and tracking. IEEE trans. on vehicular technology, 52(5):1329–1341, September 2003. [4] C. Y. Fang, C. S. Fuh, P. S. Yen, S. Cherng, and Chen S. W. An automatic road sign recognition system based on a computational model of human recognition processing. Computer Vision and Image Understanding, 96:237–268, August 2004. [5] A. Farag and A. E. Abdel-Hakim. Detection, categorization and recognition of road signs form autonomous navigation. Proc. of ACIVS, pages 125–130, September 2004. [6] S. Lafuente-Arroyo, P. Garc´ıa-D´ıaz, F. J. Acevedo-Rodr´ıguez, P. GilJim´enez, and S. Maldonado-Basc´on. Traffic sign classification invariant to rotations using support vector machines. ACIVS’04, August 2004. [7] P. Gil-Jim´enez, S. Lafuente-Arroyo, H Gomez-Moreno, F. L´opezFerreras, and S. Maldonado-Basc´on. Traffic sign shape classification evaluation II: FFT applied to the signature of blobs. 2005 IEEE Intelligent Vehicles Symposium, June 2005. [8] A. de la Escalera, L.E. Moreno, M. A. Salichs, and J.M. Armingol. Road traffic sign detection and classification. IEEE trans. on industrial electronics, 44(6):848–859, December 1997. [9] H. Kamada, S. Naoi, and T. Gotoh. A compact navigation system using image processing and fuzzy control. Southeastcon Proceedings, 1:337 – 342, April 1990. [10] J. Miura, T. Kanda, and Shirai Y. An active vision system for real-time traffic sign recognition. Proc. IEEE Inteligent transportation systems, pages 52–57, october 2000. [11] P. Arnoul, M. Viala, Guerin J.P., and Mergy M. Traffic signs localisation for highways inventory from a video camera on board a moving collection van. Proc of the Symposium of Intelligent Vehicles, pages 141–146, September 1996. [12] H. Liu, D. Liu, and J. Xin. Real-time recognition of road traffic sign in motion image based on genetic algorithm. Proc. of the 1st int. conference on machine learning and cybernetics, pages 83–86, November 2002. [13] E. P´erez and B. Javidi. Nonlinear distortion-tolerant filters for detection of road signs in background noise. IEEE trans. on Vehicular Technology, 51(3):567–576, May 2002. [14] S. H. Hsu and C. L. Huang. Road sign detection and recognition using matching pursuit method. Image and Vision Computing, 19:119–129, 2001. [15] Christopher J. C. Burges. A tutorial on support vector machines for pattern recognition. Data Mining and Knowledge Discovery, 2(2):121– 167, 1998.