The traffic sign classification is arranged by a Support Vectors ... road sign is also vital for a successful recognition. .... been taken by a Sony Digital Camera.
TRAFFIC SIGN CLASSIFICATION INVARIANT TO ROTATIONS USING SUPPORT VECTOR MACHINES S. Lafuente-Arroyo, P. García-Díaz, F.J. Acevedo-Rodríguez, P. Gil-Jiménez, S. MaldonadoBascón {sergio.lafuente, pilar.garcia, pedro.gil, saturnino.maldonado}@uah.es Departamento de Teoría de la Señal y Comunicaciones Universidad de Alcalá. Escuela Politécnica. Campus Universitario 28871. Alcalá de Henares. Madrid. SPAIN ABSTRACT The aim of this paper is to obtain a new investigation technique on field of recognition and classification of traffic signs through artificial vision. The method consists of analyzing distances from edges of the shape to reference axis. The traffic sign classification is arranged by a Support Vectors Machine (SVM) which has been trained for circular, rectangular, triangular and octagonal forms. The process consists of two major steps: segmentation according to the color and identifying the geometric shape of the candidate blobs using SVMs. Before pattern recognition it is convenient to discard the blobs whose size is not properly. The most important advantages are its robustness against possible inclinations would have the traffic or highway sings, and on the other hand, its low computation load. Key-words: traffic sign, image segmentation, candidate blobs, bounding box, angle of rotation, distances between edges, Support Vector Machines.
1.
INTRODUCTION
Recognition of highway signs has become an important object of study during the last years. Pattern recognition has important and multiple applications on traffic signs images:
Support to intelligent vehicles Road security Complement to highways maintenance, referring to inventories of road signs
Colors of traffic signs are usually showy and intense. It is common using color feature to recognize them around the others elements[3] [7] like cars, trees, houses, advertising posters, etc. A first classification of road signs according to color distinguishes between red
and blue ones. Both colors can be present on signs performing their edges as well like backcolor. Two situations do more difficult the detection of road sings: elements in the natural road scene which have similar colors to traffic signs to detect and illumination changes which modify color characteristics (hue, saturation and intensity). There are vehicles or advertising posters, for example, which have intensive red or blue colors. In many cases, the size of blob, obtained through segmentation, can be used to remove them like candidate signs. In others, it will be necessary analyze the shape to determine if the blob is a good candidate or not. Image quality depends mainly on illumination and ambient conditions (vision through sunny light in cloudy days or artificial light during night). The state of road sign is also vital for a successful recognition. Some of them are deteriorated by atmospheric aggressions or vandalism actions. Investigation lines has been achieved to solve illumination changes using techniques based on textures[8] [9] or artificial neural networks[2] [6]. The most commonly techniques used to pattern recognition are based on masks searching[3] and based on genetic algorithms[1]. Techniques based on masks present low reliability with partial occlusions and rotation occurrences. When the shape to classify is not completed at least in one of its vertices, road signs behind other element like a tree, the mask searching algorithm would not be able to recognize it. Genetic algorithms have disadvantages like premature convergences or working around local maximal/minimal points. We present a new algorithm for detection and classification of traffic signs which is robust to rotations. The technique is based on SVMs. Training and test is performed on vectors sets which components are geometric characteristics of blobs. Results are invariant to rotation angles.
2.
SEGMENTATION OF IMAGES
Segmentation of images is the first step in traffic signs recognition. We perform the segmentation according to color features. After tested several color spaces over a bank of 300 images, we conclude that using HSI system get better results than others like RGB system. In fact, HSI is stronger against illumination changes. The three-dimensional representation of space HSI is defined by hue, saturation and intensity (see Figure 1). HSI coordinates are easily calculated from RGB components. We do not use intensity feature because the next two reasons: intensity does not really give information about color and this characteristic is also strongly dependent of illumination changes. Due these reasons, equation (1) represents segmentation for coordinates hue and saturation, where Ha and Hb are the minimal and maximal values of hue; Sa corresponds to the minimal value of saturation; fH and fS are, respectively, coordinates of hue and saturation of pixels and finally, k1 and k2 mean the assigned threshold values.
actions or danger indications) we put special attention on segmentation according to red color. In many cases, parts of a traffic sign have different shades. In order to obtain more completed segmentation information, we apply a new threshold on neighboring pixels of segmented zones with more relaxed values of Ha, Hb and Sa. We improve segmentation information executing a dilation plus erosion process. This practice cleans error pixels of the candidate blobs. At this point, we have one or more zones which can belong traffic signs. We discard those ones whose size is too big or too small for the whole image size. The established criterion considers only blobs lager than 1/20-th and smaller than 1/3-rd of the image size. Figure 2 shows an example of this processing according to red color. Two blobs are obtained; the second one is composed by red light in a car of the image, so it is not a good candidate blob for our algorithm.
H ≤ f ( x, y ) ≤ H b (H b ≥ H a )
S g(x, y) = k1 if a f H ( x, y ) ≥ S a
(1)
g(x, y) = k 2 otherwise
Figure 2: Segmentation of candidate blobs using color threshold. It appears a noisily blob on first picture.
3.
Figure 1: HSI color space
So using hue and saturation characteristics, every image is segmented looking for red and blue zones. Due the meaning of red color in road signs (duties, forbidden
SHAPE ANALYSIS
The second step will focus on geometric shape recognition of traffic signs. In Spain, blue color appears on traffic signs which have circular shape (duties) or rectangular one (information), whereas red color appears on traffic signs which have triangular shape (danger indications), circular (forbidden actions and special restrictions) or octagonal shape (stop). As shown in Figure 3, the threshold color allows take out some geometric shapes as no possible ones. As mentioned before, most of existing works about traffic signal classification use masks searching techniques[3], neural networks[1] or Fourier
transform[7]. This paper describes a new method of shape analysis based on SVMs. We use a different support vectors sets for each shape (circular, triangular, rectangular, and octagonal). SVMs input vectors are distances between each blob border to the side of the smallest rectangular area in which they can be inscribed (bounding box).
Figure 4: Rotation angle
There are two possible kinds of triangular traffic signs: the ordinary one meaning “danger” and the inverted one or “give way” sign. Both of them are placed on same reference position, so we use a unique SVM for identifying triangular patterns.
Figure 3: Shape analysis algorithm
3.1. Angle of rotation Road signs are normally in vertical position. We determinate a reference system in order to avoid that recognition does not depend on signs are or not perfectly verticals, that is, independent of rotations. Thus, for each blob obtained after segmentation process, the program detects the optimal rotation angle in order to locate it in an easy-to-identify pattern situation. Every circular, triangular, rectangular or octagonal sign will be placed on a fixed reference position, and therefore support vectors do not depend on rotations. Rotation angle can be obtained from left and right external edges of the blob, which are represented like P and P’ in Figure 4. The transformation equations below associate original and target points.
x' = xcosθ - ysinθ y' = ycosθ + xsinθ
(2)
Figure 5: Rotation of triangular road sign
3.2. Support Vector Machines concepts applied In the simplest decision problem we have a number of vectors divided into two sets, for example, decide if our blob belongs to a circular or a rectangular shape. The key consists of finding the optimal decision frontier to divide these sets. This optimal election will be the line that maximizes distance from the frontier to the data. In a multidimensional space the frontier is a hyperplane. Given a vector x� , equation (3) shows the decision function to classify x� : L
f( x� ) = ∑ αi yi x� i ⋅ x� + b i=1
(3)
We use a set of training vectors x�i which is known as support vectors. The cardinal of support vector set is L. The inner product is performed between each training vector and the data that must be classified. The y values are (+1) for one set and (-1) for the other one. At lasts, α values are the Lagrange multipliers obtained in the minimization process.
When data are not linearly separable this scheme can not be used directly. In this case, SVMs map input data into a high dimensional feature space. SVMs construct an optimal hyperplane in the high dimensional space and then returns to the original space transforming this hyperplane in a non-linear decision frontier. The non-linear expression for the classification function is given in equation (4) where K is the kernel that performs the non-linear mapping. The choice to this non-linear mapping function or kernel is very important in the performance of the SVMs. L
f( x� ) = ∑ αi yi K ( x� i , x� ) + b i=1
(4)
( d1 )i
= ( Xl )i - ( X min )i
( d 2 )i = ( Xr )i -( Xmax )i
horizontal axis (5)
( d3 ) j = ( Yu ) j - ( Ymax ) j ( d 4 ) j = ( Yd ) j - ( Ymin ) j
vertical axis
Figure 6 represents the extracted feature vectors obtained from the normalized distances for a triangular traffic sign.
3.3. Extraction of features
In this section we present the real implementation of the algorithm described above. We use a Linear Kernel SVM modeled by equation (3). We must define support vectors xi and the αi values that give information relative to the decision frontier. Support vectors are constructed via real images. Vectors are composed by 20 components. Its values are normalized to facility operations. We defined them by distances between blobs to the four bounding box borders. Due the four borders, we work also with four SVMs. The final decision for each vector (D1, D2, D3 and D4) will be the most frequent one given by the four tests. In this way, the recognition system will be more robust to noise. Equation (5) shows the expressions of the components for each vector, where:
(d1)i corresponds to distance between the first left pixel i of blob, (Xl)i, to left line of bounding box (Xmin)i. (d2)i represents distance between the last right pixel i of blob, (Xr)i, to right line of bounding box (Xmax)i. (d3)i means distance between the highest pixel i of blob, (Yu)i, to the highest line of bounding box (Ymax)i. (d4)i is a symbol of distance between the lowest pixel i of blob, (Yd)i, to the lowest line of bounding box (Ymin)i.
Figure 6: Extraction of vectors in reference position
As mentioned before, SVMs has to test four vectors (see Figure 7). Each input vector produce an inference. The majority one will be the answer to the geometric shape.
Figure 7: Testing diagram
4.
RESULTS
This section presents the results of the algorithm proposed. The algorithm has been implemented in Visual C++ 6.0. In order to classify the shape of traffic signs, we work SVMs based on Linear Kernel. The main reason to select this model is its low computational requirements with good results in this case. The recognition and classification process run on MATLAB 6.1 on a Pentium to 2.2 GHz. To test the goodness of the method we use images where traffic signs are easier to find them and images that, due to outdoor issues like occlusion or illumination, are more complex. The training and test has been realized in the next way:
Training the SVMs with 30 signals of each shapes (circular, triangular, octagonal). Gaussian noise has been added in order to reduce effects of the image noise. Testing over a bank of 250 images.
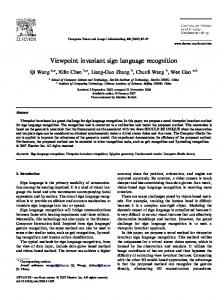
Figure 8 shows success percentages in the classification of road signs. Octagonal shapes have the worst results due to the high similarity to circular ones in medium/high distances from traffic sign to camera. The images, which we have trained and tested, have been taken by a Sony Digital Camera. They belong to rural and urbane places in Madrid and Guadalajara cities, as well as roads and highways between both cities.
Figure 8: Results of classification algorithm using SVM
5.
CONCLUSIONS
This paper presents a new procedure of recognizing traffic signs based on Support Vectors Machines. It has been successfully applied over an images bank. The results illustrated show the invariance against rotations. As conclusion, the training can be used over different images with acceptable results. Future works will be oriented to the recognition of contents of signs. There are several options for this task. The two techniques more used are neuronal networks and extraction of the skeleton of candidate blobs, specially the first one.
6.
REFERENCES
[1] Y. Aoyagi, T. Akasura. A study on traffic sign recognition in scene image using genetic algorithms and neuronal networks. Proceedings of the 22nd Int. Conf. On Industrial Electronics, Control and Instrumentation, pages. 1838-43, Taipeis, August 1996. [2] N. Bartneck, W. Ritter. Colour segmentation with polynomial classification. Proc. of 11ht Int. Conf. on Pattern Recognition, vol. II, pp. 635-638, August 1992. [3] A. de la Escalera, L. Moreno, M.A. Salichs, J.Mª. Armengol. Road Traffic Sign Detection and Classification. IEEE Transaction on Industrial Electronics 44 (6): 848-859, December 1997. [4] D. Gavrila, V. Philomin. Real-time object detection using distance transforms. Proceedings of the Seventh IEEE International Conference on Computer Vision, pages 8793, Kerkyra, Septembre, 1999. [5] S.-H. Hsu and C.-L. Huang. Road sign detection and recognition using matching pursuit method. Image and Vision Computing, 19: 119-129, 2001. [6] R. Janssen, W. Ritter, J. Stein, S. Ott. Hybrid approach for traffic sign recognition. Proc. Of 1993. IEEE Intelligent Vehicles Symposium, pp. 678-685, July 1993.
[7] D.S. Kang, N.C. Griswold, N. Kehtarnavaz. An invariant traffic sign recognition system based on sequential color processing and geometrical transformation. Proc. Of the IEEE Southwest Symposium on Image Analysis and Interpretation, pp.88-93, Dallas, TX, April 1994. [8] R. C. Luo, H. Potlapally, D. Hislop, Natural scene segmentation using fractal based autocorrelation. IEEE Int. Conf. on Ind. Elect., Control, Instrum. and Automation, vol. 2, pp. 700-705, November 1992. [9] A. C. She, Huang. Segmentation of road scenes using color and fractal based texture classification, 1994 IEEE Int. Conf. on Image Processing, vol. 3, pp. 1026-1030, November 1994.