Dec 1, 2003 - Administration, the American Association of State Highway and ... developed a new construct for traffic signal state transition using enhanced.
Project 3-66
COPY NO.___
TRAFFIC SIGNAL STATE TRANSITION LOGIC USING ENHANCED SENSOR INFORMATION DRAFT INTERIM REPORT Prepared for National Cooperative Highway Research Program Transportation Research Board National Research Council
Transportation Research Board NAS-NRC PRIVLEDGED DOCUMENT This report, not released for publication, is furnished only for review to Members of or participants in the work for the National Cooperative Highway Research Program (NCHRP). It is to be regarded as fully privileged, and dissemination of the information included herein must be approved by NCHRP.
Tom Urbanik and Scott Beaird, University of Tennessee Doug Gettman and Larry Head, Siemens ITS Darcy Bullock and Ed Smaglik, Purdue University Rick Campbell and Matt Ablett, Railroad Controls Limited
December 2003
NCHRP 3-66 Interim Report
i
December 2003
ACKNOWLEDGEMENT OF SPONSORSHIP This work was sponsored by the American Association of State Highway and Transportation Officials, in cooperation with the Federal Highway Administration, and was conducted in the National Cooperative Highway Research Program, which is administered by the Transportation Research Board of the National Research Council.
DISCLAIMER This is an uncorrected draft as submitted by the research agency. The opinions and conclusions expressed or implied in the report are those of the research agency. They are not necessarily those of the Transportation Research Board, the National Research Council, the Federal Highway Administration, the American Association of State Highway and Transportation Officials, or the individual states participating in the National Highway Cooperative Research Program.
NCHRP 3-66 Interim Report
ii
December 2003
ABSTRACT This report presents the results of the first phase of the research project, which developed a new construct for traffic signal state transition using enhanced detector information. The report will form the basis of the phase two research.
NCHRP 3-66 Interim Report
iii
December 2003
ABSTRACT ......................................................................................................... iii 1 OVERVIEW OF THE REPORT .....................................................................1 2 REVIEW OF LITERATURE ...........................................................................7 2.1.1 Controller Features..........................................................................7 2.1.2 Traffic Signal Priority Concepts .....................................................10 2.1.3 Preemption ....................................................................................11 3 ASSESSMENT OF DETECTION TECHNOLOGY.......................................13 3.1 Introduction...........................................................................................13 3.2 Detection Definition ..............................................................................13 3.2.1 Conceptual Architecture ................................................................13 3.2.2 System Architecture ......................................................................14 3.3 Summary of current detection practices ...............................................15 3.3.1 Volume Density Control.................................................................16 3.3.1.1 Multiple detector inputs ..........................................................19 3.3.1.2 Possibility of a volume-density type detector..........................20 3.3.2 Dilemma zone protection...............................................................21 3.3.3 Simultaneous gap out procedures .................................................22 3.3.4 Extended detector modes..............................................................23 3.4 Summary of current and emerging detection technologies...................23 3.4.1 Pulse / Point Detection ..................................................................27 3.4.2 Presence detection........................................................................27 3.4.3 Stop bar counts .............................................................................28 3.4.4 Queue Estimation ..........................................................................29 3.4.5 Truck detection ..............................................................................31 3.5 Highway capacity issues.......................................................................31 3.5.1 Greenshields model.......................................................................31 3.5.2 Saturation Flow rate concept.........................................................32 3.5.3 Delay vs. cycle length....................................................................33 3.6 Flow rate issues....................................................................................35 3.6.1 Dilemma zones and flow regimes..................................................35 3.6.2 Flow regime identification ..............................................................35 3.6.3 Extended detector types................................................................35 4 SMART SENSOR APPROACH TO STATE TRANSITION ..........................36 4.1 Introduction...........................................................................................36 4.2 Proposed concepts for further development .........................................36 4.2.1 Concept 1: Improved lane by lane detection .................................37 4.2.2 Concept 2: Identify downstream capacity restrictions....................39 4.2.3 Concept 3: Identify local green split inefficiency problem ..............43 4.2.4 Concept 4: Identify unmet demand................................................50 4.2.5 Concept 5: Queue length estimation after preemption event.........52 4.2.6 Concept 6: Operating regime identification....................................53 4.3 Conclusions regarding six concepts .....................................................54 4.4 Evaluation Locations ............................................................................54 4.5 Data collection infrastructure ................................................................55 4.6 Evaluation Experiments ........................................................................57 4.6.1 Possible evaluation of Concept 1 ..................................................57
NCHRP 3-66 Interim Report
iv
December 2003
4.6.2 Possible experiments for evaluating Concept 2.............................58 4.6.3 Possible experiments for evaluating Concept 3.............................58 4.6.4 Possible Experiments for evaluating Concept 4 ............................60 5 ASSESSMENT OF THE HIGHWAY-RAIL INTERFACE..............................62 5.1 Introduction...........................................................................................62 5.2 Definitions Relating to the Highway-Rail Interface................................62 5.3 Preemption Background .......................................................................64 5.4 Issues to be Examined .........................................................................70 6 IMPROVEMENTS IN THE HIGHWAY-RAIL INTERFACE OPERATIONS ..71 6.1 Introduction...........................................................................................71 6.2 Available and Desired Information........................................................72 6.2.1 Traffic Controller / Scheduler Data ................................................72 6.2.1.1 Estimated Time to Preemption ...............................................72 6.2.1.2 Preempt Activation .................................................................72 6.2.1.3 Gate Down Confirmation (“Gate Down Relay”) ......................73 6.2.2 Evaluation Data .............................................................................73 6.2.2.1 Estimated Time to Crossing Activation...................................73 6.2.2.2 Crossing Activation (“Lights/Gates Operating”) ......................73 6.2.2.3 Island Activation (“Train at Crossing”) ....................................73 6.2.2.4 Gate Position Information.......................................................73 6.2.2.5 Traffic Control Track Clearance Phase State .........................73 6.2.3 Future Enhanced Data ..................................................................74 6.2.3.1 Estimated Train Length and Speed ........................................74 6.2.3.2 Train Classification .................................................................74 6.2.3.3 Train Routing and Movement Information ..............................74 6.3 Data Collection Methods.......................................................................74 6.3.1 Local Crossing Controller Interface ...............................................75 6.3.2 Remote Data Collection Stations...................................................76 6.3.3 Networked / Information Sharing ...................................................78 6.4 Data Distribution Method - IEEE 1570-2002.........................................78 6.4.1 Protocol Overview .........................................................................79 6.4.2 Architecture ...................................................................................79 6.4.3 Information Capabilities .................................................................81 6.4.3.1 Once-Per-Second Messages .................................................81 6.4.3.2 Unscheduled Messages .........................................................82 6.4.3.3 Poll-Response Messages.......................................................82 6.4.3.4 User Defined Message...........................................................82 6.5 Approach ..............................................................................................83 6.5.1 Initial Data Collection.....................................................................83 6.5.2 Processing of Raw Data ................................................................84 6.5.3 Scheduler Simulation Data Input Generation ................................85 6.5.4 Field Implementation .....................................................................86 7 ASSESSMENT OF ALTERNATIVE STATE TRANSITION LOGICS ...........87 7.1 Introduction...........................................................................................87 7.2 Goals ....................................................................................................87 7.3 Terminology..........................................................................................87
NCHRP 3-66 Interim Report
v
December 2003
7.3.1 Interval Structure ...........................................................................88 7.3.2 Interval Selection (within coordination) ..........................................88 7.3.3 Interval Duration ............................................................................88 7.3.4 Stage Based..................................................................................89 7.3.5 Free-form.......................................................................................90 7.4 MOVA (Microprocessor Optimized Vehicle Actuation)..........................91 7.5 VS-PLUS ..............................................................................................92 7.6 Conclusion............................................................................................95 8 AN ANALYTICAL FRAMEWORK FOR IMPROVED STATE TRANSITION LOGIC.................................................................................................................96 8.1 Introduction...........................................................................................96 8.2 Goals of the framework.........................................................................96 8.3 Overview of precedence graphs ...........................................................98 8.3.1 Coordination ................................................................................101 8.3.2 Overlaps ......................................................................................101 8.3.3 Preemption ..................................................................................102 8.3.4 Summary .....................................................................................103 8.4 Three-part structure of the priority request server ..............................104 8.4.1 Task/Activity Timing Parameters .................................................104 8.4.2 Real-time demand parameters ....................................................105 8.5 Precedence Network Model................................................................106 8.5.1 The priority scheduling process ...................................................106 8.5.1.1 Receive Service Request .....................................................107 8.5.1.2 Model as precedence network..............................................108 8.5.1.3 Evaluate alternatives ............................................................108 8.5.1.4 Implement Efficient Schedule ...............................................108 8.5.1.5 Recovery from service..........................................................108 8.5.1.6 Transition back to coordination.............................................109 8.5.1.7 Normal Operation .................................................................109 8.5.2 Context of evaluation of alternatives approach............................109 8.6 Mathematical description of precedence network approach ...............113 8.6.1 Phase Definition ..........................................................................113 8.6.2 Objectives: Meet a priority request ..............................................116 8.6.3 Coordination and Cycle Time ......................................................117 8.6.4 Multi-criteria Objective Function ..................................................118 8.6.5 Summary Problem Formulation ...................................................118 8.6.6 Issues and Extensions.................................................................119 8.7 Solution Methodology .........................................................................121 8.7.1 Computational Complexity analysis.............................................121 8.8 Example Application ...........................................................................123 8.8.1 Test Case Description .................................................................124 8.8.1.1 Preparing for Preemption .....................................................125 8.8.1.2 Recovery from preemption ...................................................127 8.9 Software Design .................................................................................129 8.9.1 Logical Architecture .....................................................................129 8.9.2 Logical architecture for the PRS ..................................................130
NCHRP 3-66 Interim Report
vi
December 2003
8.9.3 Physical architecture ...................................................................134 8.9.4 Documentation Methods – UML ..................................................135 8.9.4.1 State Transition Diagrams....................................................135 8.9.4.2 Sequence Diagram...............................................................136 8.9.4.3 Class Diagram......................................................................137 8.9.4.4 Activity Diagram ...................................................................138 9 LABORATORY EVALUATION...................................................................139 9.1 Introduction.........................................................................................139 9.2 Test Environment ...............................................................................140 9.3 Experiments........................................................................................141 9.4 RR Data Module Evaluation ...............................................................141 9.5 Scheduling Algorithm Module Evaluation ...........................................142 10 Project Schedule ....................................................................................143 11 Workshop ...............................................................................................144 Appendix A: Bibliography..................................................................................145 Appendix B: Extended Detector Modes ............................................................160 Appendix C: Indiana Test Locations .................................................................162 Appendix D: Traffic Signal Definitions...............................................................175 References .......................................................................................................184 Figure 1-1: Signal Controller Logic Structure ........................................................3 Figure 1-2: Ring-barrier-phase structure of a signal controller..............................3 Figure 3-1: Conceptual use and integration of sensor data ................................14 Figure 3-2: System architecture ..........................................................................15 Figure 3-3: Calling / Extending a phase ..............................................................16 Figure 3-4: Variable initial timing (1) ...................................................................17 Figure 3-5: Unequal lane utilization.....................................................................18 Figure 3-6: Gap reduction timing (1) ...................................................................19 Figure 3-7: Field condition / controller observation discrepancy .........................20 Figure 3-8: Volume-density type detector ...........................................................21 Figure 3-9: Phase extended to max out ..............................................................22 Figure 3-10: Inductive loop sensors ....................................................................24 Figure 3-11: Video detection systems.................................................................25 Figure 3-12: RTMS sensor installation................................................................26 Figure 3-13: SmartSensor installation.................................................................26 Figure 3-14: Typical detection zone ....................................................................27 Figure 3-15: Presence detection inefficiency (West Lafayette, IN 05/28/2003)...28 Figure 3-16: Counting concept with 6x6 series loop detectors............................29 Figure 3-17: Queue clearance time diagram.......................................................30 Figure 3-18: Greenshield’s diagrams ()...............................................................32 Figure 3-19: Queue discharge diagram ..............................................................33 Figure 3-20: Illustration of typical lost time in a cycle ..........................................34 Figure 3-21: Illustration of Efficiency vs. Cycle Length........................................34 Figure 4-1: Gap reduction timing changes ..........................................................39 Figure 4-2: Downstream flow constriction examples...........................................41 Figure 4-3: Local green inefficiency problem ......................................................44
NCHRP 3-66 Interim Report
vii
December 2003
Figure 4-4: Stadium & Northwestern timeline, end of saturation flow..................45 Figure 4-5: Stadium & Northwestern timeline comparison ..................................46 Figure 4-6: Split reduction to improve efficiency .................................................47 Figure 4-7: Underutilization of green time, reduction of split and cycle possible.48 Figure 4-8: Split extension for unmet demand ....................................................51 Figure 4-9: Reallocation of split times .................................................................52 Figure 4-10: Data collection architecture ............................................................55 Figure 4-11: Example Solo Pro screen captures ................................................56 Figure 4-12: Example Solo Pro data and flow profile ..........................................57 Figure 4-13: Hardware structure for identification of Concept 2..........................58 Figure 4-14: Hardware structure for identification of Concepts 3 and 4 ..............59 Figure 4-15: Quad view of West Lafayette site illustrating Concept 3 .................60 Figure 4-16: Quad view of West Lafayette site illustrating Concept 4 .................61 Figure 6-1: Local Crossing Controller Interface ..................................................75 Figure 6-2: Remote Data Collection Stations ......................................................77 Figure 6-3: Networked / Information Sharing ......................................................78 Figure 6-4: IEEE 1570 Protocol Architecture ......................................................80 Figure 7-1: Stage Based Sequence ....................................................................89 Figure 7-2: Primary Movement Based Sequence ...............................................90 Figure 7-3: Frame Signal Plan ............................................................................93 Figure 7-4: Priority class matrix...........................................................................94 Figure 7-5: Priority levels ....................................................................................94 Figure 8-1: Typical eight-phase ring-barrier diagram ..........................................98 Figure 8-2: Terminology of precedence graphs ..................................................99 Figure 8-3: Barriers and zero-time activities .....................................................100 Figure 8-4: Example precedence graph of single phase timing ........................100 Figure 8-5: Example precedence graph for coordination ..................................101 Figure 8-6: Precedence graph example of Overlap ..........................................102 Figure 8-7: Precedence graph example for preempt.........................................102 Figure 8-8: Three necessary components of the Priority Request Server Module ...................................................................................................................104 Figure 8-9: Illustration of Priority Request Server Process ...............................107 Figure 8-10: Hierarchy of alternatives evaluation approaches ..........................110 Figure 8-11: Alternative Min and Max Values ...................................................116 Figure 8-12: Illustration of the two phases of PRS planning for train preemption ...................................................................................................................124 Figure 8-13: case phase numbers and associated movements........................125 Figure 8-14: Test case ring-barrier phase sequence ........................................125 Figure 8-15: Test case preemption preparation policy ......................................126 Figure 8-16: Representation of normal preemption operation as a precedence network ......................................................................................................126 Figure 8-17: Improved preemption sequence with PRS....................................127 Figure 8-18: Typical preemption recovery sequence ........................................128 Figure 8-19: Alternative recovery precedence network.....................................129 Figure 8-20: Logical project architecture...........................................................130 Figure 8-21: PRS Software Architecture ...........................................................131
NCHRP 3-66 Interim Report
viii
December 2003
Figure 8-22: Evaluation Physical Architecture ..................................................135 Figure 8-23: Sample UML State Transition Diagram ........................................136 Figure 8-24: Sample UML Sequence Diagram .................................................137 Figure 8-25: Sample UML Class Diagram ........................................................138 Figure 8-26: Sample UML Activity Diagram ......................................................138 Figure 9-1: Architecture for testing and evaluation of algorithms using hardware in the loop simulation .................................................................................140 Figure 10-1: Phase 2 Schedules.......................................................................143 Figure C-1: West Lafayette Site location...........................................................162 Figure C-2: US 231 and Stadium Avenue site data ..........................................163 Figure C-3: US 231 and Stadium Avenue data collection site ..........................164 Figure C-4: US 231 and Stadium Avenue cabinets...........................................165 Figure C-5: Indoor test facility at West Lafayette ..............................................166 Figure C-6: Video overlay .................................................................................166 Figure C-7: Indoor equipment at West Lafayette ..............................................167 Figure C-8: Indoor signal status and cabinet ....................................................168 Figure C-9: Noblesville Site location .................................................................169 Figure C-10: IN 37 and 38 data collection site, aerial view ...............................169 Figure C-11: IN 37 and 38 stop bar detector plan .............................................170 Figure C-12: IN 37 and 38 phasing diagram .....................................................170 Figure C-13: IN 37 and 38 vehicle movements .................................................171 Figure C-14: Example IN 37 and 38 camera pictures .......................................171 Figure C-15: IN 37 and 38 existing cabinet.......................................................172 Figure C-16: Cabinet 1 – Cabinet 2 patch panel ...............................................172 Figure C-17: Northbound patch panel (rear view) .............................................173 Figure C-18: SR 37 and 38 data collection cabinet...........................................174 Table 3-1: Comparison of traditional and improved sensor data.........................14 Table 3-2: Variable initial increments ..................................................................17 Table 4-1: Example volume-density detector parameters...................................38 Table 4-2: Econolite phase timing table ()...........................................................39 Table 4-3: Detector mapping for count detectors ................................................42 Table 4-4: Termination during constant phase call with minimal flow .................43 Table 4-5: Configuration of parameters for v/c ratio estimation ..........................49 Table 4-6: Controller display of estimated measures of effectiveness ................50 Table 4-7: Reallocation of green time .................................................................50 Table 4-8: Estimated queue length display .........................................................53 Table 4-9: Operating regime options...................................................................54 Table B-1: Econolite Detector Settings (25)......................................................160 Table B-2: Eagle Detector Settings () ...............................................................161 Table B-3: Peek Detector Settings () ................................................................161
NCHRP 3-66 Interim Report
ix
December 2003
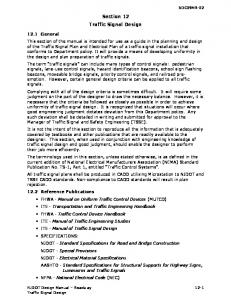
1 OVERVIEW OF THE REPORT Traffic signal state transition logic has changed little over the past 40 years. The basic approach to actuated traffic signal control has proven to be relatively effective and has found widespread use throughout the U.S. New sensor technologies and improved models of state dynamics make improvement in traffic signal state transition logic possible today. This project investigates approaches to improve state transition logic and integration of new sensor information into the traffic signal control problem. In the following interim report, we present the results of a detailed analysis of different approaches to state transition logic that are used in North America and other parts of the world (primarily Europe), we look at how traditional vehicle detector information is used within existing state transition logic and how new sensor information can be utilized to improve the operational performance, as well as how new sensor information can be used to improve operations in special circumstances such as critical intersection control and at the highway-rail interface. This interim report surveys different structures used as the fundamental state transition models. The North American ring-barrier-phase model and the European stage-based model are the two most widely accepted approaches. Each of these approaches offers interesting benefits including structural approaches to providing vehicle actuations, system coordination, and priority of rail, transit, and critical intersection control. Based on the review of the different approaches (Chapter 7), it was determined that future efforts in this research would utilize the North American ring-barrier-phase structure primarily because it utilizes concepts that are familiar to operating agencies while maintaining sufficient flexibility to accommodate better control concepts. Concepts from the other approaches may prove to be useful, but our assessment concluded that changing the fundamental structure did not offer any significant benefits. The components of the traffic signal state transition control logic can be represented as shown in Figure 1-1. The core of the logic, shown in the center of Figure 1-1, is the ring-barrier-phase component that provides the fundamental behavior of the traffic signal controller. The lower part of the figure shows the traditional and advanced surveillance systems that include the traditional call and extend detectors, the advanced rail information, and a traffic flow estimate component. These information components provide tactical inputs to the core component that reflect the demand of the transportation system on the core controller. The components at the top of the figure represent the strategic control components that provide coordination, preemption, and priority. Each of these components provides inputs to the core state transition logic for the purposes of meeting system, safety, and service-related demands on the core logic. The
NCHRP 3-66 Interim Report
1
December 2003
coordination component provides inputs to the core logic that help guide it through its state transitions to accommodate coordinated operation with other signals to form a system of controllers. The preemption component provides a critical safety component that allows the signal controller to provide safe operation at the highway-rail interface as well as to provide a high level of priority for emergency and other vehicles. The priority component is a relatively new construct that provides inputs to the coordinator and core logic that helps trade off requests for service from different classes of vehicle in different operational situations. For example, the traffic flow estimation information component may decide that there is one or more approaches to an intersection that require special considerations and may request that the strategic priority component provide inputs to the core logic that would increase the proportion of phase green time given to these critical movements (e.g. a form of critical intersection control). At the core of the state transition logic is the basic ring-barrier-phase component and is illustrated in Figure 1-2. Each ring is composed of a sequence of phases that, generally, are incompatible (in terms of the associated movement of traffic) hence only one of the phases in a ring can serve a traffic movement at a time. Figure 1-2 represents a controller with two rings with each ring having four phases. Rings are tied together through barriers that are placed between phases within a ring and across rings. The barriers are represented by the vertical lines labeled ‘a’ and ‘b’. North American signal manufacturers have implemented this basic model and have extended it to two rings with twelve phases, four rings with sixteen phases, and even twenty rings with forty phases. Regardless of the specific configuration, the primary behavior of the ring-barrier-phase construct is essentially the same.
NCHRP 3-66 Interim Report
2
December 2003
Priority Strategic Control
Coordination
Preemption
Advanced Rail Info Core State Transition Logic
Rings, Barriers, Phases, Intervals
Traditional Call/Extend Detection
Tactical Control
Traffic Flow Estimation
Figure 1-1: Signal Controller Logic Structure
Each phase is composed of several timing intervals including minimum green, pedestrian walk, flashing don’t walk, etc. Each ring times the intervals of one phase at a time. The length of each interval is determined by several factors that include configuration data (minimum green time, maximum time, extension time, minimum or maximum recall, walk, flashing don’t walk, and yellow clearance and red clearance, etc.), and data from detectors that either call for a phase or an interval of a phase (such as the pedestrian intervals), or extend a phase via vehicle actuations. This core component of the signal control logic provides the fundamental state transition behavior of a traffic signal controller. a
b
1
2
3
4
5
6
7
8
Figure 1-2: Ring-barrier-phase structure of a signal controller
NCHRP 3-66 Interim Report
3
December 2003
The other components shown in Figure 1-1 provide sensor and system information (the bottom third of the figure) and strategic operational guidance (the top third of the figure). The tactical components shown in the lower third of Figure 1-1 include the traditional Call-Extend detection that is used to provide vehicle actuated control. Chapter 3 provides an analysis of the operation of existing detectors and how they are used in the controller state transition logic. Typically, a phase will only be serviced if there is a call from a vehicle detector, or it is recalled by configuration, and will extend the green time for each vehicle detection that is observed. Figure 1-1 also shows two new traffic surveillance components: Advanced Rail Information and Traffic Flow Estimation. The Advanced Rail Information component represents surveillance information that is provided from the rail operations system and is being developed as the IEEE 1570 standard. This information includes the traditional railway track circuit call for traditional preemption as well as new information that includes an advanced application of preemption (additional time), speed, train length, and other rail operational information that might be useful in managing the highway-rail interaction. This information is covered in detail in Chapter 6. Since the traditional rail preemption logic is considered to be somewhat naïve and can be significantly disruptive to traffic operations, it is envisioned that this advanced information can be used to provide priority timing prior to the need for the preemption service. Hence, the Advanced Rail Information component will provide a request for service to the strategic priority control component in advance of needing to have the grade crossing gates begin to close the road. This advanced information will assist in providing more efficient and safer operation at the highway rail interface. The Advanced Rail Information component does not directly provide data to the core ring-barrier-phase logic. The Traffic Flow Estimation component is a new component identified in this research to address the potential benefits of additional sensor information. It is envisioned that this component will provide several different types of information and functions. One key function of the Traffic Flow Estimation component will be to provide a better assessment of the efficiency of phase green utilization so that phases can be called, extended, and terminated in a more effective manner. Chapter 3 presents the results of the analysis of how traditional detectors provide call and extend information and how traditional detector information can be utilized to compute other measures that could provide more efficient green utilization. Chapter 4 outlines six concepts to address the concept of flow-based phase call and extension behavior. The Traffic Flow Estimation component provides an assessment of congestion conditions and, if needed, requests priority, from the strategic priority component, for phases that might be over saturated or operating at degraded levels of performance. This component provides data to both the core logic and the higher level strategic control components.
NCHRP 3-66 Interim Report
4
December 2003
At the strategic control level, a key new component is the Priority component. As mentioned above, the Priority component provides phase timing inputs that help guide the core logic through special timing situations. The inputs to the Priority component are ‘requests for priority’ for a particular service, e.g. phase, at some time in the future. For example, the Traffic Flow Estimation component may request additional green time for one or more oversaturated phases, the Advanced Rail Information component might request service for an arriving train, a transit vehicle might request service for a bus or light rail vehicle. The function of the Priority component is to consider all of these requests and to provide inputs to the core logic that will help meet these different requests. It is envisioned that the Priority component will provide input to the coordination component, hence it is primarily attempting to provide coordination inputs that consider other factors, such as other traffic streams, which are not considered under traditional coordination. It is important to distinguish between a request for priority service and a preemption input. A preemption input is a very high level of priority that requires all other strategic considerations be disregarded and control is provided so that a train or other preemption vehicle can be served. Priority on the other hand is considered to be a lower level of priority and trade-offs among requests can be made to provide an overall better level of intersection performance. For example, if a transit request for priority and a critical intersection request, e.g. oversaturated phase request, are active, then the Priority component could provide an early green time for the transit vehicle, but not so early as to require the oversaturated phase be shortened. It is possible, and reasonable, that a transit vehicle might be slightly delayed in this condition – but could still receive some level of benefit from the priority treatment without significant disruption to other traffic streams. In Chapter 8 the Priority component is analyzed and presented as a scheduling problem. Consideration of the priority-timing problem as a scheduling problem provides an analytical framework for decision making that has been addressed in the operations research profession. Application to the traffic signal state transition problem is new and presents some issues that are discussed in Chapter 8. Throughout the analysis and development of the approach presented in this interim report, the researchers have considered field locations where the developments of these concepts could be deployed and tested. There are two field locations, which have been selected because of the capabilities that are available to the research project at virtually no cost. The Noblesville Indiana Site is a heavily instrumented site that will allow many of the tactical control improvements to be evaluated. An additional site near Purdue University will also be utilized for evaluation. The railroad field site is a location in Irving, Texas where heavily utilized arterials streets parallel and cross a heavy and commuter
NCHRP 3-66 Interim Report
5
December 2003
rail line. This location provides a good opportunity for improved critical intersection control as well as improved preemption treatment that considers both the pedestrian demands and the approaching train. The researchers have a good working relationship with both the city of Irving and the Trinity Railway Express, the rail operations agency, and believe that this location provides a good basis for addressing the needs of improved state transition logic. The approach presented in this interim report is to address the issues and needs of developing advanced state transition logic for traffic signal control in a comprehensive framework that utilizes advanced sensor capabilities, advances in modeling, optimization and control. Each of the following chapters provides details on the analysis and formulation of experiments and logic development within the framework of a traffic signal controller that should result in improvements that will be useful to traffic engineers and technicians in addressing the growing needs of traffic control. Because of the complexity of the issues and the extensive documentation, the report is very long. This chapter presents an overview of the entire report. As an aid to reading, each chapter has an introduction which summarizes the chapter. The reader may want to read all the introductions first, as a high level overview of the report, before delving into the details of the specific chapters.
NCHRP 3-66 Interim Report
6
December 2003
2 REVIEW OF LITERATURE The following highlights the literature that has some direct bearing on this project. A complete bibliography is attached as Appendix A, indicating all of the documents and research that the team is aware of in formulating its understanding of the issues and approaches taken by others. Additional literature is cited within key discussions throughout the report.
2.1.1 Controller Features The literature review utilized the TRIS database. including the number of hits(), is summarized below:
The keywords searched,
Traffic Control Decision (42) Control decision (102) Signal Logic (4) Phase transition (68) Signal phase (236) Signal State (23) Volume density (35) Detection sensor (39) After reviewing the search results, the following concepts were identified to be closely related to this research. Dynamic Split (1) Traffic controller vendors have implemented a concept known as “Dynamic split,” which takes allocated time from phases that are not utilizing it and gives it to a phase that needs it. If a phase gaps out two times in a row, it is placed on a candidate list of phases to lose time allocated to its split. If a phase is forced off twice in a row, it is placed on a candidate list of phases to receive extra time. After a phase gaps out twice in a row, it can lose one second, and an additional second for each successive gapout, down to its specified minimum green time. Each time a phase if forced off twice in a row, it can receive one extra second. For each successive force off, it can receive an additional second. Once a shortened phase begins to force off, it receives its reallocated time in one second increments, one second for each force off, from the extended phase. Conceptually, this is an interesting and potentially useful feature, however there is no theory behind the choice of one second increments or number of gapouts. This feature is reported to be available on the Eagle EPAC300.
NCHRP 3-66 Interim Report
7
December 2003
Alternate Maximum Green and Passage Times (1) This feature provides additional static max green times (up to 5 in some controllers) for the controller to utilize throughout the day, as opposed to the typical Max1 and Max2. The max times for this feature must be programmed, which requires a significant amount of historical data per intersection if the max times are to work properly. In addition, different passage times can be programmed for different time periods or weather conditions. Conceptually, this provides a Time-of-Day capability for changing either Max Time during free operation or passage times that may need to be either more or less aggressive. This feature is reported to be available on the Eagle EPAC300. Dynamic Max Green (1) With Dynamic Max Green, the max time must always fall between a specified maximum and minimum, but can be increased or decreased (by a specified increment) based upon successive max outs and gapouts, respectively. The Dynamic max results in many max outs during operation as the controller tries to fit the flow profile. This can place vehicles in the dilemma zone, as passage time is not guaranteed when max out occurs. This feature is reported to be available on the Eagle EPAC300 and Naztec 980 controllers. Flow Control Comparison (2) Using NETSIM, queue control, a strategy based upon minimizing lost efficiency (i.e. detectors are placed to provide efficient control, not for dilemma zone protection) and volume density control was compared at an isolated, under saturated intersection. The simulation was evaluated based upon average system delay and average system stops per vehicle. Volume-density control had a higher total average system delay as well as a higher average system stops per vehicle, although the difference on the latter was very small. Of import to this research was a short discussion regarding keeping the discharge at saturation flow, however this was based upon the clearance of a large detection zone to signify an end to saturation flow. Using an assumed vehicle speed of 20 mph, a 3.5 second gap was suggested as a good way to show that saturation flow had ended. This estimate erred on the cautious side to avoid truncating the phase because of a slow driver, placing most of the emphasis on safety and very little on efficiency. Adaptive Left Turn Phasing Adaptive left turn phasing addresses the need for a protected left turn phase during some periods and a permissive left turn phase during other periods. The addition of a protected left turn phase at an intersection is generally based upon the demand during peak periods of traffic flow. Although this protected movement may be necessary for safety and
NCHRP 3-66 Interim Report
8
December 2003
efficiency during the peak period, it is often unnecessary during other parts of the day, which experience less left-turn demand and/or larger gaps in opposing through traffic. Traffic engineers often overcome this by omitting the left-turn phase during certain time of day plans. However, typical traffic signal controllers are unable to determine whether a protected left-turn phase is necessary based upon real-time traffic conditions. In response to this limitation, researchers at the Texas Transportation Institute have developed an adaptive left-turn algorithm. The routine is designed to measure inputs from sensors and 1) determine if there are adequate gaps in the opposing through traffic and 2) determine if there is adequate left turning volume to justify a protected turn phase. This adaptive left-turn control strategy has been implemented in Eagle Signal’s EPAC 300 controller (3). Each of the concepts described can have a positive impact on field operations, if implemented properly, however there is room for improvement. For example, while Dynamic Split Times (1) do allow the controller a degree of flexibility when varying flow rates are encountered, they lack the ability to adjust quickly as they are limited by small incremental changes. Also, because the change in split times are based on successive controller force offs, split times may not reduce until traffic volumes are well below saturation flow, which is not a desirable situation. Alternate Max Green and Passage times (1) can improve the operation of an intersection, however they require substantial knowledge of traffic flow patterns for successful implementation. As these are values programmed into the controller, they are also unable to adjust to unexpected changes in the field, unless explicit Time-of-Day logic is included. Dynamic Max Green times suffer from the same issues that affect Dynamic Split Times. These issues include: • Ability to adjust quickly to changing conditions is limited by small incremental changes • Split times are supposed to be changed at times when volume is well below saturation flow, as change is based upon controller max out In addition to these issues, Dynamic Max Green times also suffer from the issue of excessive phase max out. By trying to fit the max green time closely to the expected traffic volume, there is a greater likelihood of max out than with other control schemes. During max out, any dilemma zone protection is nullified as the controller cannot extend the green time when it maxes out. Adaptive Protected – Permissive Left Turn Control is a useful feature, providing that the detection hardware is in place to provide the controller with an accurate depiction of the traffic conditions required to make such a decision (1).
NCHRP 3-66 Interim Report
9
December 2003
The fundamentals of several of these algorithms can be traced to the notion of saturation flow rates. • Dynamic Split and Dynamic Maximum Green Time seek to adjust the green split based upon occupancy. This approach is not as robust as this team desires, as occupancy is not directly related to flow rate. • Adaptive Protected-Permissive Left turn seeks to omit the left turn phase when there is sufficient capacity to clear the left turn queue. However, the left turn flow rate and capacity are not explicitly sensed. • Kruger et al. has a stated objective of maintaining a near optimal flow rate, however the proposed approach using detectors and large gap times (3.5s) is quite inefficient (4).
2.1.2 Traffic Signal Priority Concepts The emergence of Intelligent Transportation Systems (ITS) and improved detection methods has resulted in much interest and research in the concept of traffic signal priority. The ability to give preferential treatment to one type of system user over another user allows signal controllers to service competing needs in the order of relative importance. Traffic signal priority has been widely implemented for emergency vehicles for many years. Emergency vehicle priority can be implemented on a route-long basis or intersection-by-intersection (5). The benefit provided to these timecritical emergency services has been significant. More recent applications of traffic signal priority have sought to provide benefit to transit vehicles. Providing transit vehicles with priority can result in a reduction in delay and overall travel time. Recent research, including TCRP A-16: Improved Traffic Signal Priority for Transit, has explored enhanced algorithms for providing transit signal priority (6). Balke also developed and laboratory tested a priority algorithm for buses at signalized intersections with promising results (7). Although the majority of the applications of traffic signal priority have been for emergency vehicles and transit, the concept could easily be expanded to provide more efficient operation for a wide range of system users. One promising application of priority is for large trucks. Although research in this area has been limited, some initial research has shown potential for advancement of the concept. A report prepared for the Minnesota DOT (Mn/DOT) evaluated the benefit of providing truck detectors at signalized intersections (8). This report evaluated the benefit of providing additional detectors further upstream of typical detectors, which would detect only trucks. Actuation of these detectors by a truck would result in an additional, fixed green-extension time. Simulation of this concept revealed that the number of trucks stopping at a signal could be expected to be reduced from 25 to 15 percent.
NCHRP 3-66 Interim Report
10
December 2003
While the Mn/DOT report documented the benefits of providing an additional, fixed green-extension time for truck priority, it did not address possible algorithms for providing enhanced controller logic to accommodate varying truck speeds. Sunkari et. al (9) researched the feasibility of developing an enhanced priority algorithm for trucks. This algorithm allows for a variable green-extension time based on the truck speed. The concept was field tested and found to produce favorable results. However, the need for separate truck sensors was found to be expensive and redundant.
2.1.3 Preemption Although preemption is used for a number of applications including fire trucks, we will focus on railroad preemption. Railroad preemption is the application to be used in this project and is more complex than fire preemption. Preemption at highway-rail grade crossings is a critical, but often misunderstood process. Historically, the collaboration between highway and railroad agencies has been minimal. The Fox River Grove incident (10) in which a school bus was struck by a train and seven students were killed, shed light on the need for more collaboration between highway and railroad agencies and personnel. A review of the Fox River Grove incident by the National Transportation Safety Board (NTSB) stated that, “A primary component of the communication issue in this accident was the misunderstanding of the operation of the railroad and highway signal systems by personnel responsible for their design, operation and maintenance.” (10, p. 54) Interconnection Preemption is achieved through communication between the railroad warning devices and the traffic signal controller. The physical connection that allows this communication process is referred to as interconnection. Historically, interconnection has been achieved by connecting the railroad warning device to the traffic signal controller with wires and providing a normally energized circuit. When a train is approaching a grade crossing, the railroad warning device deenergizes the circuit, which sends a message to the traffic signal controller to begin the preemption sequence. This system is considered “fail-safe” because if the wires are cut or the connection is lost for any reason, the circuit de-energizes, thereby beginning the preemption sequence. Although this is considered a “fail-safe” process, Mansel et al. (11) describe the consequences such a system may have on efficiency and even safety should a problem occur with the interconnection circuit. Part VIII of the 1996 Manual on Uniform Traffic Control Devices (MUTCD) restated the specifications for railroad interconnection in an effort to address these problems (12). The restatement specifies that railroad interconnection circuits should be
NCHRP 3-66 Interim Report
11
December 2003
either closed circuit or of the supervised type. Supervised circuits allow the traffic signal controller to distinguish between a broken circuit and an open circuit due to an approaching train. In the case of a broken circuit, the controller can take an alternative course of action, such as placing the intersection in all-way red flash. This action ensures that vehicles stored on the track can safely clear while also alerting local officials to a problem at the intersection. Preemption Modes A key aspect of the interaction between the railroad and traffic signals is train arrival information. There must be some mechanism in place to give notice to the traffic signal controller of an approaching train. This mechanism is known as interconnection and is intended to provide the signal controller with notice of the arrival of a train. This event is known as preemption. The provision of preemption is intended to allow the traffic controller to transition from whatever phase it currently is serving, to the track clearance phase. There are two types of preemption, simultaneous and advanced. Simultaneous activates the lights (and gates if present) at the same time the controller is notified of the preemption. Advanced preemption notifies the traffic signal prior to the activation of the lights in order to provide more time for the traffic signal to transition (called right of way transfer) to the track clearance phase The minimum warning time is defined as 20s by the Manual on Uniform Traffic Control Devices (MUTCD) (13). However, the manual does not establish a maximum. Therefore, the amount of warning time can vary significantly according to the location and operating agency. Operations Issues In addition to the issue of variability in preemption times, is the variability of the traffic signal controller right of way transfer time. This can result in the traffic signal reaching track clearance earlier than the design case. If the track clearance is completed before the lights are activated (can only occur with advanced preemption), a condition know as the preempt trap can occur. Another issue involves recovery from preemption, which is treated in most controllers as a resynchronization event. Bullock et al. (14) identified and demonstrated the magnitude of the recovery problems as a significant disruption to traffic, depending on the nature of the recovery. Long (15) demonstrated the complexities of the vehicle performance during track clearance. Again, the time required for track clearance can be highly variable, implying an improved control system would be advantageous.
NCHRP 3-66 Interim Report
12
December 2003
3 ASSESSMENT OF DETECTION TECHNOLOGY 3.1 Introduction This chapter leads with a discussion on the conceptual integration of sensor data we envision for both traditional and improved sensor data. The proposed integration is based upon emerging or established IEEE and NTCIP standards. Once the framework for integrating sensor data is defined, the chapter leads the reader through current practices (stop bar and volume density) for deploying standard vehicle detection technology (train detection technology is discussed in Chapter 5). Various inefficiencies in current practice are illustrated by examples. This discussion on the inefficiencies of current practice leads into a review of emerging detection technologies that can provide lane-by-lane flow rate estimates. Using Greenshield’s flow density diagrams and the Highway Capacity Manual’s concept of saturation flow rate, a case is made for using the improved flow rate estimates to determine if a phase is truly operating efficiently, or if it is being “dragged” out by a moderate, but sub optimal flow rate. This discussion lays the technical background for the tactical control concepts proposed in Chapter 4 and phase duration estimates required for the strategic scheduling algorithm discussion in Chapter 8. 3.2 Detection Definition Detection can be defined as the use of a sensor to determine the presence of some type of user classes. Typical user classes include pedestrians, bikes, passenger vehicles, heavy vehicles, buses, emergency vehicles, and trains.
3.2.1 Conceptual Architecture Figure 3-1 and Table 3-1 detail how our proposed architecture fits into the current signal control practice. In Figure 3-1, the priority of each request increases as one moves up the figure, as is shown on the left side. On the right side, the expected integration of improved data with current practice is shown (new railroad and detection information). In Table 3-1, that contribution is shown in more detail. Current practice is shown in the first two columns, NEMA TS-2 and Typical NEMA Controller. Emerging Research, along with NCHRP 3-66’s proposed contribution, is shown in the other two columns. An “A” or an “R” in a cell indicates an Actuation or a Request, and signifies that this is part of traditional practice. An “I” in a cell indicates a class that will use improved sensor data. The subscripts identify the type of improved sensor data.
NCHRP 3-66 Interim Report
13
December 2003
Present
Future
Preemption* Priority
Request
Coordination
Plan Actuations
Local Control
NCHRP 3-66
Increasing Priority
Request
IEEE 1570
New RR Data
Improved Sensor Data * Not project
changed
by
Pedestrian Bike Vehicle Heavy Vehicle Bus Emergency Vehicle Train
A A
A A A
R
R
R
R
Legend A Traditional presence / pulse Iv Improved sensor data (vehicle) Improved sensor data (heavy Ihv vehicle) Ir Improved sensor data (railroad) R Priority / preemption request
A A, Iv A
R
NCHRP 3-66
Emerging Research
Typical NEMA Controller
NEMA TS-2 Standard
Figure 3-1: Conceptual use and integration of sensor data
Ihv
A R
R, Ir
Table 3-1: Comparison of traditional and improved sensor data
3.2.2 System Architecture Figure 3-2 illustrates the data flow architecture that is proposed by the team for possible field installation. Regarding Figure 3-2, • The IEEE 1570 objects correspond to the ‘Ir’ entries in Table 3-1 and will be described in subsequent chapters. • The new NTCIP 1202 & 1211 (Actuated Signal Control and Signal Control and Prioritization objects) will describe new data objects (Iv and perhaps Ihvshown in Table 3-1) that will provide the controller with more detailed assessment information about different classes, and priority levels, of vehicles. Subsequent sections in this chapter will provide the theory and rationale of this philosophy.
NCHRP 3-66 Interim Report
14
December 2003
Critical Intersection Control Algorithm
Field Intersection
NT 12 CI 1 P O 1 w 120 bje / N 2 ct s ew &
NTCIP 1211
Other PRG
a vi 0 7 l 15 oco or EE rot lat IE p ans tr
Priority Request Server
NTCIP 1202 & 1211 w/ New Objects
Traffic Signal Controller
RR PRG
Figure 3-2: System architecture
3.3 Summary of current detection practices Whether it’s through video, inductive loop, or side fire radar, current detection practice relies on a contact closure to provide information to the controller. Typically, a vehicle’s presence is relayed to an actuated controller through a stop bar detection zone and corresponding detection technology. The phase is then called, and the standing queue is discharged. If the time required to discharge the queue is greater than the minimum green interval programmed for that phase, the phase is extended, as shown in Figure 3-3. Depending on traffic volume, the phase will either gapout (Figure 3-3a) or continue to max out (Figure 3-3b), at which point the controller will serve the next phase. In the case of a coordinated system, the controller may also reach its maximum split, a situation, which is analogous to maxing out.
NCHRP 3-66 Interim Report
15
December 2003
a) Calling / Extending a phase until gapout
b) Calling / Extending a phase until max out Figure 3-3: Calling / Extending a phase
These contact closures can be used for more advanced detection, such as dilemma zone protection or bike detection, in addition to traditional call and extend. 3.3.1 Volume Density Control Volume-density control has two features, variable initial timing and gap reduction timing (1).
NCHRP 3-66 Interim Report
16
December 2003
Variable Initial Timing With variable initial timing, the initial green time on a phase can vary between a specified minimum and a specified maximum. When one vehicle passes over the detector (during yellow and red), the phase is assured to be serviced with its minimum green time. For each successive vehicle (including the first one) that passes over the detector, a specified increment is added to the green time (starting from 0 for vehicle one, not starting from the minimum green time). If the total number of vehicles times the increment is greater than the minimum, then that time period is used for the minimum, up to the specified maximum. Figure 3-4 shows a graphical representation of this concept.
Figure 3-4: Variable initial timing (1)
This feature works best with setback detectors because they historically provide the most accurate count of the number of vehicles that have arrived on that approach. Different increments are used depending upon the number of lanes served by the approach. Table 3-2 shows typical variable initial increments. Number of Lanes Increment (s)
1
2
3
4
2.4
1.2
0.8
0.6
Table 3-2: Variable initial increments
This method of incremental timing works well, based upon the assumption that traffic utilizes each of the provided lanes equally. However, when the lane utilization is not equal, as shown in Figure 3-5, this can become problematic. In
NCHRP 3-66 Interim Report
17
December 2003
the example shown in Figure 3-5, 9.6 seconds of green time would be provided , based upon the 12 vehicles shown in Figure 3-5 and 0.8 seconds allotted per vehicle (Table 4-1). However, assuming 2 seconds per vehicle for vehicles in the through and right lane, a minimum of 12 seconds would be required because the vehicles are not equally distributed across all three lanes.
1
2
3
Figure 3-5: Unequal lane utilization
Gap Reduction Timing In gap reduction timing, after a specified period of time (or number of vehicles), the minimum gap time is reduced (linearly) from the passage time to a minimum gap time. Figure 3-6 shows a graphical representation of this concept.
NCHRP 3-66 Interim Report
18
December 2003
Figure 3-6: Gap reduction timing (1)
Gap reduction timing can be used at critical intersections to clear the standing queue and provide snappy termination; reducing time spent servicing traffic volumes below saturation. An issue does arise in that after the controller has gapped out, vehicles arriving may be placed in the dilemma zone, as the minimum gap is often less than the passage time from the detector to the stop bar. One significant problem with volume density is selecting the appropriate allowable gap for a multiple lane approach. Volume density is available in all major controllers. 3.3.1.1 Multiple detector inputs Volume density control may work well on single lane approaches, but its operation on multi-lane approaches is not well understood from both a design and operations perspective. For example, detection on multi-lane approaches must be tied to the controller on a per phase basis. In the situation where a phase has three through lanes, detection on all three lanes will be tied back to the controller through one lead in cable. If one vehicle pulls into the detection zone in Lane 1, the controller observes a call on the phase, without regard to the lane. This situation is shown in Figure 3-7.
NCHRP 3-66 Interim Report
19
December 2003
a) Actual field condition
b) Controller observed field condition
Figure 3-7: Field condition / controller observation discrepancy
With all three lanes tied together, it is not possible to provide the controller with an accurate lane count or reflection of actual gap times. Therefore, initial green estimates and gap times do not reflect the needs of individual lanes. 3.3.1.2 Possibility of a volume-density type detector With advances in detection technology, the possibility exists to develop a true volume density detector, one that is not phase based, as current volume density timing is. Figure 3-8 illustrates this operating concept.
NCHRP 3-66 Interim Report
20
December 2003
L1 L2 L3 L4 L5 L6 Figure 3-8: Volume-density type detector
Under this operating concept, each lane would have its own detector with volume density parameters. After each volume density detector gapped out, each individual detector would not be permitted to extend the phase until after the phase had terminated.
3.3.2 Dilemma zone protection Dilemma zone protection can be provided through judicious placement of detectors along a subject approach. However, there are issues with this protection. Dilemma zone detectors are specifically placed based upon the design speed of the subject approach. If this speed is changed, then the detectors must be reinstalled to accommodate for this change. In addition, there are times when dilemma zone protection cannot be provided, such as when a phase maxes out or forces off. This may happen under two different scenarios. • A phase is dragged out by ping-pong effect of vehicle arrivals (Figure 3-9a). • A phase is truly saturated and must max out (Figure 3-9b).
NCHRP 3-66 Interim Report
21
December 2003
Vehicle Arrivals Time (s)
4
6
8
10
12
14
16
18
20
Lane 1 Lane 2
Vehicle Extensions (2.5s ea)
Arrivals
2
Max Time
Max out
Time a) Undersaturated phase extended to max out
Vehicle Arrivals Time (s)
4
6
8
10
12
14
16
18
20
Lane 1 Lane 2
Vehicle Extensions (2.5s ea)
Arrivals
2
Max Time
Max out
Time b) Saturated phase extended to max out Figure 3-9: Phase extended to max out
In either of these cases, dilemma zone protection can not be extended to either approach.
3.3.3 Simultaneous gap out procedures In actuated control, it is common to link phases 2 and 6, and sometimes phases 4 and 8 for gapout purposes. If this were not done, vehicles may be placed in the dilemma zone. For example, without simultaneous gapout, if Phase 2 were to gapout before Phase 6, Phases 2 and 6 would go into clearance as soon as NCHRP 3-66 Interim Report
22
December 2003
Phase 6 gapped out, regardless of any new vehicles detected on the Phase 2 approach. With simultaneous gapout enabled, new vehicles on the Phase 2 approach could extend Phase 2, even though it had previously gapped out. This results in a situation where modest traffic may in fact force a max out condition and create a dilemma zone problem for both approaches instead of mitigating the dilemma zone problem for one approach.
3.3.4 Extended detector modes Table B-1, Table B-2, and Table B-3 in Appendix B detail extended detection options available from three different controller manufacturers, Econolite, Eagle, and Peek. This information is taken from each respective controller manual. While the terminology may differ from manufacturer to manufacturer, each controller provides similar detection options. The key point to be taken from these tables is that there are, to a certain extent, some selected detector features that provide a mechanism for gathering lane-by-lane information. The following section will put this lane-by-lane information in the context of saturation flow rate, based upon concepts found in the Highway Capacity Manual. In addition, it will be explained how new NTCIP 1201 and 1211 objects may need to be developed to comprehensively represent this information in a structure that will permit good decision making based upon lane flow rate information, not phase gap times. 3.4 Summary of current and emerging detection technologies Figure 3-10, Figure 3-11, Figure 3-12, and Figure 3-13 show the most widely used detection technologies. Figure 3-10 shows three different types of inductive loop sensors: MicroLoops, preformed loops, and inductive loops. Figure 3-11 shows the camera and interface screens for three separate video detection manufacturers. Figure 3-12 details the hardware and setup required for a typical RTMS side fire microwave detection installation, while Figure 3-13 shows a schematic of and the user interface for a SmartSensor installation. RTMS and SmartSensor are both side fire radar detection systems. The side fire radar systems do not currently operate well as stop bar detectors, but could provide flow rate information if installed on the downstream leg of an intersection.
NCHRP 3-66 Interim Report
23
December 2003
a) 3M MicroLoop sensor
b) Preformed loop detector
c) Inductive loop detector Figure 3-10: Inductive loop sensors
NCHRP 3-66 Interim Report
24
December 2003
b) Iteris video detection system 2
a) Iteris video detection system 1
c) Autoscope video detection system 1
d) Autoscope video detection system 2
e) Peek video detection system 1
f) Peek video detection system 2
Figure 3-11: Video detection systems
NCHRP 3-66 Interim Report
25
December 2003
a) Example deployment
b) Sensor detail
c) RTMS interface card
d) Configuration of detection zone
Figure 3-12: RTMS sensor installation
a) SmartSensor schematic
b) SmartSensor user interface
Figure 3-13: SmartSensor installation
All of these detection technologies provide either a pulse or presence output.
NCHRP 3-66 Interim Report
26
December 2003
3.4.1 Pulse / Point Detection Pulse detection is the earliest detection concept, providing only a brief contact closure when a vehicle passes over the detection zone. Pulse detection is point detection, if it is to be used for vehicle detection at an intersection, it requires 100% accurate vehicle count as well as assignment to the proper interval (red or green) to ensure that no vehicles are overlooked or counted during the wrong interval. Originally, pulse detection was accomplished with mechanical treadle bars, but as technology advanced, inductive loops, video detection, and side fire microwave detectors now accomplish the task. Microwave technology (16,17) has the potential to provide good flow rate information, however the performance of these detectors tends to degrade as vehicle speeds fall below 10 mph.
3.4.2 Presence detection With presence detection, a call is placed for the duration of time that the vehicle occupies the detector, as opposed to a short 100ms blip as in pulse detection. This results in much safer operation, as it is much less likely that a vehicle will be missed, but the operation is inherently more inefficient. In addition, queue detection is challenging with presence detection because of ‘off by one’ errors. Small errors will compound as the controller proceeds through cycle after cycle, creating a distorted view of the queue length. Figure 3-14 shows a typical detection zone. In this zone, each detector is 6 foot diameter with a 15 foot spacing center to center, resulting in a 51 foot detection zone. The exact layout and geometry may vary by jurisdiction, but an approximate 50’ presence detection zone is typical.
Figure 3-14: Typical detection zone
By using such a large detection zone, the controller does not know how many vehicles are in the detection zone. This inefficiency increases when detection for
NCHRP 3-66 Interim Report
27
December 2003
several lanes of the same movement is tied to a single detector input. Figure 3-15 illustrates this inefficiency. t0
tes = 13.0s
Saturation Flow
Phase should have terminated
t = 18.7s
tmax = 36s
L2 L1 L2
Max out
L1 L1 L1 L1 L1 L1 L1 L1 L2 L2 L1
Figure 3-15: Presence detection inefficiency (West Lafayette, IN 05/28/2003)
Figure 3-15 is taken from actual field data at an intersection in West Lafayette, IN. This took place on a two lane approach where detection in each lane is tied to the controller via one lead in cable, as described in Section 3.3.1. Green begins at t0 with a short period of saturation flow. Saturation flow ends at tes. After this point, the phase is extended repeatedly by calls in each lane, stringing the phase out while flow is well below saturation. This continues until the phase maxes out, resulting in a long inefficient green interval. The total time elapsed during this green interval was 36 seconds, but only 17 vehicles passed the stop bar. Based on the demand of 17 vehicles per cycle for a two-lane approach and a relatively conservative saturation headway of 2.2s/veh, only 18.7s would be needed to service these vehicles. Had this phase been terminated when flow dropped below saturation, up to 17.1s could have been allocated to another phase.
3.4.3 Stop bar counts Advances in detection technology have made count detection possible through stop bar and presence detection. Video detection accomplishes this through an algorithm that analyzes pixel changes from a video feed while inductive loops accomplish this by analyzing the inductive signature of vehicles passing over the loops. Figure 3-16 shows an example count loop signature from an inductive loop count detector. The detection zone (Figure 3-16a) that produced this signature (Figure 3-16b) contained three separate loops, shown by the three separate peaks on the graph.
NCHRP 3-66 Interim Report
28
December 2003
a) Loop geometry
b) Count detector signature
Figure 3-16: Counting concept with 6x6 series loop detectors
The availability of count data via presence detection has several benefits. First, it produces count data while maintaining the safety of presence detection. Second, it can provide a real time quantitative flow rate. This flow rate can be compared with an optimal flow rate for a subject intersection to compute efficiency, or it can be used to create a historical profile to determine external factors such as weather or incidents are reducing capacity. 3.4.4 Queue Estimation Queue estimation is an important concept, as reliable queue estimation can be valuable for an efficient return to normal operations after a preemption event. Technology has not been able to provide a reliable queue estimate yet, although video detection may be on the verge. A surrogate for queue estimation is the use of short-term historical counts and short-term historical lane capacities to estimate arrival and service rates, respectively. Figure 3-17 illustrates the queue diagram when there is a flow interruption, such as train preemption or a red indication.
NCHRP 3-66 Interim Report
29
December 2003
=
l
Serv er R ate =
Maximum Queue
Vehicles
te a R al v i r Ar
m
Total Delay = area
Server Rate = 0 tr
tqc Time
Figure 3-17: Queue clearance time diagram
Equation 3-1 shows the total queue clearance time (tqc) for a red light, Equation 3-2 shows the calculation for the length of the green indication, and Equation 3-3 shows the total delay caused by the red light. t qc = t r (
λ
µ −λ
where
)
Equation 3-1
tqc = Queue clearance time tr = Time of red indication / preemption µ = Discharge rate λ = Arrival rate
g i = S i * C − Yi − Ri Equation 3-2 where gi = Length of green indication for movement i. Si = Split percentage for movement i. C = Cycle length Yi = Length of yellow indication for movement i. Ri = Length of all red indication following movement i. (C − gi ) 2 λi µi delay = 2( µi − λi )
Equation 3-3
As can be seen, as cycle length increases, delay will increase as a second order function. It is apparent that keeping the cycle length as short as possible is an important aspect of delay reduction. Subsequent sections will discuss how
NCHRP 3-66 Interim Report
30
December 2003
improved detection data will be able to reduce split times, which in turn reduce cycle length, and hence delay.
3.4.5 Truck detection In recent years, some work has been done in the area of truck detection. The goal of this research is to reduce the number of times a heavy vehicle is stopped as the first vehicle in a queue. By reducing this occurrence, a safety hazard can be avoided, as trucks typically require much longer distances to stop than cars, and efficiency can be improved, as the start up time for a truck is much longer than that of other vehicle classes. This detection has been accomplished in several different ways. In one research study, speed traps were used to measure the lengths and speeds of vehicles approaching a signalized intersection. Dilemma zone protection was extended to all vehicles, however longer vehicles received additional passage time (18,9). In a separate research study, two detectors were placed a specified distance apart on an approach and, using AND Boolean logic, a truck was detected to be straddling the trap when both loops were on (8). 3.5 Highway capacity issues The following section will relate possible detection data items discussed earlier to standard concepts in highway capacity (19).
3.5.1 Greenshield’s model Equation 3-4 and Equation 3-5 show Greenshield’s equations, a model which relates vehicle speed, density, and flow (20,21). k u = u f (1 − ) Equation 3-4 kj k q = u f k (1 − ) Equation 3-5 kj where u = Speed uf = Free flow speed k = Density kj = Jam density q = Flow rate
NCHRP 3-66 Interim Report
31
December 2003
1
a) Speed-density diagram
b) Flow-density diagram
c) Speed-flow diagram Figure 3-18: Greenshield’s diagrams (22)
Figure 3-18 shows the diagrams derived from Greenshield’s equation. Point 1 in Figure 3-18b is the most efficient point Flow-density curve. This point corresponds to the saturation flow rate and has a typical value around 1800 to 1900 passenger cars per lane per hour (pcplph). Average headway can computed using Equation 3-6. _ 3600 h= Equation 3-6 q where
_
h = Average headway q = Flow rate
Based upon this headway, we would expected detector pulses on the order of every 1.89 to 2.0 seconds when a lane is flowing near capacity.
3.5.2 Saturation Flow rate concept Since a standing queue discharges near capacity, an established principle of signal design is to discharge the standing queue and move to the next phase. Figure 3-19 shows the relation of queue discharge at saturation flow to the effective green interval.
NCHRP 3-66 Interim Report
32
December 2003
a) Completely saturated discharge (23) Undersaturated Flow
Rate of Discharge
Saturated Flow
Red
Green
Yellow
Red
b) Partially saturated discharge Figure 3-19: Queue discharge diagram
Figure 3-19a shows a phase that is saturated and likely could benefit from additional green time. Figure 3-19b shows a phase that has a significant portion of green time allocated to a sub-optimal flow rate.
3.5.3 Delay vs. cycle length Typically, as volumes increase at an intersection, it is common practice to extend the cycle length to provide longer splits and to minimize lost green time. Although some modest increase in capacity may be realized, this lengthening of the cycle length actually increases overall delay, as shown in Equation 3-3. In addition, excessive queues resulting from longer cycle lengths may block adjacent movements. Figure 3-20 illustrates the typical lost time in a cycle. NCHRP 3-66 Interim Report
33
December 2003
Figure 3-21 is a plot showing the efficiency of a traffic signal versus cycle length, assuming 16s and 20s lost time per cycle. Equation 3-7 shows the efficiency calculation.
Efficiency =
CycleLength − LostTime CycleLength
Equation 3-7
Figure 3-20: Illustration of typical lost time in a cycle
Efficiency vs. Cycle Length 1 0.9 0.8 0.7
Efficiency
0.6 0.5 0.4 0.3 0.2 0.1 0 0
50
100
150
200
250
300
Cycle Length Efficiency (16s lost time)
Efficiency (20s lost time)
Figure 3-21: Illustration of Efficiency vs. Cycle Length
NCHRP 3-66 Interim Report
34
December 2003
As can be seen in Figure 3-21, efficiency does increase with short cycle lengths, however as cycle length increases, incremental increases result in smaller and smaller efficiency increases. 3.6
Flow rate issues
3.6.1 Dilemma zones and flow regimes While dilemma zone protection is an important safety feature of an intersection, there is no consensus on the assumptions required to implement this protection (24). However, it is clear that in certain flow regimes, dilemma zone protection is not warranted. During undersaturated conditions, it is feasible to provide dilemma zone protection. As flow rates increase and the intersection approaches saturation, phases begin to max out or force off. When this occurs, dilemma zone protection is not possible.
3.6.2 Flow regime identification Under saturated conditions, it is extremely important to squeeze as much capacity out of the intersection as possible. The degree of saturation can be assessed by measuring the discharge flow rate on a lane-by-lane basis. As discharge rates for all critical movements approach calculated capacity, gap times should be aggressively reduced.
3.6.3 Extended detector types As shown in Table B-1, Table B-2, and Table B-3, several manufacturers package extended detector functions with their hardware. These types allow the user to implement more efficient transition logic with existing hardware.
NCHRP 3-66 Interim Report
35
December 2003
4 SMART SENSOR APPROACH TO STATE TRANSITION 4.1
Introduction
Expanding upon the discussion in Chapter 3, this Chapter details six concepts for more efficiently handling state transition logic using improved flow rate detection procedures. The first concept discusses how detectors should be assigned so individual lane flow rates can be evaluated. The second concept discusses a tactical algorithm for early terminating a scheduled phase when a downstream blockage has occurred. The third and fourth concepts discuss how phases with either excess or insufficient split times can be identified. Once identified, requests for revised splits times can be submitted to the scheduling logic. Concept 5discusses how the flow rate detection technology could be used to estimate the length of queues formed during long preemption events. Such information would be valuable to the scheduler so that appropriate split times could be scheduled immediately after exiting preemption. Concept 6 proposes a local traffic responsive procedure for determining how aggressively the controller should terminate phases as an intersection becomes more saturated. Following the explanation of these six concepts, the first four concepts are identified as candidates for experimental evaluation using instrumented intersections in West Lafayette, IN and Noblesville, IN. Details for collecting data and details of the proposed experiments are described at the end of the Chapter. 4.2 Proposed concepts for further development Chapter 16 of the Highway Capacity Manual defines the v/c ratio, where v is the volume utilizing a specific movement and c is the capacity of that movement, given certain signal timing conditions (19). Our approach proposes to estimate these parameters (v and c) in real-time to identify: i) critical lanes requiring added capacity and ii) lanes that could relinquish some capacity. This v/c ratio will be estimated using Equation 4-1 (19). qg (v * C ) v = l = Equation 4-1 c l g l (s l * g l ) s l * C where vl = Actual or projected demand flow rate for lane group l cl = Capacity of lane group l qg = Flow rate measured for a green phase sl = Observed lane saturation flow rate C = Cycle length gl = Length of green indication for movement l
NCHRP 3-66 Interim Report
36
December 2003
For the purpose of development of the following concepts, it is assumed that stop bar flow rates will be available. Figure 3-10, Figure 3-11, Figure 3-12, and Figure 3-13 show example technologies that can be used to collect flow rate data. This flow rate information will be used for the following: • Enhanced lane by lane detectors that move volume density functionality from the phase table to the detectors to provide a mechanism for changing parameters depending upon the flow regime objectives {Critical intersection control or Dilemma zone protection} (Concept 1). • Overriding logic in the controller that terminates a phase if there is a continual presence call, but little or no flow because of a downstream constriction (Concept 2). • Reallocating green time among competing phases to provide approximately equal v/c ratios (Concepts 3 and 4). • Queue length estimation to provide guidance to the scheduling algorithm during recovery from a priority event such as heavy rail preemption (Concept 5). • Tabulating the v/c ratios (and perhaps queue length) to determine if intersection operation should favor dilemma zone protection or critical intersection operation (Concept 6).
4.2.1 Concept 1: Improved lane by lane detection Figure 3-7 and Figure 3-9 illustrated the problem of multiple lanes mapping into a single phase and making phase extension decisions based upon that information. This issue can in part be addressed by using current controller features more effectively. For example, the Type 5 (STOP BAR WITH EXTEND TIMER RESET) detector described in Table B-1 could be used to develop improved procedures for more effectively gapping out a phase. This detector scheme could be even more effectively implemented if gap times were calculated using measured saturation flow rates and then those gap times reduced for the length of time a vehicle occupies a loop detection zone. Those adjusted gap out times would then be configured as the Extend Time in the Type 5 detector shown in Table B-1. This would result in a detection procedure where once each lanes discharge flow rate had fallen such that gap times exceeded the configured threshold, the detector would no longer place a call until the phase displayed a red indication. Such an implementation would effectively implement a scheme where the phase would terminate once all lanes being serviced by the phase had discharged their standing queues. For example, Figure 3-5 illustrates a case where detectors in the two through lanes (lanes 1 and 2) would likely drop their call much sooner then the through/right lane (lane 3) would. If after the call on the left most lane had been dropped, but the phase was still green because
NCHRP 3-66 Interim Report
37
December 2003
the through/right lane had not gapped out, no additional cars detected in the left lane would place a call until after the phase had turned red. Longer term, Section 3.3.1 describes the theory of volume-density functions. However, the current procedure of mapping multiple lanes into one volumedensity function (Figure 3-5 and Table 3-2) results in an awkward configuration procedure that does not fully address likely imbalances in lane utilization (Figure 3-5). It is believed that a lane by lane volume density detector (Figure 3-8) would be a logical extension of the current practice of detector function types (Table B-1, Table B-2, and Table B-3). For example, after reading the description for the Type 5 detector in Table B-1, it is then easy to imagine the volume density parameters (Figure 3-4 and Figure 3-6) being represented by a new detector type, perhaps Type 9. Table 4-1a shows example parameters for a hypothetical Type 9 detector. Line Description 1 Latch call on amber x 2 Variable Initial (Figure 3-4) 3 Sec / actuation 3.0 4 Max initial 18 5 Gap reduction (Figure 3-6) 6 Passage time 5.0 7 Minimum gap 3.0 8 Time before reduction 20 9 Time to reduce 10 a) Simple lane by lane volume-density detector function Line
Description Set 1 Set 2 Set 3 Set 4 Latch call on x x x x 1 amber 2 Variable Initial (Figure 3-4) 3 Sec / actuation 3.0 3.0 2.8 2.5 4 Max initial 18 18 16 15 5 Gap Reduction (Figure 3-6) 6 Passage time 5.0 5.0 4.5 4.5 7 Minimum gap 3.0 3.0 2.5 2.3 Time before 20 18 10 8 8 reduction 9 Time to reduce 10 8 8 7 b) Volume-density detector function with parameters selectable by TOD or traffic conditions Table 4-1: Example volume-density detector parameters
This would have the added benefit of simplifying the phase table by removing several rows of parameters (Table 4-2, Lines 10-15) that are frequently unused.
NCHRP 3-66 Interim Report
38
December 2003
LINE 1 2 3 4 5 6 7 8 9 10 11 12 13 14 15
DESCRIPTION (SEC) MINIMUM GREEN YELLOW CLEARANCE RED CLEARANCE PEDESTRIAN CLEARANCE PEDESTRIAN WALK MAX1 GREEN MAX2 GREEN MAX3 GREEN MAXIMUM EXTENSION VEHICLE EXTENSION TIME BEFORE REDUCTION TIME TO REDUCE MINIMUM GAP TIME SEC / ACTUATION MAXIMUM INITIAL
1 5 3.2 2.0 --15 15 17 1.0 1.4 ------
2 10 4.0 1.5 11 7 46 46 53 3.5 5.0 15 37 3.0 ---
3 5 3.2 2.0 --15 15 17 1.0 1.4 ------
4 7 4.0 1.5 11 7 67 67 78 5.5 5.0 22 54 3.0 ---
5 5 3.2 2.0 --12 12 14 1.0 1.4 ------
6 10 4.0 1.5 11 7 48 48 56 4.0 5.0 18 45 3.0 ---
7 5 3.2 2.0 --16 16 19 1.5 1.4 ------
8 7 4.0 1.5 11 7 66 66 76 5.0 5.0 25 61 3.0 ---
Table 4-2: Econolite phase timing table (25)
Furthermore, since there are certain times of the day (late night operation) where it is desirable to favor dilemma zone protection (Figure 4-1a), and other times of the day (AM peak period) where it is desirable to favor efficient operation (Figure 4-1b), it would be desirable to have different sets of detector parameters that could be enabled by time of day or traffic condition (Table 4-1b).
403''
55 mph
a) Volume density advance detector placement
5
5
Quick reduction Smaller gap
3.0
2.5
0
0 b) Dilemma protection
c) Flow rate control
Figure 4-1: Gap reduction timing changes
4.2.2 Concept 2: Identify downstream capacity restrictions Downstream capacity problems often result in queue spillback to the local intersection, causing many service problems. Today’s actuated controller will
NCHRP 3-66 Interim Report
39
December 2003
continue to provide green time to a movement, up to the specified max times or force offs, whether or not the traffic serviced by that movement has anywhere to go. In this event, it would be advantageous to truncate that phase and give the green time to a movement that can utilize it. With the proposed framework, this could be identified by a constant phase presence call on the approach in question and flow rates near zero. Figure 4-2 illustrates two separate downstream flow problems. In, Figure 4-2a traffic on the east – west arterial (1) has queued up due to timing issues at intersections A and B (A green indication is shown by arrows indicating acceptable movements adjacent to the approach). In this case, it would be prudent to end the northbound green at intersection B (2) and give it to the westbound movement (3), in order to clear the standing queue with spillback to intersection C. In Figure 4-2b traffic entering the freeway (1) has spilled all the way back to the adjacent intersection (A). In this situation, the westbound left turn movement (5) will have nowhere to go when the phase is called. Some of this green time could be better allocated to the eastbound movement (5). While the proposed framework will not be able to make this decision before the phase is called, it can save time that would have been wasted while servicing the westbound left turn movement.
NCHRP 3-66 Interim Report
40
December 2003
3 A
C
B
1 2 a) Flow constriction 1
N 6
A
5
1
b) Flow constriction 2 Figure 4-2: Downstream flow constriction examples
To implement this concept in a controller, the first step would be detector mapping for flow rate and, subsequently, v/c ratio estimation. Table 4-3 details possible detector mapping for count detectors used to estimate these quantities.
NCHRP 3-66 Interim Report
41
December 2003
Detector 1 2 3 4 5 6 7 8 1 . . . . . . . . 2 . . . . . . . . 3 . . . . . . . . … . . . . . . . . 33 x . . . . . . . 34 . x . . . . . . 35 . . x . . . . . 36 . . . x . . . . 37 . . . . x . . . 38 . . . . . x . . 39 . . . . . . x . 40 . . . . . . . x 41 . . . . . . . . 42 . x . . . . . . 43 . . . . . . . . 44 . . . x . . . . 45 . . . . . . . . 46 . . . . . x . . 47 . . . . . . . . 48 . . . . . . . x … . . . . . . . . 64 . . . . . . . . Table 4-3: Detector mapping for count detectors
In Table 4-3, detectors 1 through 32 (although only 1-3 are shown) are mapped as presence detectors, with each lane on its own channel, with the sole purpose of calling the phase. These presence output channels would not be used to estimate a v/c ratio. In this example, count detectors (Figure 3-16, for example) would be mapped in the available channels above 32, with each lane on a separate channel. Phases 2, 4, 6, and 8 each have 2 lanes per approach, where Phase 2 is mapped to channels 34 and 42, Phase 4 is mapped to channels 36 and 44, etc. With the detectors mapped, several parameters would then need adjustment to tune the operation of this concept. Table 4-4 illustrates a possible controller interface menu for this concept.
NCHRP 3-66 Interim Report
42
December 2003
Line 1 2 3 4
Parameter Enable Max Gap in Flow Pulses Max Phase Reduction Allow Min Violation
1 x 5
2 . -
3 X 5
4 x 10
5 x 5
6 . -
7 x 5
8 x 10
50
-
10
50
3
-
50
3
.
-
X
.
.
-
x
.
Table 4-4: Termination during constant phase call with minimal flow
Line 1 is a checkbox to enable or disable this feature. The value in Line 2, Max Gap in Flow Pulses, is the maximum amount of time between detection pulses (i.e. the time between vehicle passages) that would be allowed to occur before phase truncation. It is expected that these values will be considerably higher than a theoretical saturated flow headway because these values would trigger an overriding force off, even though there may be presence on the stop bar detector. Line 3 is the maximum reduction in green time that can occur on a certain phase, if truncated. For example, in Figure 4-2b, it would not be desirable to be overly aggressive in shortening Phase 5 and reallocating that time to Phase 6 because the right turn traffic would exacerbate the Phase 5 problem. In this situation, a modest reduction of 3-5s might be most appropriate. Finally, a check in Line 4 allows the Minimum green time to be violated during this feature’s operation. If this box is checked, the new Minimum green time in the event of phase truncation is the value in Line 2.
4.2.3 Concept 3: Identify local green split inefficiency problem With multiple lanes of detectors tied to one movement, as is common practice on multilane arterials, it is possible for a phase to be extended well beyond the time needed to service queued vehicles because of either the effect of green extension (see Figure 3-9), or in the case of a coordinated intersection, the practice of giving extra time in the cycle to the coordinated phases. This can result in a large standing queue on a side street while relatively light traffic receives excessive green on the main route. This problem can be identified by a v/c