Emphasis, Manual Specification and Evolutive Generation .... the stochastic TF design technique and a manual TF de- ..... As the mouse pointer moves on.
Two-Level Interaction Transfer Function Design Combining Boundary Emphasis, Manual Specification and Evolutive Generation Francisco de Moura Pinto
Carla M.D.S. Freitas
Instituto de Inform´atica, Universidade Federal do Rio Grande do Sul {fmpinto,carla}@inf.ufrgs.br Abstract Direct volume rendering plays an important role in the investigation of volumetric data. In order to display these data, their values must be associated to optical properties. This task is accomplished by transfer functions (TFs), which assign properties like color and opacity to voxel values in the volume. TFs are very important to produce informative images that reveal volume features, but their specification is a non-trivial and unintuitive problem. Without any help in the TF design process, the user goes through a frustrating and time-consuming trial-and-error process. This work proposes a two-level interactive framework combining a few useful semi-automatic design techniques for one-dimensional opacity and color transfer functions. We use the histogram approach proposed by Kindlmann and Durkin, manual design aided by dual domain interaction (space domain and TF domain), stochastic evolutive design and qualitative analysis of multiple TF possibilities using a Design Galleries-inspired method (thumbnails in the first level of interaction and refinement of zoomed-in images in the second level). The combination of these strategies offers precise control over the transfer function specification, plus some interactive guidance, as well as semi-automatic and evolutive search in the TF space.
1. Introduction Volume rendering is widely known as a method for the visualization of large scalar or vector fields, mainly in medical and scientific data exploration [26]. In these areas, one often deals with 3D images, like those obtained from CT and MR devices, and three-dimensional numerical simulation data [6]. Volume rendering techniques and algorithms are well described in the literature, and can be classified as isosurface extraction based methods and direct volume rendering methods. The former extracts polygonal meshes representing isosurfaces found in the volume and then uses the traditional rendering pipeline to display the meshes. On the
other hand, direct volume rendering methods display the volumetric data without building an intermediate geometry [14]. The modern graphics hardware allows volumetric rendering at interactive rates in both approaches. To obtain useful images in volume rendering, a voxel classification is needed to determine which voxels must be displayed as well as their respective optical properties. In direct volume rendering, this classification is typically performed through transfer functions (TFs) that associate visual features to the data. Opacity and color are the most common ones, although others may also be used [15, 24]. The information conveyed by the image built from volumetric data is, therefore, highly dependent on the quality of the transfer function utilized. However, TF design is a nontrivial and unintuitive task, and is actually referred as one of the top ten problems in volume visualization [19]. Designing transfer functions with no assistance leads to a trial-and-error approach, and therefore several automatic and semi-automatic techniques for specifying TFs were proposed [1, 4, 5, 7, 9, 10, 17, 18, 23, 25]. They can be guided by the analysis of volumetric data (data-driven) or guided by the analysis of the generated images (imagedriven) [19]. In any case, to make the process less frustrating and less time-consuming, a quick feedback must be given to the user at interactive rendering frame rates. The domain dimension of a transfer function can be higher than one, allowing more freedom and accuracy in the classification of the voxels. Multi-dimensional TFs can take as arguments vectorial values or a set of local measures of the scalar field, like derivative values, neighborhood, position [25], curvature [8] and statistical signatures [23], but their specification is much more difficult due to the size of the domain [12]. Another disadvantage of representing higher dimensional TFs without restrictions is the large memory requirements. In this work we chose to use one-dimensional transfer functions due to their simplicity. One-dimensional TFs can be implemented as a relatively small lookup table. Furthermore, the pre-integrated volume rendering technique proposed by Engel et al. [3] allows high quality hardware-assisted direct volume rendering us-
ing one-dimensional TFs and 3D texture sampler at interactive rates. The pre-integrated volume rendering using higher dimensional gaussian TFs was proposed by Kniss [13], but this approach restricts the complexity of the generated TFs. The goal of our work is the specification of useful opacity and color one-dimensional transfer functions. The degree of opacity can make a voxel more or less visible and is normally used to emphasize voxels in the boundary between different homogeneous regions of the volume [10]. Based on a previous work by Prauchner et al. [20] and on the stochastic technique from He et al. [7], we developed a framework using both data-driven and image-driven approaches. Prauchner et al. [20] propose a two-level transfer function design interface that uses the Design Galleries method [17] guided by the technique developed by Kindlmann and Durkin [10]. We extended that work by combining Prauchner‘s method with a generalized version of the stochastic TF design technique and a manual TF design interface aided by dual domain interaction [11]. In the two-level TF design technique proposed in this work, the first level renders several thumbnails of the volumetric data (as the Design Galleries-inspired interface implemented by Prauchner et al.), each one associated to a different TF. The most appealing ones can be selected for manual refinement, using our TF editing tool, or as a starting point for stochastic evolutive generation of new TFs [7]. The paper is organized as follows. Section 2 briefly discusses related work. Section 3 describes our TF design technique, while implementation details are discussed in Section 4. A case study along preliminary, informal evaluation data is presented in Section 5 and, in the last section, we draw some conclusions and comment on some ideas for future work.
2. Related Work The transfer function specification problem has received much attention from researchers developing volume visualization techniques. Traditional approaches rely on the user’s effort in adjusting control points of a graphic plot of the transfer function. The control points are then interpolated in order to build the TF. But, with no clues or prior knowledge about the data, this is a “blind process”. Some datadriven approaches provide to the user higher-level information [1, 18] that help in obtaining insight about the data distribution as well as support the manual TF design. Other methods build abstractions of the TF specification process — the transfer functions can be hidden from the user [26] or a simplified space can presented [10]. Kindlmann and Durkin [10] propose a derived space for specification of opacity transfer functions in which the user specifies opacities for voxels as a function of the distance between the voxel and the nearest boundary. They assume
that the boundaries are smoothed by a Gaussian filtering process, i. e., the frequency response of the 3D scanners is assumed to be Gaussian. Informative histograms are built relating voxel values with the first and second derivative values associated to each voxel in the volume. From these histograms, the mean first and second derivative values associated to each voxel value are used to estimate the distance to the nearest border. Since the boundaries must be emphasized, voxel values with small estimated distances should receive larger opacity values. Prauchner et al. [20] used Kindlmann’s method to classify the voxel values by the estimated distance to the nearest border. A set of voxel values with the smallest distances is elected and random subsets are then built. The values of each subset are used as control points for the TF specification. Each of these points receives a random color and a random opacity value different from zero. The transfer functions are obtained by interpolating the control points. Consequently, each subset of the “best” voxel values derives a transfer function to be presented in a gallery of thumbnails, similar to the Design Galleries method [17]. This is the first level of the two-level interaction interface proposed by Prauchner et al.. In the second level, the user can visualize a selected thumbnail in better resolution and refine its TF by adjusting the control points. The thumbnails can be randomly re-generated any time at interactive rates. Gallery-like methods are well suited for image-driven TF specification methods and, for the present work, the stochastic approach by He et al. [7] is particularly interesting. Their method represents transfer functions as vectors of control points (a voxel value associated to an opacity and a color value). The smooth interpolation of these control points produces the actual transfer function. Using this representation of TFs, they propose the application of genetic algorithm operators to create new transfer functions from existing ones. A mutation operator changes a control point of a TF producing a new TF, while the crossover operator produces a new TF by concatenating subvectors of two other TFs. Given a set of TFs, and their respective rendered images, the “best” ones are selected, either by the user or through some automatic evaluation based on objective metrics. The initial TFs are randomly generated and the selected ones are used as models for the next generation, created by the application of the operators mentioned above. Another selection from the generated TF is then needed, and the process repeats itself. Our method combines interesting features from the ones referred above into a general-purpose interactive framework that implements image-driven and data-driven TF design.
3. Transfer Function Specification Most researchers agree that transfer function specification should not overload the users nor exclude them from the process [19]. The quality of a transfer function depends on the amount of information conveyed by the generated image — a subjective metric. Therefore, it is hard to automatically evaluate how “good” a TF is. Fully automatic TF specification methods may miss important features of the volume while fully manual TF design may demand a lot of effort and time, mainly from a user who does not have prior knowledge about the data. A TF design interface should offer useful information about the data and guidelines for the TF building process. The interface may also suggest sets of TFs based on heuristics or mathematical criteria, but the choice between the alternatives must be made by the user. Abstractions of the TF specification process can also be applied with success [10, 25]. In any case, the user makes decisions and sees the results; hence immediate feedback is needed to make the process comfortable. Experienced users working with known data can find good transfer functions with relatively few interactions over a simple, manual TF editing interface. However, when the data is unknown, a trial-and-error approach may not be a good choice. In these cases, the two-level interface for TF specification proposed by Prauchner et al. [20] is very useful because it allows an immediate insight over several volume structures, presented by the thumbnails. However, the two-level interface approach was not thoroughly explored in that work. The TFs of the most appealing thumbnails (first level) can be used not only in manual refinement (second level), but also as a basis to generate other useful transfer functions. Moreover, the manual refinement should be more flexible and aided by the inspection of the volume, with dual domain interaction, i. e., taking into account the correlation between the domains — a value queried in the space domain should be presented in the transfer function domain [11]. The combined TF design techniques proposed herein are described below.
3.1. Stochastic Evolutive TF design Our work implements a two-level interface for specification of transfer functions similar to Prauchner’s. However, in order to generate the TFs applied to the thumbnails rendering, we not only use the histogram approach by Kindlmann and Durkin [10], but we also extend the genetic algorithm technique proposed by He et al. [7] to combine it with any other one-dimensional TF design method. While the genetic codification used by He et al. is based on a vector of control points, our codification of a TF is the TF lookup table itself, containing entries for the voxel values. In our work, the TFs are always represented as lookup tables.
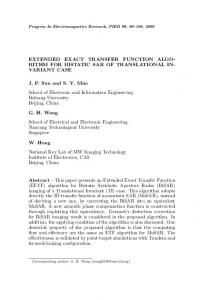
Figure 1. Selection of the parents for a new population of TFs in the first level of interaction. The selected thumbnails are presented in red background. Volume represents the well-known engine model.
The method works as follows. Given a set of thumbnails with their associated TFs, the user selects the best ones to be the parents of a new population, as shown in Figure 1. Then, the parent TFs produce descendants by mutation, crossover or both, in a random way, and a new set of TFs (and thumbnails) is obtained, preserving only the parents selected. By selecting and deselecting members of the new set (population), the user can define the parents of the next TF population. If the quality of a particular thumbnail could not be properly evaluated due its low resolution, the image can be better inspected in the second level of interaction, which shows a higher resolution rendering of the volume. The crossover and mutation operators implemented are described below. • crossover - the crossover operator takes two transfer functions randomly among the ones selected as parents, and cuts them at two points also randomly determined. The interval between the two points of one TF is combined with the two outer intervals (defined by the two points) of the other TF, as shown in Figure 2a. In the graphic plot, the horizontal axis represents voxel values, the vertical one represents opacity, and the color is also associated to each voxel value. The vertical black lines are the two cut points.
(a)
(b)
Figure 2. (a) The crossover operator applied to transfer functions. The topmost two TFs are the parents and the bottom one is the resulting TF. (b) Three types of mutations applied to a TF. The bottom TF is the result.
by high gradient values and low second derivative values. By plotting the voxels in the histogram space (2D) according to their scalar value and gradient magnitude, the boundary voxels appear as arcs. This insight can be very useful in a manual TF editing process. In our transfer function specification method, the control points receive opacity values chosen randomly between a maximum and a minimum value. These control points have voxel values that are probably on a boundary region. An interval of voxel values around each control point receives non-zero opacities in a decreasing way as the value moves away from the control point. The width of the intervals is adjustable. The color transfer functions are also designed to emphasize boundaries. Each control point is associated to two different random colors: one for the voxel values larger than the one in the control point and another for the voxel values smaller than the one of the control point. Between two control points the color values are linearly interpolated. In this way, boundary regions present color discontinuities, as suggested by Fujishiro et al. [6]. Figure 3 shows the benefits of this color TF generation technique and the triangular shapes in the opacity TF.
3.3. Manual Specification • mutation - the mutation operator can be applied repeatedly to a TF. Figure 2b shows a TF and three types of mutation (M1, M2 and M3) applied at regions defined by pairs of points marked as vertical black lines. M1 is a triangular mutation: an opacity value is defined for the center of the mutation and a linear interpolation is applied between the central opacity value and the opacity values at each border. M2 is a random mutation: the opacities are randomly set to value around the mutation center. M3 is a rectangular mutation: the mutation center and range as well as the colors and the opacities are randomly set between limited intervals. There is a fourth type of mutation, which is a global scale in the opacities associated to all voxel values. The operators proposed here can produce high frequency features in the transfer function domain, but this does not cause artifacts in the rendered images. Engel’s pre-integrated volume rendering method as implemented in our work deals very well with high frequencies in the TF definition [3].
3.2. Boundary Emphasis Like Prauchner et al. [20], we use the histogram approach from Kindlmann and Durkin [10] to choose control points for the transfer functions. Moreover, looking at the histograms, the user may have some idea about where the boundaries are. Boundary values are typically characterized
We propose a simple interface for manual specification of TFs. The user draws directly on the transfer function graphic plot. By dragging the mouse with the left button pressed, the user draws a line, setting the shape of the opacity transfer function, as shown in Figure 4(a-c). Using the mouse right button, instead, the user sets an interval of influence in the voxel value axis. The selected interval is affected by color selection or scale changes in the opacity values. Once an interval is set, the user can select a color from a color picker, and paints the interval with this color linearly interpolated with the existing ones, as shown in figure 4(de). The center of the interval is assigned the selected color and the contribution of that color decreases toward the borders of the interval. Using the keyboard, the user can scale the opacities in the interval selected (see figure 4f). During the TF manual modification, the voxel value under the cursor is shown (fig. 4(b-c)). Manual TF modification is better applied when the user makes correlations between the TF domain and the space domain. The presentation of colors in the TF graphic plot helps in this way. The user observe in the TF graph the same colors used to render the volume, thus obtaining information about the distribution of voxel values in the volume (space domain). In addition, we implement a volume investigation scheme that can also be used to edit the transfer function. The user can use a clipping plane to sweep the volume, as seen in Figure 5. The slice sampled by the clipping plane is shown at the top right corner as a gray level image
Figure 3. A CT volume rendered with the TF shown in the left. The triangular shapes in the transfer function have color discontinuities at specific voxel values, emphasizing boundaries. The opacity and colors associated to the third peak allow clear visualization of the saliencies in the outermost part of the brain despite the similarity of the voxel values. The white arrow indicates the light incidence direction.
depicting the voxel values. As the mouse pointer moves on the clipping plane or on the sampled slice, the value of the pointed voxel is presented and a small white square appears on the TF chart indicating the position of the pointed voxel value in the transfer function domain (horizontal axis). By clicking on the left mouse button the opacity value for that voxel value is increased. This scheme is very useful to emphasize isosurfaces passing through a certain point of the volume. At any time the user may change the interaction level and apply any of the three techniques combined in this work. For instance, the user may generate thumbnails and select one for better visualization in the second level of interaction. Then, if the image is adequate for the user, it may be selected as a parent for stochastic evolutive TF generation in the first level.
4. Implementation Our volume rendering tool was implemented in C++ using the GLUI library for the interface and OpenGL and CG
(a)
(d)
(b)
(e)
(c)
(f)
Figure 4. A TF (a) and the results of two design steps (b and c). A second TF (d) with a selected interval of influence; (e) red is assigned to the interval; (f) the opacities for the same interval are scaled.
for visualization. The rendering is based on a 3D texture sampler which follows Engel’s pre-integration method [3]. The number of proxy planes can be changed by the user and is automatically reduced, when he or she moves the volume, to guarantee interactive rates. However, the preintegration method allows high quality rendering even with a relatively small number of proxy planes. We achieve interactive rates in the generation of the transfer functions and their respective rendered images by applying the preintegration technique as follows. For the thumbnails (first level of interaction) we compute the pre-integrated lookup table neglecting the self attenuation of the volume slabs, which is much faster than to compute the lookup table considering the self attenuation. For the second level of interaction, the pre-integration is fully implemented, since just one image needs to be rendered. In both cases, thumbnails and full size image, the pre-integration takes less than one second in a 2GHz Pentium 4 CPU. The volume shading is based on a per-fragment Phong lighting model.
5. Results The two-level interaction TF design interface can provide immediate understanding of several volume structures, since it presents a gallery of TFs automatically generated targeting the emphasis of boundaries inside the volume. If
Figure 6. Thumbnails generated by the user after five interaction steps.
Figure 5. The clipping plane (blue rectangle) sweeping the volume and its normal presented as a red arrow; the slice sampled by the clipping plane (gray level image). The mouse pointer is querying a voxel value sampled by the plane (bottom right). The white square in the TF (bottom left) shows the value of the queried position in the horizontal axis.
none of the TFs reaches this goal, the user can generate the TFs again or refine them, using one of the two methods we have implemented: manual design and evolutive generation. If the user needs an abstraction of the TFs, the stochastic evolutive TF generation should be used. On the other hand, the manual modification of the TF provides precise and detailed specification and can be a good choice sometimes, mainly when the dual domain interaction is explored. Although any of the three TF design techniques can be successfully used alone, the strongest point of our work is their combination. Using the boundary emphasis the user can get some automatically generated suggestions, which are a good starting point usually. The stochastic evolutive generation allows gradual refinement of the TFs, and mainly the mutation operator often produces TFs that show volume structures that are not enhanced by other methods, providing additional insight from the data. The refinement can also be accom-
plished through manual design and, due to the hints provided by our interface, even a trial-and-error TF design effort is not a “blind” process. We performed an informal evaluation of our volume visualization tool by presenting it to three users that had never used our application before. They are Computer Science students with no experience in using volume visualization software. Only verbal explanation was provided to them, and we established a task like “make the bones clearly visible” in a CT dataset of a human head. Using only boundary emphasis and evolutive generation, the users obtained a good visualization of the head bones (according to their judgment) in about five interaction steps: two TF generations using boundary emphasis and three using the stochastic evolutive method, in general. Manual TF design, however, requires more experience from the user, but ten minutes of training in our editing interface was enough for the users to understand the method. Figures 6 and 7 show the results obtained by one of the three users using two initial steps of TF generation with boundary emphasis and three additional steps for refinement with evolutive generation. The number of parent TFs selected in each population was about three or four. Figure 6 shows the last population generated by this user before he decided to stop. The thumbnail selected by the user as the best one is presented in figure 7. The TF used for the image in Figure 8 was manually edited.
6. Conclusions and Future work Despite the considerable attention received by the transfer function specification problem, TF design is still a hard
Figure 7. The image selected by the user to represent the bones.
Figure 8. An image generated using a manually designed transfer function.
7. Acknowledgments task. We are far away from an ideal solution, but several TF specification methods have proved to be useful. We developed an interactive general purpose volume visualization tool with high quality volume rendering by adapting, extending and combining known TF specification techniques. Compared to other methods, ours successfully combines two different classes of approaches (image-driven and datadriven), allowing abstractions during the TF design process without preventing user control, since a friendly manual editing interface is also provided. There are many possibilities for future work. For example, our method suffers from noise in volume data, and thus a straightforward future work is to apply a pre-processing step of filtering. This step could not only remove noise, but also enhance features present in the volume [4]. A particularly challenging future work is to apply stochastic evolutive generation to higher-dimensional transfer functions. TFs with more than one dimension are much more difficult to deal, thus abstractions of higher-dimensional TF representation are an attractive solution. Compared to other methods based on abstractions [25, 26], the stochastic evolutive TF generation is more simple both to implement and use.
We thank J.L. Prauchner and his co-authors for kindly providing us their tool, which was the starting point of ours, and the colleagues from the CG group of UFRGS that served as subjects in our informal evaluation. We also acknowledge the financial support from CNPq.
References [1] C. L. Bajaj, V. Pascucci, and D. R. Schikore. The contour spectrum. In VIS ’97: Proceedings of the 8th conference on Visualization ’97, pages 167–ff., Los Alamitos, CA, USA, 1997. IEEE Computer Society Press. [2] K. Engel, T. Ertl, P. Hastreiter, B. Tomandl, and K. Eberhardt. Combining local and remote visualization techniques for interactive volume rendering in medical applications. In VIS ’00: Proceedings of the conference on Visualization ’00, pages 449–452, Los Alamitos, CA, USA, 2000. IEEE Computer Society Press. [3] K. Engel, M. Kraus, and T. Ertl. High-quality pre-integrated volume rendering using hardware-accelerated pixel shading. In HWWS ’01: Proceedings of the ACM SIGGRAPH/EUROGRAPHICS workshop on Graphics hardware, pages 9–16, New York, NY, USA, 2001. ACM Press.
[4] S. Fang, T. Biddlecome, and M. Tuceryan. Image-based transfer function design for data exploration in volume visualization. In VIS ’98: Proceedings of the conference on Visualization ’98, pages 319–326, Los Alamitos, CA, USA, 1998. IEEE Computer Society Press. [5] I. Fujishiro, T. Azuma, and Y. Takeshima. Automating transfer function design for comprehensible volume rendering based on 3d field topology analysis (case study). In VIS ’99: Proceedings of the conference on Visualization ’99, pages 467–470, Los Alamitos, CA, USA, 1999. IEEE Computer Society Press. [6] I. Fujishiro, Y. Takeshima, T. Azuma, and S. Takahashi. Volume data mining using 3d field topology analysis. IEEE Comput. Graph. Appl., 20(5):46–51, 2000. [7] T. He, L. Hong, A. Kaufman, and H. Pfister. Generation of transfer functions with stochastic search techniques. In VIS ’96: Proceedings of the 7th conference on Visualization ’96, pages 227–ff., Los Alamitos, CA, USA, 1996. IEEE Computer Society Press. [8] J. Hlad˚uvka, A. K¨onig, and E. Gr¨oller. Curvature-based transfer functions for direct volume rendering. In B. Falcidieno, editor, Spring Conference on Computer Graphics 2000 (SCCG 2000), volume 16, pages 58–65, may 2000. [9] R. Huang and K.-L. Ma. Rgvis: Region growing based techniques for volume visualization. In PG ’03: Proceedings of the 11th Pacific Conference on Computer Graphics and Applications, page 355, Washington, DC, USA, 2003. IEEE Computer Society. [10] G. Kindlmann and J. W. Durkin. Semi-automatic generation of transfer functions for direct volume rendering. In VVS ’98: Proceedings of the 1998 IEEE symposium on Volume visualization, pages 79–86, New York, NY, USA, 1998. ACM Press. [11] J. Kniss, G. Kindlmann, and C. Hansen. Interactive volume rendering using multi-dimensional transfer functions and direct manipulation widgets. In VIS ’01: Proceedings of the conference on Visualization ’01, pages 255–262, Washington, DC, USA, 2001. IEEE Computer Society. [12] J. Kniss, G. Kindlmann, and C. Hansen. Multidimensional transfer functions for interactive volume rendering. IEEE Transactions on Visualization and Computer Graphics, 8(3):270–285, 2002. [13] J. Kniss, S. Premoze, M. Ikits, A. Lefohn, C. Hansen, and E. Praun. Gaussian transfer functions for multi-field volume visualization. In VIS ’03: Proceedings of the 14th IEEE Visualization 2003 (VIS’03), page 65, Washington, DC, USA, 2003. IEEE Computer Society. [14] M. S. Levoy. Display of surfaces from volume data. PhD thesis, Chapel Hill, NC, USA, 1989. [15] E. B. Lum and K.-L. Ma. Lighting transfer functions using gradient aligned sampling. In VIS ’04: Proceedings of the conference on Visualization ’04, pages 289–296, Washington, DC, USA, 2004. IEEE Computer Society. [16] T. Malzbender. Fourier volume rendering. ACM Trans. Graph., 12(3):233–250, 1993. [17] J. Marks, B. Andalman, P. A. Beardsley, W. Freeman, S. Gibson, J. Hodgins, T. Kang, B. Mirtich, H. Pfister, W. Ruml,
[18]
[19]
[20]
[21]
[22]
[23]
[24]
[25]
[26]
K. Ryall, J. Seims, and S. Shieber. Design galleries: a general approach to setting parameters for computer graphics and animation. In SIGGRAPH ’97: Proceedings of the 24th annual conference on Computer graphics and interactive techniques, pages 389–400, New York, NY, USA, 1997. ACM Press/Addison-Wesley Publishing Co. V. Pekar, R. Wiemker, and D. Hempel. Fast detection of meaningful isosurfaces for volume data visualization. In VIS ’01: Proceedings of the conference on Visualization ’01, pages 223–230, Washington, DC, USA, 2001. IEEE Computer Society. H. Pfister, B. Lorensen, C. Bajaj, G. Kindlmann, W. Schroeder, L. S. Avila, K. Martin, R. Machiraju, and J. Lee. The transfer function bake-off. IEEE Comput. Graph. Appl., 21(3):16–22, 2001. J. L. Prauchner, C. M. D. S. Freitas, and J. L. D. Comba. Two-level interaction approach for transfer function specification. In Proceedings of XVIII SIBGRAPI - Brazilian Symposium on Computer Graphics and Image Processing. IEEE Press, 2005. A. Sangole and G. K. Knopf. Representing high-dimensional data sets as closed surfaces. Information Visualization, 1(2):111–119, 2002. V. Srivastava, U. Chebrolu, and K. Mueller. Interactive transfer function modification for volume rendering using preshaded sample runs. In PG ’02: Proceedings of the 10th Pacific Conference on Computer Graphics and Applications, page 489, Washington, DC, USA, 2002. IEEE Computer Society. S. Tenginakai, J. Lee, and R. Machiraju. Salient iso-surface detection with model-independent statistical signatures. In VIS ’01: Proceedings of the conference on Visualization ’01, pages 231–238, Washington, DC, USA, 2001. IEEE Computer Society. M. Tory. A practical approach to spectral volume rendering. IEEE Transactions on Visualization and Computer Graphics, 11(2):207–216, 2005. Student Member-Steven Bergner and Member-Torsten Moller and Member-Mark S. Drew. F.-Y. Tzeng. An intelligent system approach to higherdimensional classification of volume data. IEEE Transactions on Visualization and Computer Graphics, 11(3):273– 284, 2005. Member-Eric B. Lum and Senior Member-KwanLiu Ma. F.-Y. Tzeng, E. B. Lum, and K.-L. Ma. A novel interface for higher-dimensional classification of volume data. In VIS ’03: Proceedings of the 14th IEEE Visualization 2003 (VIS’03), page 66, Washington, DC, USA, 2003. IEEE Computer Society.