Understanding Passive and Active Service Discovery Genevieve Bartlett† John Heidemann† Christos Papadopoulos‡ Sciences Institute ‡Colorado State University
[email protected] [email protected] [email protected]
†USC/Information
ABSTRACT
Keywords
Increasingly, network operators do not directly operate computers on their network, yet are responsible for assessing network vulnerabilities to ensure compliance with policies about information disclosure, and tracking services that affect provisioning. Thus, with decentralized network management, service discovery becomes an important part of maintaining and protecting computer networks. We explore two approaches to service discovery: active probing and passive monitoring. Active probing finds all services currently on the network, except services temporarily unavailable or hidden by firewalls; however, it is often too invasive, especially if used across administrative boundaries. Passive monitoring can find transient services, but misses services that are idle. We compare the accuracy of passive and active approaches to service discovery and show that they are complimentary, highlighting the need for multiple active scans coupled with long-duration passive monitoring. We find passive monitoring is well suited for quickly finding popular services, finding servers responsible for 99% of incoming connections within minutes. Active scanning is better suited to rapidly finding all servers, which is important for vulnerability detection–one scan finds 98% of services in two hours, missing only a handful. External scans are an unexpected ally to passive monitoring, speeding service discovery by the equivalent of 9–15 days of additional observation. Finally, we show how the use of static or dynamic addresses changes the effectiveness of service discovery, both due to address reuse and VPN effects.
Service discovery, Situational awareness, Network reconnaissance, Passive monitoring, Active measurement
1.
INTRODUCTION
Today’s computer networks support very diverse sets of services, and network administrators must manage and protect an organization’s network from vulnerability and inappropriate information disclosure. In small organizations, externally visible computers and services may be centrally managed, but in large organizations and ISPs control of servers is delegated. Yet, the ultimate responsibility for security and auditing may remain centralized, so in these cases service discovery becomes an important part of maintaining and protecting such networks. Service discovery is an essential capability for network administrators for the following reasons. First, it helps protect against software vulnerabilities. Internet worms and botnet sweeps exploit vulnerabilities in open network services. Rapid identification of vulnerable software is important after disclosure of an exploit; preemptive surveys can track an organization’s service “surface area”. Second, most organizations have policies about computer use, often including what external services may be offered. Service discovery supports auditing of policies. Third, service discovery is often the first step in network planning. Understanding what services are in use can identify who and how many users will be affected by a change in policy or configuration. Finally, service discovery can also help monitor trends in service popularity, as new services appear and the relative importance of services change. Even if one cannot control individual hosts, access to the network allows two general methods to discover services: active probing and passive monitoring. With active probing, one attempts to contact each service at each host. Active probing gives an accurate depiction of all open and available services on a network at the time of the probe, but it may miss services which are only available intermittently or are hidden behind by firewalls. In addition, probing is invasive and may be inappropriate when crossing organization boundaries (for example, an ISP probing its customers). In passive monitoring, one observes network traffic destined to servers, building up a picture of active services over time. Passive monitoring will detect all services that are exercised over the observation period, including services behind firewalls and transient services—services which are available at a single IP for only a brief period, either because the service or server itself is shutdown or the server is
Categories and Subject Descriptors C.2.3 [Computer-Communication Networks]: Network Operations—Network monitoring
General Terms Measurement
Permission to make digital or hard copies of all or part of this work for personal or classroom use is granted without fee provided that copies are not made or distributed for profit or commercial advantage and that copies bear this notice and the full citation on the first page. To copy otherwise, to republish, to post on servers or to redistribute to lists, requires prior specific permission and/or a fee. IMC’07, October 24-26, 2007, San Diego, California, USA. Copyright 2007 ACM 978-1-59593-908-1/07/0010 ...$5.00.
1
a transient host and does not have a fixed IP address. Since it is non-invasive, passive monitoring cannot be confused with malicious behavior. However, it misses services which are idle, even though they may still represent a vulnerability. In this paper we present a quantitative evaluation and comparison of passive monitoring and active probing for service discovery based on data collected at the University of Southern California. Although these approaches have been compared qualitatively in IT trade magazines [15] there has been little quantitative exploration. Our comparison of passive and active service discovery is closer to Webster [19], but goes deeper by evaluating multiple periodic active scans (Section 4.2.3) and the effects of transient hosts and external scans (Sections 4.4.2 and 4.3). Additionally, we investigate the sensitivity of passive/active discovery to time of day, monitor location and portion of traffic seen by the monitor (Section 5). Finally, using a larger and more varied population we confirm the core conclusions in Webster [19] that passive and active are effective and often complimentary means of service discovery. We find passive monitoring is well suited for quickly finding popular services, such as for trend monitoring; within minutes passive monitoring finds servers responsible for serving 99% of incoming connections. We find that active scanning is better suited to finding all servers, such as for vulnerability detection; one scan finds 98% of services in two hours, missing only a handful. In addition, we look carefully at what network conditions affect the completeness of active and passive service detection. On our network, long-duration passive monitoring is ultimately reasonably successful at finding even idle servers (finding 72–91%); perhaps ironically, external, possibly malicious scans of our network, provide great assistance in rapidly detecting services. We also show how the use of static vs. dynamic addresses changes the effectiveness of service discovery. We see a great deal of ongoing service discovery with more dynamic addresses, corresponding to transient hosts that possibly reuse addresses. In addition, we show that services on VPN addresses are almost never discovered passively, but are found with active probing.
To discover available services hosts are scanned by probing all target ports on each host on the network. Probes may be generic (specific only to the protocol, not the application), or customized to an expected application. Host discovery can speed service discovery by checking for host presence and skipping unused addresses. For some services, a probe may need to be specific to a given application. However, the TCP connection setup suggests that for TCP services simply initiating a connection is a generic probe that will detect the presence of a server on a well-known port. This process of discovering TCP services is known as half-open scanning, where the prober attempts to set up a new TCP connection to a given port. Other possible responses include a TCP reset message, confirming no service runs on that port or lack of response, suggesting a firewall. Generic TCP probing is insufficient, however, in two cases. First, it only tests for willingness to open a TCP connection, but not what service that connection supports. It will therefore misinterpret services running on non-standard ports, such as a web server running on the SMTP port. Second, it cannot classify servers that have no standard port, or those that use dynamic port assignment. For example, many RPC protocols allocate TCP ports dynamically and discover allocation through service brokers or portmappers (for example, [5,14,17]). To discover these services an active probe must be specifically designed for that service’s protocol. Nevertheless, use of well known ports is common today, and a necessary means of coordination without a third party. Though generic UDP probing gives ambiguous results, such probing is still possible for well-known UDP services. Certain protocols will respond to a “malformed” UDP packet and hence will respond to a generic UDP probe. In other cases, we can indirectly infer the presence of a UDP service by lack of a negative response, since many hosts automatically generate ICMP port unreachable messages when no process is listening to a given UDP port. A lack of response is not definitive, but may indicate that a UDP server is present. In the majority of our study we focus on TCP services, but delve briefly in UDP service discovery in Section 4.5.
2. OVERVIEW OF SERVICE DISCOVERY TECHNIQUES
2.2
Passive Monitoring
Passive monitoring finds services on a network by observing traffic generated by servers and clients as it passes an observation point and is generally invisible to the hosts running the services. Passive monitoring requires support from the network operator, often with specialized hardware inserted at the monitoring point. There are multiple hardware devices available for passive monitoring, with different costs and tolerance of high traffic volumes. Many routers can “mirror” ports, sending copies of packets out another interface to a monitoring host. Port mirroring can often be added with no interruption to service, but may not support full channel capacity. Alternatively, hardware taps such as optical splitters place no additional burden on the router, but require a brief service interruption to install. Detection of well-known services (both TCP and UDP) with passive monitoring is fairly straightforward. An exchange of traffic with a given host indicates an operational service. For TCP, monitoring need only capture TCP connection setup messages (SYN bit set); completion of the
We next describe briefly how active probing and passive monitoring are used to discover services, and review the trade-offs between these approaches.
2.1 Active Probing Active probing finds services by sending packets to each host and monitoring its response. Active probing requires participation of the host running the service, so results can be affected by firewalls or host counter-measures.
2
“three-way handshake” clearly indicates a service is available. Under normal operation, even just the presence of a positive response to a connection request (SYN-ACK) is sufficient evidence of a TCP service. UDP services can also be identified by observing traffic; however, since UDP is a connectionless protocol, the concept of “server” and “client” is not clear without application protocol information. In addition, while bi-directional traffic positively indicates a UDP service, unidirectional traffic may also indicate a service (since UDP does not mandate a response), but may also indicate unsolicited probe traffic. As with active probing, passive monitoring can not identify services that do not run on well-known ports or are indirected without protocol-specific decoders.
from the network, all may be found. While it may seem surprising that one may run services on hosts that are intermittently available, we see that this effect can be significant in Section 4.4.2. Third, passive monitoring can catch services that active probing misses because of firewall configurations. Fourth, although not a primary focus of this paper, passive monitoring can also provide insight into trends and other behaviors which active probing cannot. While monitoring servers, passive monitoring can also track clients, providing extra information such as server popularity and server load. Finally, since passive monitoring consumes no network resources (other than the monitoring host), it can be run on a long-term basis as part of normal operation. The main disadvantage of passive monitoring is that it only detects services that are active. Silent servers therefore escape notice, even though they may still pose vulnerabilities or policy violations. We quantify the number of these silent servers in Section 4.4.1 by using active probes to discover servers which escape notice during passive monitoring. This disadvantage can be somewhat mitigated by long-term monitoring. We quantify the effect of duration of passive monitoring in Section 4.2.1.
2.3 Discussion Based on the descriptions of active and passive service discovery above, we next compare their advantages and disadvantages. With few exceptions, active probing gives a complete report of all ports that are open and unprotected at the time of the probing. Active probing for services will miss ports that are filtered by firewalls or obscured by mechanisms such as port knocking [10]. Arguably, protected services are less likely to be vulnerable to malicious scanning and/or unsolicited attacks, so detection of such services is less critical for vulnerability assessment. However, for goals of auditing and resource planning, discovery of all (including protected) services is important. Active probing can often be done quite quickly. While they consume some bandwidth, scanners can be placed near the probed hosts where bandwidth is plentiful. The main disadvantage of active probing is that it is very intrusive. Active probes solicit a response that would not have been sent otherwise. This can be detected and logged by the host or intrusion detection systems, particularly if one systematically scans all hosts in a region. Scanning across organizations (such as an ISP scanning its customers) may be considered unacceptable by the customers and may even be illegal. Even within a single organization, there can be a lack of central authority to coordinate and authorize scans. Recognizing these concerns, scanning tools such as Nmap support special scanning modes that intentionally slow their probe rate to conceal their behavior. Scanning is often intentionally avoided as a policy decision out of regard for client privacy. When active probing is used, it is often limited to short probes done relatively infrequently, or perhaps only carried out when motivated by a specific vulnerability. A second disadvantage of active scanning is that it misses hosts that may be temporarily unavailable at the time of scan. We quantify this effect in Section 4.1, and in fact show that the time of day of the scan matters (Section 5.1). This disadvantage can be mitigated with multiple active scans, as we show in Section 4.2.3, although additional scans my draw further notice from those operating the scanned hosts. Passive monitoring has the advantage of being non-intrusive. In fact, it generally cannot be detected by either party of a conversation. As a result, use of passive monitoring is constrained primarily by policy decisions by the network operator. A second advantage of passive monitoring is that it can better detect active services running on transient hosts. Thus, vulnerabilities on machines that are frequently powered off such as laptops, or hosts temporarily disconnected
3.
METHODOLOGY AND DATASETS
To compare passive monitoring with active probing we carried out five experiments in 2006 for periods of up to 90 days as shown in Table 1. We next describe our data collection and give details on our experiments. The data was collected at the University of Southern California, with a student population of about 28,000 and faculty and staff adding another 10,500. We describe this population in more detail in Section 3.3.
3.1
Methodology for Active Probing
Our active scans were performed by the staff of our campus network administration using Nmap [2]. Probing was done from internal campus machines, thus both the probes and the responses were invisible to our passive monitoring. For larger experiments (Datasets D TCP1 and D TCPbreak ), an address space of 16,130 IP addresses was split roughly in half and scanned separately by two internal machines. For smaller experiments, scanning was performed from a single internal machine. All IP addresses in the scanned space were probed (there was no separate phase for host discovery). For our larger datasets, probing took one to two hours to complete. Scans used Nmap’s half-open scanning mode, We focus on a set of standard TCP service ports: port 21 (FTP), 22 (SSH), 80 (web), 443 (SSL web) and 3306 (MySQL). We have chosen a small set of standard ports for simplicity and out of privacy concerns. We believe that our results hold for other services that use well-known ports. To complement discovery of TCP-based services, one dataset (Dataset D UDP ) uses Nmap’s generic UDP probing to probe a set of four standard UDP ports: 80 (HTTP and other applications), 53 (DNS), 137 (Microsoft Windows NetBIOS Name Service) and 27015 (common multiplayer game port). We discuss results from our UDP scans in Section 4.5.
3.2
Methodology for Passive Monitoring
Our passive measurements are collected at the regional ISP serving our university as well as other academic and commercial institutions. Based on discussions with our IT staff, we estimate we capture over 99% of non-Internet2 traf3
4.1
fic to and from the university. (In section 5.2, we investigate how adding monitoring of Internet2 traffic affects our results.) We used a continuous network tracing infrastructure [9] and collected all TCP SYN, SYN-ACK and RST packets, as well as all UDP traffic. To discover available TCP services, we assume that any host sending a SYN-ACK is running a service. TCP SYNs and RSTs are used in Section 4.3 to identify external hosts, which scan the university network. To discover available UDP services, we assume that any host which sends UDP traffic from a well known server port is running a UDP service on that port.
Completeness
Our first goal is to evaluate completeness: how closely active or passive detection comes to detecting everything. To answer this question we first define ground truth and explore how close we come to detecting all servers. We then consider other definitions of completeness, such as all connections or all traffic.
4.1.1
Hosts as Ground Truth
We first establish the effectiveness of both methods. We look at the servers discovered by active and passive methods during a brief survey and compare the completeness each method achieves. For this comparison, we use the first 12hours of passively collected data and the first active scan from dataset D TCP1-18d . We call this subset D TCP1-12h . It makes up 3% of dataset D TCP1-18d ; we expand to consider all data in D TCP1-18d in Section 4.2.1. To compare passive and active methods we must first define ground truth. Ideally we would get ground truth by confirming, externally, what services run on each machine. However, we cannot do this for our dataset since it spans a significant portion of a university with hundreds of separately administered groups and thousands of privately run machines. Instead, we define ground truth as the union of servers found by passive and active methods. While we expect that passive monitoring will not give as complete a picture as active probing, we also expect passive monitoring to find a number of services active probing misses. The leftmost column of Table 2 summarizes server discovery for each method as well as the union and overlap of the two methods. Combined, both methods find 1,748 hosts running one or more service of interest. Treating these 1,748 as the ground truth for completeness, a single network scan discovers 98% of all servers by detecting 1,707 hosts. Passive monitoring for 12-hours achieves only 19% completeness by detecting 327 servers. Given the large percentage of hosts missed, it is clear that passive monitoring by itself is not sufficient for situations when one must rapidly find all servers that meet a given criteria, such as doing a vulnerability scan immediately following the disclosure of a software flaw. While Table 2 quantifies the overlap and completeness of passive and active methods, Table 3 gives context to these numbers by interpreting each combination of observations. For example, because 286 servers were found by both methods, we know that 16% of servers found in dataset D TCP1-12h are open and active servers, while the vast majority of servers (81%) are idle. Despite the power of active probing, passive monitoring finds 41 servers (2.3%) active probing fails to detect. Active may have missed these servers because the servers were born after the active scan completed, or these servers may be protected by a firewall that discards our active probes, while accepting requests from other IP addresses. We look closer at firewalled services and server birth in Section 4.2.1. While 2% is a very small percentage of services found exclusively by passive monitoring, finding these few services may be valuable if, for example, one of these services violates policy. In cases where completeness is key, a combination of both methods is advantageous.
3.3 Datasets Using the methodology described above, we collected five datasets summarized in Table 1. Each dataset has an active and a passive component: data from continuous passive monitoring and data from one or more active scans. Each dataset contains information for a set of IP addresses from one or more subnets on our campus. The total number of possible IP addresses in each set is listed in column six of Table 1. Four of our datasets cover 38 of the most densely populated subnets on campus. Together, these 38 subnets contain 16,052 IP addresses. Roughly 75 % of this address space has assigned host names, and over 40% of the IP addresses we probed during our study responded with at least one TCP RST and/or TCP SYN–ACK, indicating at least 6,450 of the 16,130 IP addresses are assigned to live hosts. Our main dataset, D TCP1-18d , is an 18-day period with concurrent active probes every 12 hours and passive collection over the entire period. We also use two variations of this dataset. The dataset is actually a subset of the longer D TCP1 dataset, which includes 90 days of passive monitoring, but we only have active measurements for 18 days, captured in D TCP1-18d . We use the full 90-day version to study very long duration passive monitoring in Section 4.2.2. We also use the first 12-hours of D TCP1-18d for our preliminary analysis and D TCP1-18d-trans , the set of “transient” addresses of D TCP1-18d in Section 4.4.2 to discover transient hosts. Dataset D TCP1 was taken during a the semester when students, faculty and staff are present. Dataset D TCPbreak compliments D TCP1 with a similar duration, but but was taken during the December break in classes when many students are absent from campus, giving insight into how our results change with a reduced number of users. Dataset D UDP is used for a brief exploration into UDP service discovery and covers a selected set of 4 UDP ports (discussed in Section 4.5). Due to privacy concerns both passive and active results are anonymized after collection, and all processing was done on anonymized traces. The anonymized datasets are available through the PREDICT project [18] or by contacting the authors.
4. EVALUATION OF SERVICE DISCOVERY We next evaluate passive and active approaches to service discovery, considering completeness (Section 4.1), the importance of observation time, repeated probing, and external scans on completeness (Section 4.2 and 4.3), and finally how the type of the target computer and service affects accuracy (Section 4.4). 4
Dataset Name D TCP1 D TCP1-12h D TCP1-18d D TCP1-18d-trans D TCP1-90d D TCPbreak D UDP
Start Date 10 Aug. 2006 19 Sept. 2006 19 Sept. 2006 19 Sept. 2006 10 Aug. 2006 16 Dec. 2006 18 Oct. 2006
Passive Duration 90 days 12 hours 18 days 18 days 90 days 11 days 1 day
Active Scans 35 total once every 12 hrs every 12 hrs every 12 hrs once
Target Services TCP/selected TCP/selected TCP/selected TCP/selected TCP/selected TCP/selected UDP/selected
Number of addresses 16,130 16,130 16,130 2,296 16,130 16,130 16,130
Discussion Section Section Section Section Section Section Section
4 4 4.4.2 4.2.2 5.2 4.5
1: List of datasets. D TCP1-12h and D TCP1-18d are subsets of D TCP1 . Percent of D TCP1-18d used 3% Passive duration in hours 12 Number of active scans 1 Total servers found (union) 1,748 (100%) Passive AND Active 286 (16%) Active OR Passive (but not both) Active only 1,421 (81%) Passive only 41 (2.3%) Active 1,707 (98%) Passive 327 (19%)
6% 25 2 1,848 (100%) 1,074(58%)
50% 205 17 2,551 (100%) 1,738 (68%)
100% 410 35 2,960 (100%) 1,925 (65%)
716 (39%) 58(3.1%) 1,790 (92%) 1,132 (61%)
683 (27%) 130 (5.0%) 2,421 (95%) 1,868 (73%)
848 (29%) 186 (6.3%) 2,773 (94%) 2,111 (71%)
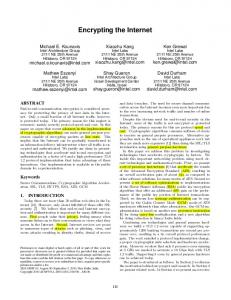
2: Summary of completeness for active and passive methods at various duration using dataset D TCP1-18d the traced duration respectively, we would discover 90% of the client-weighted servers when we detect server A. Second, we consider weighing by number of flows. This follows the same methodology as weighing by clients, but adjusted by flows over the dataset duration rather than unique clients. Figure 1 compares the weighted and unweighted completeness of active and passive discovery. As described above (Section 4.1.1), we see that passive discovery takes some time to find the 19% of hosts that it will find over 12 hours. However, we see that passive monitoring finds the most popular servers almost immediately—in fact it finds 99% of the client-weighted servers in 14 minutes, and 99% of the flowweighted servers in 5 minutes. Thus, while passive is very poor at finding all servers, it can very rapidly find popular and active servers. We will see the cause of this difference when we look at server type in Section 4.4. The services that passive misses are rarely used with default configurations. In fact, passive monitoring actually finds the most popular servers faster than they would be found with active scanning. This can been seen in Figure 1, where our active scan takes well over an hour to find 99% of the flow- and client-weighted servers. This difference is because it is relatively slow to scan a large address space, particularly if the scan is rate-limited to reduce the effects to normal traffic, to avoid flooding hosts, or avoid triggering intrusion-detection systems.
Percent of union found
100
80
60
Passive
Active
Unweighted 40
Flow weighted Client weighted
20
0 10:00
12:00
14:00
16:00
18:00
20:00
22:00
00:00
Time (hour:minute)
1: Weighted and unweighted cumulative server discovery over 12 hours for selected services.
4.1.2
Other Measures of Completeness
In the last section we looked at completeness in terms of absolute number of servers found. While finding all servers is important in some cases, such as identifying software vulnerabilities, in other cases one may care more about identifying popular or active services. We therefore next consider two alternate definitions of completeness that weigh service discovery by their popularity, as reflected by the number of clients and the number of flows to a given service. First, we weigh by unique clients, by counting the number of unique client IP addresses that connect to the server during the duration of our measurements. When we first discover a server, we add the number of clients this IP address serves throughout the study. Thus, if there were only servers A and B to be discovered, with 9 and 1 clients over
4.2
Server Discovery Over Time
As demonstrated in the previous section, passive monitoring for a short period only observes a fraction of servers. However, active monitoring misses a few servers as well. In the following sections we look at extended service discovery, either through long duration passive monitoring, or through multiple rounds of active probes. 5
2500
2000
1500
Number of server IP addresses discovered
Number of server IP-addresses discovered
Active Probes 3000
Continuous Passive Monitoring Active (all hosts) Passive (all hosts) Active (static only) Passive (static only)
1000
500
0 09-18 09-20 09-22 09-24 09-26 09-28 09-30 10-02 10-04 10-06 10-08
3500 3000
TCP118d (all hosts) 2000 TCP190d (static only)
1500 1000
TCP118d (static only)
90 days
500
Time (month-day)
18 days
0 08-05
08-19
09-02
09-16
09-30
10-14
10-28
11-11
Time (month-day)
2: Cumulative server discovery over 18 days, over all and non-transient addresses
3: Comparison of cumulative server discovery over 90 days and 18 days, over all and non-transient addresses
4.2.2 4.2.1
TCP190d (all hosts)
2500
Effect of Duration on Passive Monitoring
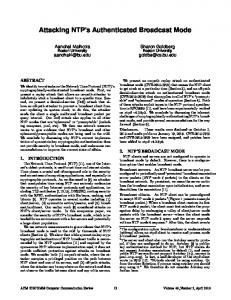
In section 4.1, Figure 1 demonstrates that passive monitoring continues to discover servers as time progresses—this trend suggests that a longer observation period is more effective. To confirm the benefits of longer duration, we look at server discovery over an 18-day period with dataset D TCP1-18d to see if discovery levels off. We expect that given sufficient time, passive monitoring will detect the majority of servers that active probing detects. Figure 2 depicts passive server discovery over time. Separate lines depict server discovery over all IP addresses and over a subset of all IPs: IPs with non-transient addresses. In Section 4.1 we determined that within 12 hours, passive monitoring found 17% of the 1,714 servers found by one active probe. After another 17.5 days, passive monitoring detects 92.5% (1,587) of the 1,714 servers found by a single active probe. We conclude that long-duration passive monitoring can be very effective, although it may still fall short of active probing. A significant portion of servers missed by passive monitoring are servers with transient IP addresses (such as PPP and VPN addresses). We discuss server discovery for servers using transient IP addresses in Section 4.4.2. Over all IP addresses, transient and non-transient together, passive service discovery never levels off. Even in the last five days of monitoring during D TCP1-18d , new servers are still discovered at an average rate of one per hour. This continual discovery is not surprising since transient hosts have a strong effect—every time a server with a transient IP address disconnects, there is the potential of re-discovering this server at a new IP address the next time it connects. Additionally, transient IP addresses can represent many more hosts than static networks, with a variety of users connecting and disconnecting continually. Over non-transient hosts, discovery nearly levels off after 11 days but even in the last five days, hosts are still discovered at an average rate of one every 3 hours. We suggest that server request rates are heavy tailed, and so there are a number of very rarely accessed servers that require a long time to discover. 6
Extended Duration for Passive Monitoring
In the previous section, we found that new servers continue to be discovered even after 18 days of passive monitoring. In this section, we use D TCP1-90d to extend our passive monitoring period to 90 days to see if passive server discovery levels off. Figure 3 shows cumulative server discovery over time for all hosts, with an additional line for just servers with nontransient IP addresses. Server discovery over non-transient hosts drops to an average of just one newly discovered host every 12-hours in the last five days of monitoring. In contrast, server discovery over all hosts only drops to roughly one every hour and a half. Again, this difference can largely be explained by the effect of transient hosts, which are included in the total. We examine transient hosts further in Section 4.4.2.
4.2.3
Effect of Multiple Probes on Active Monitoring
Just as passive observation over a longer duration can find more hosts, we expect that multiple active probes will be more effective as well. Figure 2 shows server discovery as the number of probes increases over 18 days. Over all scans, the majority of servers (62%) are found in the first scan, but the last 10 scans still find 10–30 new servers per scan. Similar to passive discovery, this continuing increase in newly discovered servers is due to transient hosts. Figure 2 also shows server discovery over multiple probes for non-transient hosts only. We observe that the number of discovered servers roughly levels off after five scans; however, new servers appear often enough in our environment that the last 10 scans done over the last five days each discover four servers per scan on average. This is close to the passive discovery rate after 10 days of monitoring, implying that even over extended duration passive monitoring can never fully catch up.
4.2.4
Completeness Over Time
Previously, for completeness, we defined ground truth as the union of a single active scan and 12 hours of passive observation. As shown in the previous section, multiple active scans discover a larger set of hosts, as does extending the
D TCP1-12h Passive Active yes yes yes yes yes yes yes yes no yes no yes no yes yes no yes no yes no yes no yes no no no no no no no no no no no no no no no
D TCP1-18d − D TCP1-12h Passive Active yes yes no no yes no no yes * * yes * no * * * yes yes yes no no no no yes no no yes yes yes yes no yes no yes yes no yes no
Transient * * * * yes no no yes no no no no * yes no yes no yes no
categorization active server address server death intermittent mostly idle idle/intermittent semi-idle idle intermittent birth possible firewall death birth/mostly idle non-server address intermittent/active birth intermittent/idle birth/idle possible firewall/intermittent possible firewall/birth
address count 37 6 1 242 99 1,247 75 26 1 4 3 7 13,341 188 125 655 73 140 31
4: Traits and subsequent categorization of IP addresses. D TCP1-12h Passive Active yes yes no yes yes no no no
categorization active server address idle server address firewalled address or birth non-server address
address count 286 1,421 41 14,553
off and are never seen again by either method. Only 37 of the original servers seen by both continue to be seen by both. However, this group of 37 active servers are the most active and popular servers, responsible for serving the majority of clients and connections to our campus (Section 4.1.2). The majority (242) of servers first seen by both approaches are not seen by future passive monitoring, suggesting that these hosts are mostly idle and happened to be overheard in the first 12 hours of monitoring. The largest group of detected servers in D TCP1-12h were the 1,421 servers seen by active but not passive observation. The majority of these servers are mostly idle servers with fixed IP addresses and 1,247 of these servers are found with passive monitoring over extended time. A few servers (75) are still missed by passive scans. A slightly larger number of servers (99) are on transient addresses, explaining their intermittent behavior. Finally, most addresses (14,553) showed no servers present in our initial 12-hour study. While most of these addresses continue to not have servers (13,341), more than 1000 show activity in the longer period. We highlight two categories here. First, we see a significant number of new servers, either through later passive and active, or just active. Many of these are on transient addresses (188 detected by both, and 655 by active only), but a fair number are on stable addresses (125 detected by both, and 73 by active only). Second, we see 31 possible firewalled servers on stable addresses, as indicated by their lack of response to active probing but presence of traffic. Throughout the total 18 day study, we find 35 potentially firewalled servers (4 from the first 12 hours and 31 in the remaining time). We confirm these 35 servers are running a firewall by two methods: First, if during a single scan probes to these services receive TCP RST packets from some ports, but no responses from other ports, we assume the server is dropping probes to firewalled services and sending resets from ports not providing services. Second, if activity to a
3: Categorization from observations of IP addresses in D TCP1-12h .
duration of passive monitoring, so it is appropriate to revise the definition of ground truth. In this section we define ground truth as the union of all servers discovered by active and passive methods in dataset D TCP1-18d . Though 18 days of passive monitoring may be comparable to a single active scan, passive monitoring, when compared to multiple active scans is not nearly as effective. When we compare passive monitoring against 35 active probes taken over 18 days, (summarized in the last column of Table 2) we see that 18 days of passive monitoring detects only 71% of all servers. Though passive misses a significant number of servers, as seen during our 12-hour study in Section 4.1, passive monitoring finds a handful of servers before active discovers them, as well as servers that are never discovered by any active scan. As shown in the last column of Table 2, at the end of 18 days and 35 scans, 6.3% of all servers found are never found by an active probe. In our preliminary analysis we used Table 3 to interpret our observations from one active probe and a short passive observation. Table 4 extends this classification to consider the implications of our additional scans and monitoring; we next look at how each group of servers from D TCP1-12h fare with longer surveillance. In our first survey using D TCP-12h , 286 servers were found by both passive and active methods. A handful of servers die 7
4.4
server is passively observed during an active scan, we assume the server is available during probing, but blocking our probes. We confirmed 32 out of the 35 servers are running a firewall with the first method. We confirmed 10 out of the 35 servers with the second method. Only one server could not be confirmed as firewall–protected. Though firewalled services represent a small fraction of all hosts found, as discussed in Section 4.1, context defines how important finding these services are. Thus, if completeness is the goal, a combination of both methods is beneficial.
How target type affects detection
The previous sections evaluated passive monitoring and active probing based on their ability to detect select services across a large set of university machines. In the following sections we examine how the type of server and service affects detection by passive and active methods.
4.4.1
Server Purpose
Passive monitoring can only detect services that have active clients. It will not find unpopular services that are listening but never receive traffic. If this is the only reason services are missed by passive monitoring, servers missed by passive monitoring are all unpopular services. We hypothesize that many of these unpopular services are actually completely inactive and often are either accidental services from a default system installation, or services of strictly local interest, such as web control for a physical device. It is difficult to measure the popularity of a service independent from passive monitoring; by definition we see popular services, and we have no way of evaluating how unpopular missed services are. However, for the special case of web servers, the content is usually human readable, so we can manually evaluate the content of the web server. To evaluate the content of discovered web servers, we first download root web pages from all web servers discovered during the 18 days in dataset D TCP1-18d . Each web server is contacted within a day of discovery. We then categorize these root web pages into seven categories: custom content (content that is unique and likely is globally interesting), default content (such as the Apache server test page), minimal content (fewer than 100 bytes), device configuration/status pages (such as JetDirect printer pages), database interface pages (such as Oracle database front-ends), pages with restricted content (log in pages) and hosts which did not respond. To categorize web pages we developed a set of 185 web page signatures, which contain sets of strings commonly found in specific types of web pages. For example, one of our “default content” signatures matches 14 different strings often found in the default Apache web server page. We expect that passive monitoring has no problem finding web servers serving globally interesting (custom) content. Additionally, we expect that pages missed by passive monitoring fall into less interesting categories such as “default content”. It is impossible to determine the global interest for configuration pages, database front-ends and pages with log in access without specific knowledge of their use within the organization. While we suspect many of these pages are intended only for campus use, there may be a set of external users accessing these documents. Table 5 summarizes the content of root web pages. Passive monitoring achieves the best completeness for custom content pages finding all custom content servers. Passive monitoring finds a surprising number of web servers hosting non-globally interesting content, finding 95% of the union. Finding this many servers of non-globally interesting content is contrary to what we expect; however, if we remove web servers only found through external scans, passive monitoring finds 69% of the 504 web servers identified as serving non-interesting content. Though 69% is still a surprisingly large percent, our method for removing external scans (described in Section 4.3) does not remove the
4.3 Effect of External Scans on Passive Monitoring Figure 2 shows several large jumps in passive server discovery (for example, at 9-20 and again at 9-23). We determined that these jumps are due to external scans of the address space—in effect, potentially malicious external parties carrying out an active scan of the address space we monitor. These scans benefit passive monitoring by unveiling otherwise inactive servers. We next evaluate how important these external scans are to passive monitoring. We expect that external scans contribute greatly to the server discovery in passive monitoring. Unpopular or unused services may never be discovered without these kind of systematic walks through the address space. We show that without external scans, passive monitoring is significantly hindered. To remove the effect of external scans from D TCP1-18d , we identify remote hosts which scan significant portions of our campus network during the 18 day period. We consider scanners to be any IP address which attempts to open TCP connections to 100 or more unique IP address on our network within 12 hours, and receives TCP RST responses from at least 100 of these contacted hosts. Our definition of scanners is not perfect; we miss scanners whose probing is ratelimited below our threshold, or which distribute probes over multiple source IP addresses. Our definition classifies 65 external IP addresses as scanners (only 0.001% of the external IPs seen contacting campus). While a broader definition of scanner may result in a larger number of detected scanners, we have certainly identified the hosts responsible for the largest scans. We will next show that these 65 scanners significantly change the effectiveness of passive monitoring. Figure 4 shows the difference between passive server discovery with and without the use of external scans. In the first 12 hours, without external scans server discovery is effectively the same as server discovery with external scans. The first scan on 9/20 aids passive discovery to find over 700 new servers bringing the total of discovered servers to 1,224. Without the aid of scans, passive monitoring takes a additional 9.5 days to discover over 1,200 servers. Within three days, passive monitoring detects over 1,300 servers. Without scans, passive monitoring takes an additional 15 days to find over 1,300 servers. At the end of 18 days, passive monitoring detects 779 (36%) fewer servers when the effect of external scans is removed. Given the significant number of servers discovered through passive monitoring of external scans, we conclude that passive server discovery in a protected (scanner-free) environment will be significantly delayed, and likely less effective. We expect that a broader definition of scanner would further slow passive discovery, but not qualitatively change this conclusion. 8
Page type Custom content Not globally interesting Default content Minimal content Unknown Config/status pages Database interface Restricted content No response
Total (Union) 170 (100%) 504 (100%) 493 11 1,446 (100%) 683 61 17 685
Passive AND Active 151 (89%) 479 (95%) 469 10 798 (55%) 212 61 17 508
Active OR Passive Active only Passive only 0 (0.0%) 19 (11%) 23 (4.5%) 2 (0.39%) 22 2 1 0 474 (33%) 174 (12%) 327 144 0 0 0 0 147 30
Active 151 502 491 11 1,272 539 61 17 655
(89%) (100%)
(88%)
Passive 170 481 471 10 972 356 61 17 538
(100%) (95%)
(67%)
5: Summary of content served by web servers detected.
4.4.2
Cumulative Number of Servers Found
effects of all scanners including some web crawlers, hence many non-interesting servers are still found. There are a large number of servers (685 servers) which did not respond after initial discovery. The vast majority of these servers have transient IP addresses, and are possibly unintentional default web servers on dial-up machines, or potentially intentional web servers on machines with stable IP addresses, but their web server is found by active probing the host’s VPN interface.
Transient Hosts
We next consider transient hosts—hosts which change IP addresses, or which are often turned on and off. We expect that passive monitoring will out perform active probing in server discovery when looking at transient hosts since active probing may miss hosts that come and go. On the other hand, we expect relatively few active services to run on transient hosts, since just as transience make them difficult for an active scan to find, it also makes them difficult for clients to find. To evaluate this hypothesis, we compute service discovery for IP addresses that we know correspond to transient hosts. Our dataset is drawn from a large campus network with known blocks of addresses allocated to VPN, PPP, Wireless and DHCP hosts. Of the 16,130 addresses, 2,296 of them correspond to transient blocks (one /22 campus DHCP; two /23s, DHCP and wireless; and one /24 subnet, for VPNs); we call this subset D TCP1-18d-trans . We then compare active and passive server discovery over this subset. Figure 5 shows server discovery over time for both passive monitoring and active probing, grouped by different address space classes. Ground truth is defined by the union of passive and active discovery of each service type. We omit wireless from this graph, since unfortunately we were not able to actively probe the wireless address range. In addition, passive monitoring found no services in the wireless region. Overall, D TCP1-18d-trans confirms the relative performance of active and passive monitoring. Active probing usually discovers more hosts than passive monitoring, except for the PPP subset where they are relatively close. This result is perhaps not surprising for transient hosts since there is likely to be relatively few active users of services that come and go. However, our analysis of transient address is interesting because different kinds of transient address space show somewhat different results. The data for DHCP addresses is most similar to our general results. This similarity can be explained because the majority the DHCP addresses are ded-
2500
2000
1500
With external scans
1000
500
Effects of external scans mitigated
0 09-18 09-20 09-22 09-24 09-26 09-28 09-30 10-02 10-04 10-06 10-08
Time (month-day)
4: Cumulative server discovery with and without the effect of external network scans.
icated to Residence Halls, with an allocation policy where each student keeps the same IP for a full semester or more. However, for PPP addresses, passive discovery finds about 15% more servers than active. We speculate that this inversion is because PPP hosts are typically active only for short periods of time. Another significant difference is monitoring VPN addresses, where passive discovery finds almost no services (10 after 18 days), while active finds many (nearly 100 in the same time). A possible explanation for this is that VPN hosts often have two IP addresses, one that corresponds to VPN access and another that is direct access to the Internet. While active service discovery suggests that many of these hosts run services, passive discovery says that the VPN address is very rarely used. We speculate that users of services on these hosts are typically using the non-VPN address. Finally, our focus on transient hosts suggests that address transience is a major cause of service birth and death. We reach this conclusion because, in Figure 5, server discovery does not level off. However, because actual hosts-to-address mappings are transient, this discovery may represent a small number of hosts simply moving to different addresses rather than a large number of actual hosts. If that were the case, we would expect server discovery to converge when all transient addresses were marked as servers. While address reassignment may account for some server births, it does not account for all. When we compare server discover with and without 9
Percent of total servers (union of methods) found
Percent of total servers (union of methods) found
Active Probes 100
Continuous Passive Monitoring Active VPN
90 80 70
Passive PPP 60 50
Active PPP
Active DHCP Passive DHCP
40 30 20 10 0 09-18
Passive VPN 09-20
09-22
09-24
09-26
09-28
09-30
10-02
10-04
10-06
10-08
Time (month-day)
Active Probes 100
Continuous Passive Monitoring
90 80 70 60 50 40 30
Active, Web Active, SSH Active, FTP Active, MySQL Passive, Web Passive, SSH Passive, FTP Passive, MySQL
20 10 0 09-18
09-20
09-22
09-24
09-26
09-28
09-30
10-02
10-04
10-06
10-08
Time (month-day)
5: Server discovery grouped by transience of address block.
6: Server discovery over time for passive monitoring and active probing, broken down by protocol.
transient hosts in Figure 2. We review this question when we consider very long passive monitoring in Section 4.2.2.
nificantly fewer. This suggests that many of these servers exist but that they are infrequently used. For FTP, this result consistent with HTTP replacing FTP as the primary The previous section we looked at how address stability means of data dissemination. We presume that FTP servers affects server discovery. In this section we look to what how are primarily legacy servers. For SSH, this result is consisdifferent services and service types affect server discovery. tent with a workstation model of use, where nearly all hosts We expect that different services are used in different ways are available for remote access via SSH, but that protocol and so may be available to different degrees. For example, a is used primarily for maintenance, while most workstation MySQL service may be firewall protected since it is a service access is direct at the console. provided to a limited number of users, whereas a webserver These results are dependent on the particular services we typically has a more global audience and will not be firewall examined. While we expect our basic results to hold for protected. To evaluate the effects of service type, we return to D TCP1-18d , other general well-known services, we speculate that protocols such as peer-to-peer file sharing may be different since but break out server discovery by different server types. We they are known to have a much higher server turnover rate consider four services: Web, FTP, SSH and MySQL. (churn) [4]. Figure 6 shows discovery over time for both passive and active for these specific services, and Table 6 summarizes 4.5 Discovery of UDP Services server discovery. Ground truth is the union of active and passive discovery in D TCP1-18d . The majority of this paper considers only discovery of The results for specific services confirm our overall concluTCP services because the TCP connection setup makes them sion that active probing discovers more servers than passive easy to discover. In this section we broaden our view to conmonitoring. sider UDP service discovery with both active probing and Passive monitoring discovers particularly few MySQL servers, passive monitoring. achieving only 52% completeness, while active scans reach We consider four selected UDP services: port 80 (HTTP 96% completeness. We suspect that the majority of MySQL and other applications), 53 (DNS), 137 (Microsoft Windows servers on campus are used locally, with little external acNetBIOS Name Service), and 27015 (common multiplayer cess, or external access only through web interfaces. In Figgame port). Dataset D UDP collects 24 hours of passive ure 6 the stepped and sudden increases in passive MySQL monitoring and one active scan, both only considering the server discovery indicate MySQL servers are probed from exprimary /16 network at USC. The active probes are not custernal sources, yet interestingly, these scans are not nearly tomized to an expected application, in other words, we use as helpful in passive service discovery as for other services. generic UDP probing for active host discovery. Our passive Upon inspection of our passive and active data, we find that monitoring considers any packets with the above destination 63 out of the 79 MySQL servers missed by passive responded ports as indicating the presence of the corresponding service to our campus probes on 9/29, just after a large external on that host. scan probed the campus address space for MySQL servers. Generic UDP probing is difficult because there is no generic Though these 63 MySQL servers were probed, we observed positive response for service present. We therefore interpret no responses. Potentially, these missed MySQL servers block only an ICMP port unreachable as a true negative response probes from external sources, but still respond to our inand a UDP reply a true positive response. If a host responds ternal active probes, hindering passive discovery from our to some probes and not to others, we know the host is alive, monitoring point, but enabling active discovery. and can then consider a lack of response as suggesting a While active probing finds nearly all FTP and SSH servers possibly open service. We are able to make this final con(99% and 100% respectively), passive monitoring finds sigclusion on the assumption that we did not generate a proper
4.4.3
Protocols
10
Service Web FTP SSH MySQL
Total (Union) 2,120 (100%) 815 (100%) 925 (100%) 164 (100%)
Passive AND Active 1,428 (67%) 566 (68%) 701 (76%) 78 (48%)
Active OR Passive Active only Passive only 497 (23%) 195 (9.2%) 241 (30%) 8 (1.0%) 221 (24%) 3 (3.2%) 79 (48%) 7 (4.2%)
Active Passive (non exclusive) 1,925 (91%) 1,623 (77%) 807 (99%) 574 (70%) 922 (100%) 704 (76%) 157 (96%) 85 (52%)
6: Summary of server discovery broken down by service type.
application-specific request, but most kernels generate negative ICMP responses when no service is present. Finally, if no ports solicit an explicit response (either positive or negative), we assume no host is present. (Nmap contains support for service-specific probing, however, we were not allowed to use that service due to potential privacy concerns.) We expect active probing to perform well at detecting DNS and NetBIOS name servers because these two protocols are common and these servers often respond to generic UDP probes. Table 7 summarizes services discovered by passive monitoring and active probing. Of the 37 servers found by passive monitoring only one was not found by active probing, indicating that considering any traffic from these selected ports to confirm the presence of a server obtains accurate, but not complete, results. The vast majority of hosts indicated as possible UDP servers by active probing sent no response to external sources. Given the prevalence of Microsoft Windows Operating Systems which use the peer-to-peer NetBIOS name server protocol, it is not surprising that a large number of hosts on campus have port 137 open. We observe only 37 UDP servers on the NetBIOS port. Though NetBIOS has the potential to generate a significant amount of traffic, under normal circumstances, NetBIOS traffic does not typically cross border routers.
Percent of total hosts found by active probing
100 90 80 70 60 50 40 30 20 10
Probing every 24 hours -- day Probing every 24 hours -- night Probing alternating day and night Probing every 12 hours at 11am and 11pm
0 09-18 09-20 09-22 09-24 09-26 09-28 09-30 10-02 10-04 10-06 10-08 Time (month-day)
7: Comparison of network scanning at different times of day. dataset. We therefore also consider a third subset where we take alternative day and night measurements from each consecutive day to get an unbiased mix of 17 day and night observations. Figure 7 shows cumulative server discovery over multiple probes for the baseline and three subsets. We first evaluate time-of-day dependence, looking at the completeness scanning at night and during the day achieves. Though the difference is small, scanning during the day is marginally more effective than scanning at night, reducing completeness by 3%. This is not surprising since we expect that there are more transient hosts with active services available during the day. While scanning at night finds 232 servers not found by scanning during the day, scanning during the day finds 325 not found at night. These differences strongly suggest that host discovery done every 24-hours is affected by diurnal patterns. The shortfall of probing once a day may be due to the use of fewer probes. When we compare alternative probes at day and night, we can keep 17 probes as in day- or night-only, but factor out the time of day. In this case we see performance like day-only probing. This result suggests that number of probes is more important than capturing day-only or nightonly servers. Ultimately, by reducing the probe frequency we reduce our completeness by 8% after 18 days.
5. SENSITIVITY Section 4 presented the general results of our work, but deployment of either passive or active measurement requires understanding of a number of parameters, including when and how frequently to perform active probes and completeness of passive observation. We evaluate these factors here to understand their effect on our general results.
5.1 Time and Frequency of Active Probing Our results in Section 4 based on active probing rely on probes done periodically at set intervals. In this section we explore how the time of day and the frequency of these probes affects active probing service discovery. In datasets D TCP1-18d and D TCPbreak , active probes occur every 12 hours. Each scan started daily at 11am and then again at 11pm and took 90–120 minutes to cover the address space. We expect that the time these probes were done directly affects the number of servers discovered. To evaluate the effect of probe time-of-day we re-examine D TCP1-18d . We take the full D TCP1-18d , with both passive and active discovery, as ground truth. We compare three time-of-day dependent subsets against this baseline. First, we select the 17 probes taken every 24 hours in the daytime (11am) or at night (11pm). While these subsets capture time-of-day dependence, they also have the scan frequency and so are not directly comparable to the 35-probe
5.2
Partial Perspectives in Passive Monitoring
Ideally passive monitoring sees all traffic to and from the monitored network. However, this complete viewpoint may be difficult to achieve at multi-homed sites. The problem can be further complicated by policy restrictions which may limit the type of traffic transferred over monitored links. 11
service port Passive Active definitely open (UDP response) possibly open no response from any probed port definitely closed (ICMP response)
All 37
Web 80 0
DNS 53 32
NetBIOS 137 4
Gaming 27015 1
116 4,862 6,359 9,826
0 137 9,687
52 376 9,449
64 4,238 5,572
0 111 9,713
7: Summary of UDP services discovered. In this section we evaluate two types of partial perspectives in passive monitoring: homogeneous partial perspectives where unmonitored links carry traffic of a similar composition to monitored links, and heterogeneous partial perspectives where unmonitored links have different policy restrictions from monitored links and therefore carry a different composition of traffic. Our university connects to the internet through a regional network that has three peerings with commercial ISPs; in addition we have an Internet2 connection. For most of our datasets we monitor two of the three commercial peerings of our university’s regional network, and we estimate we capture 99% of all university traffic not destined to Internet2. For dataset D TCPbreak , we also monitored our university’s Internet2 peering. To evaluate our partial observation of a network we would like to compare a full and partial observation. However, as described in Section 3.2, we do not have a complete monitoring view. While we cannot compare a complete view of traffic to a partial view, we can look at how subsets of our observation affect completeness of our results. To evaluate the effect of homogeneous partial perspectives we use datasets D TCP1-18d and D TCPbreak in which we monitored two commercial links. We can then compare servers found exclusively on each links to see how the homogeneous partial perspective of monitoring only one of the commercial links, and not both, would affect our results. Table 8 summarizes the number of servers found from each link (and possibly on other links) as well as the number of servers found exclusively on a specific link. In both D TCP1-18d and D TCPbreak both commercial links see the majority of total servers found, with a range of 0.05– 9.5% of the servers found exclusively on a single commercial link. Given the high number of servers found on both commercial links in both D TCP1-18d and D TCPbreak (89–96%), we conclude that a homogeneous partial perspective does not greatly affect core results. To evaluate the effect of heterogeneous partial perspectives, we use dataset D TCPbreak in which we monitored our university’s Internet2 peering, as well as the two commercial links monitored in our other datasets. We can then look at service discovery over the unrestricted commercial links and compare this discovery to service discovery over the Internet2 peering which is restricted by Internet2’s academic-only policy. The D TCPbreak in Table 8 summarizes the number of servers found from our monitored commercial links as well as an Internet2 link. Though both commercial links observe most servers, the Internet2 link observes only about 36% of the servers in D TCPbreak . We conclude that policies placed on monitored links can strongly affect service discovery with
passive monitoring, though the effect is greatly dependent on the restrictiveness of the policy. From these results we can also conclude that given the very small number of servers seen exclusively on Internet2 (3 servers total), an addition of Internet2 data to our main datasets (D TCP1-18d and D TCP1-90d ) would not greatly affect our results or change our conclusions.
5.3
Passive Monitoring with Sampled Observations
Our observation system is able to collect and process a complete trace because our link speeds are fairly low (1Gb/s), we only collect packet headers (64B/packet), and we only process TCP packets with SYN-ACK flags set. However, passive monitoring becomes hard at very high bitrates, such as a 10Gb/s link speed or shifting to deeper packet inspection. An alternative to collecting a complete packet header trace is to sample packet headers and observe only a fraction of the traffic on a link. In this section we explore the effect of using various sampling durations on service discovery in passive monitoring. There are several possible approaches to sampling: observing and then idling for a fixed period of time, collecting a fixed number of packet headers and then idling, or collecting each packet header with some (non-unity) probability. These approaches are increasingly amenable to higher speed or hardware realizations. Here we consider only sampling for fixed durations; evaluation of other kinds of sampling is left as future work. We return to dataset D TCP1-18d to evaluate the effects of fixed-period sampling. In Figure 8 we sample data from the first 2, 5, 10 and 30 minutes of each hour (3%, 8%, 16%, and 50% of the data, respectively) and compare how each sample duration affects service discovery throughout the 18 day trace period. As in previous sections, we define ground truth as the union of servers found both passively and actively throughout the full dataset D TCP1-18d , then evaluate sampled data for completeness against this ground truth. As expected, capturing a greater portion of the data provides a closer match to a complete observation. However, the relationship between sampling and coverage is not linear— capturing only 50% of the data does not require doubling the observation period to get the same results. In fact, sampling at 30 minute durations is almost as effective as monitoring continuously, with only a 5% drop in the number of servers discovered over 18 days. Capturing only 16% of the data results only in an 11% drop in discovered servers. The relationship between sampling duration and cumulative discovered servers is not directly proportional primarily because of the effect of external scans. As described in Sec12
link Commercial 1 Commercial 2 Internet2 all
servers found in D TCP1-18d D TCPbreak duplicative exclusive duplicative exclusive 1,874 (89%) 201 (9.5%) 1,770 (96%) 59 (3.2%) 1,874 (89%) 39 (1.8%) 1,711 (93%) 1(.05%) — — 669 (36%) 3 (.16%) 2,111 — 1,835 —
Percent of total servers found by continuous monitoring
8: Summary of servers found on each of the three monitored links. measurements, and the effects of sampling on passive monitoring. There has been considerable interest in passive monitoring, leading to a number of widely used tools. De MontignyLeboeuf et al. discuss how a variety of information can be obtained through passive monitoring and how this information can be used to aid in policy enforcement and intrusion detection [12]. Tools such as P0f (Passive OS Fingerprinting) rely on examination of packet content (although they can also be used in active mode). Intrusion detection systems such as Bro [13] and Snort [3] rely mostly on passive monitoring to maintain situation awareness. Dayioglu et al. discuss how intrusion detection systems can benefit from using a hybrid approach of both active and passive methods [6]. Examples of hybrid approaches include Prelude, a hybrid IDS framework that combines a large number of other tools (e.g., Snort and Nessus), and Ettercap, a suite of attack tools for man-in-the-middle attacks. This work offers important insight into the power of passive monitoring, and our approach could benefit from their sometimes more sophisticated forms of monitoring. However, our work adds to this work a quantitative comparison between passive and active methods. For our work we used Nmap [2] to perform active probing, but there are a number of other network scanning tools available. Popular scanners such as Nessus [1], offer a large number of tools to assess services and identify specific vulnerabilities in a network. Though all of these tools, including Nmap, offer optimizations and vulnerability identification not studied in this paper, the core principle of active probing remains the same and our work can capitalize on better methods of active probing as they become available. Our work complements these tools, however, by indicating cases that passive monitoring can miss, such as transient hosts. Finally, passive monitoring has been widely used for traffic analysis and modeling (some examples include traffic engineering [7], web [16] and peer-to-peer [8] workloads, and model parameterization [11]). Our work differs from this work in that we explore service discovery rather than modeling or analysis of a particular service’s traffic. Our passive monitoring shares with this work the same set of questions about completeness when monitoring is only partial.
80 70 60 50 40 30 20
2 minute samples 5 minute samples 10 minute samples 30 minute samples No sampling
10
0 09-18 09-20 09-22 09-24 09-26 09-28 09-30 10-02 10-04 10-06 10-08
Time (month-day)
8: Cumulative server discovery with different duration, fixed-period sampling. tion 4.3, external scans are important to the completeness of passive monitoring. Since scans are often rapid but short, whether or not a scan is caught in sampled observation affects the coverage of that observation. Full and 30-minute samples both are greatly aided by scans on 9-20 in Figure 8, while the servers found in this scan are likely found by a different scan on 9-22 for the 5- and 10-minute samples.
6. RELATED WORK Beyond qualitative evaluations in trade publications [15], there has been little evaluation of passive service discovery in the research community and even less comparing passive methods to periodic active scans for service discovery. Closest to our work is Webster et al. [19], where they passively monitored 800 workstations and servers located in a network demilitarized zone (DMZ). for a period of 86 days. All 800 hosts were actively probed twice: once ten days before the beginning of the passive study and once more at the end. Our work was independently developed and differs in many ways. We perform multiple active probes periodically during passive monitoring. Our host population is much larger and much more diverse, including multiple types of transient and dynamic hosts. Thus our study includes many additional dimensions such as the effectiveness of active discovery over multiple scans initiated at different times of the day, the effectiveness of both passive/active techniques for discovering services on transient and dynamic hosts, and the unintentional effects of external scans. Our study also covers additional metrics for measuring completeness, including a popularity metric derived independently from passive
7.
CONCLUSIONS
Service discovery is vital for protecting and administrating networks across organizational boundaries, as well as monitoring and researching growth trends. Often, constraints such as time and privacy concerns, limit the frequency of active scans and/or the duration of passive monitoring, and it is important to understand how these constraints affect results. In this paper, we quantified a variety of factors that 13
directly impact passive and active service discovery. We have shown that passive and active service discovery are complimentary methods for discovering services on a network. While active discovery finds servers without relying on client activity, it misses services not available at the time of probing and those which actively block probes. Passive discovery quickly finds very popular services, even if these services are protected by firewalls. Over time, passive discovery is able to find intermittent and protected services that are missed by active probing. Interestingly, this process is greatly aided by external, potentially malicious scans.
[13]
[14]
Acknowledgements
[15]
We would like to thank Jim Pepin, Walter Prue, and Sanford George of Los Nettos, and Maureen Dougherty, Mark Baklarz and Brian Yamaguchi of USC for supporting the collection of our datasets. We thank Fabio Silva who carried out early proof-of-concept passive surveys.
[16]
8. REFERENCES
[17]
[1] Nessus vulnerability scanner. http://www.nessus.org. [2] Nmap (“Network Mapper”). http://insecure.org/nmap/. [3] Snort. http://www.snort.org/. [4] M. Bawa, H. Deshpande, and H. Garcia-Molina. Transience of peers and streaming media. In Proceedings of the I, pages 107–112, Princeton, NJ, USA, October 2002. [5] D. Box, D. Ehnebuske, G. Kakivaya, A. Layman, N. Mendelsohn, H. F. Nielsen, S. Thatte, and D. Winer. Simple object access protocol (soap) 1.1. Technical Report NOTE-SOAP-20000508, W3C, May 2000. ¨ [6] B. Dayioglu and A. Ozgit. Use of passive network mapping to enhance signature quality of misuse network intrusion detection systems. 2001. [7] Nick Duffield and Matthias Grossglauser. Trajectory sampling for direct traffic observation. In Proceedings of the ACM SIGCOMM Conference, pages 179–191, Stockholm, Sweeden, August 2000. ACM. [8] Krishna P. Gummadi, Richard J. Dunn, Stefan Saroiu, Steven D. Gribble, Henry M. Levy, and John Zahorjan. Measurement, modelling, and analysis of a peer-to-peer file-sharing workload. In Proceedings of the 19th Symposium on Operating Systems Principles, pages 314–329, Bolton Landing, NY, USA, October 2003. ACM. [9] A. Hussain, G. Bartlett, Y. Pryadkin, J. Heidemann, C. Papadopoulos, and J. Bannister. Experiences with a continuous network tracing infrastructure. In Proceedings of the ACM SIGCOMM Workshop on Mining network data Mine Net, pages 185–190, Philadelphia, PA, USA, August 2005. [10] M. Krzywinski. Port knocking: Network authentication across closed ports. SysAdmin Magazine, 12(6):12–17, June 2003. [11] Kun-Chan Lan and John Heidemann. Rapid model parameteration from traffic measurement. ACM Transactions on Modeling and Computer Simulations, 12(3):201–229, July 2002. [12] A. De Montigny-Leboeuf and F. Massicotte. Passive network discovery for real time situation awareness. In
[18]
[19]
14
Proceedings of the The RTO Information Systems Technology Panel (IST) Symposium on Adaptive Defence in Unclassified Networks, pages 288–300, November 2004. V. Paxson. Bro: a system for detecting network intruders in real-time. Computer Networks (Amsterdam, Netherlands: 1999), 31(23–24):2435–2463, 1999. J. Rosenberg, H. Schulzrinne, A. Johnston G. Camarillo, J. Peterson, M. Handley R. Sparks, and E. Schooler. SIP: Session initiation protocol. RFC 3261, Internet Request For Comments, June 2002. D. Schweitzer. Two sides of vulnerability scanning. http://www.computerworld.com/, February 2005. F. Donelson Smith, Felix Hernandez, Kevin Jeffay, and David Ott. What TCP/IP protocol headers can tell us about the web. In Proceedings of the ACM SIGMETRICS, pages 245–256, Cambridge, MA, USA, June 2001. ACM. Sun Microsystems. RPC: remote procedure call protocol specification version 2. RFC 1057, Internet Request For Comments, June 1988. The PREDICT Program. Predict: Protected repository for the defense of infrastructure against cyber-threats. http://www.predict.org, January 2005. S. Webster, R. Lippmann, and M. Zissman. Experience using active and passive mapping for network situational awareness. In Proceedings of the 5th IEEE International Symposium on Network Computing and Applications, pages 19–26, July 2006.