Kiyoshi, T. and Michael, P. Kane (2006) Improved high-pressure liquid chromatographic method for ... El-Rabbat, N.; Askal, HF.; Khashaba, PY. and Attia, NN.
Chemical and Process Engineering Research ISSN 2224-7467 (Paper) ISSN 2225-0913 (Online) Vol.35, 2015
www.iiste.org
Uni and Simplex Optimization for the Spectrophotometric Determination of Erythromycin ethylsuccinate Drug via ChargeTransfer Complex Formation Sarmad Dikran, Alaa Mohammed, Ali Mahmood* Department of Chemistry, College of Education for Pure Science – Ibn Al Haitham, University of Baghdad, Iraq Abstract Charge transfer complex formation method has been applied for the spectrophotometric determination of erythromycin ethylsuccinate, in bulk sample and dosage form. The method was accurate, simple, rapid, inexpensive and sensitive depending on the formed charge- transfer complex between cited drug and, 2,3Dichloro-5,6-dicyano-p- benzoquinone (DDQ) as a chromogenic reagent. The formed complex shows absorbance maxima at 587 nm against reagent blank. The calibration graph is linear in the ranges of (10 - 110) µg.mL-1 with detection limit of 0.351µg.mL-1. The results show the absence of interferences from the excipients on the determination of the drug. Therefore the proposed method has been successfully applied for the determination of erythromycin ethylsuccinate in pharmaceutical preparations. Keywords: Simplex, Spectrophotometric, Erythromycin ethylsuccinate , Charge- transfer. Introduction Erythromycin is the most employed macrolide antibiotic for treating a myriad of infections caused by grampositive bacteria such as anthrax, tonsillitis, otits media and syphilis [1,2], it is often prescribed as an alternative for patient allergic to penicillin [2,3]. It has been also employed a as part of therapeutic cocktails together with amino glycoside antibiotics that covers gram-negative microorganisms [3]. Erythromycin is available in several forms including estolate, ethysuccinate and stearate [2,4]. The chemical structure of erythromycin ethysuccinate is given in (Scheme 1).
Scheme 1: The chemical structure of erythromycin ethylsuccinate Several methods have been reported for determination of erythromycin ethylsuccinate in bulk and pharmaceutical dosage forms, these methods include liquid chromatography [5-11], high performance liquid chromatography[12-15], liquid and solid extraction[16,17], Potentiometry [18], voltammetry[19] and Spectrofluorimetry[20,21]. Spectrophotometry [22-25] are most convenient techniques because of their inherent simplicity, adequate sensitivity, low cost and wide availability in all quality control laboratories. In experimental chemistry, the optimization of technical system is the process of the adjusting of the control variables to find the levels that achieve the best optimization. Usually, many conflicting response must be optimized simultaneously. In lack of systematic approaches the optimization is done by trial and error, or by changing one control variable at a time while holding the rest constant, such methods requires a lot of experiments to be carried out. Simplex optimization of experimental parameters was first introduced by Spendley [26], and then modified by Nelder [27] and Aberg [28]. Simplex is a geometric figure in which there are n +1 vertices, where (n) represents the number of variables [29], the method found a lot of applications in field of analytical chemistry [30-32], because it offers the capability of optimizing several factors simultaneously depending on a statistical design search to find out
7
Chemical and Process Engineering Research ISSN 2224-7467 (Paper) ISSN 2225-0913 (Online) Vol.35, 2015
www.iiste.org
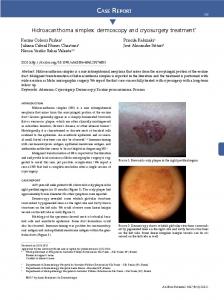
the maxima or minima of response, by rejecting the point producing the worst response and a replacement of it by the new point which is obtained statistically. The present work describes the utility of 2,3-Dichloro-5,6-dicyano-p-benzoquinone (DDQ) reagent for spectrophotometric determination of erythromycin ethylsuccinate in pure form as well as in these dosage forms. In addition, the optimization of chemical dependent variables of affecting absorbance has been studied by using modified simplex method via computer program. Apparatus A cintra 5 spectrophotometer with 1 cm quartz cells were used for absorbance measurements. PH-meter DW9421 from Philips instrument, a Sartorius BL 210S balance, and a Pentium 4 computer (DELL) was used for data processing. Experimental Material and reagents All chemicals used were of analytical reagent grad unless otherwise is mentioned, erythromycin ethylsuccinate, standard powders (purity 99.8%) were kindly provided by the State Company for Drug Industries and Medical Appliances, Samara-Iraq (SDI). DDQ 0.1 %( w/v) solution, was prepared by dissolving 0.01 g of the DDQ in 5 mL of acetonitrile and then the solution was diluted to a final volume 10 mL with acetonitrile. Working solutions were freshly prepared by subsequent dilutions. This solution is prepared daily using red- glass volumetric flask because it is a light sensitive reagent. Standard drugs solutions Erythromycin ethylsuccinate stock solution (1000 µg.mL-1 ), was prepared by dissolving 100 mg of erythromycin ethylsuccinate in 10mL methanol and diluting to 100mL in a volumetric flask with acetonitrile. Working solutions were freshly prepared by subsequent dilutions. General recommended procedure In a series of 5 mL volumetric flasks, 0.2 mL of 0.1 % of DDQ solution was added to aliquot volumes of the standard erythromycin ethylsuccinate stock solution containing (50-550 µg). The resulted mixtures were diluted to volume with acetonitrile. The absorbance of each solution was recorded at the λmax of the formed chargetransfer complex (585.5 nm) against reagent blank which prepared by the same manner, but without addition of erythromycin ethylsuccinate. Analysis of Erythromycin ethylsuccinate in pharmaceutical preparations The content of 10 capsules were mixed well and a certain amount of fine powder was accurately weighted to give an equivalent to 250 mg for capsules and dissolve in 50 mL of methanol, swirled, leaved to stand for 5 mints and diluted to 100mL in a volumetric flask with acetonitrile. The solution then was filtered by using Whatman filter paper No.41 to avoid any suspended or undissolved material before use, and the first portion of the filtrate was rejected, Working solutions were freshly prepared by subsequent dilutions with acetonitrile and analyzed by the recommended procedure. Results and discussion Spectrophtometric procedures are popular for their sensitivity in the assay of drugs and hence, charge-transfer complex formation has received considerable attention for the quantitative determination of many pharmaceutical compounds [33-36]. Erythromycin ethylsuccinate react with DDQ to give yellow color charge-transfer complex, which exhibits absorption maxima at 585.5 nm against their reagent blank (Figure1). The some bands may be attributed to the formation of DDQ radical anion, which probably resulted from the dissociation of the donor-acceptor complex in relatively high polar solvents like acetonitrile [36]. Therefore, in order to avoid the maximum interference from the reagent blank, the absorbance measurements were carried out at 585.5 nm in the subsequent work.
8
Chemical and Process Engineering Research ISSN 2224-7467 (Paper) ISSN 2225-0913 (Online) Vol.35, 2015
www.iiste.org
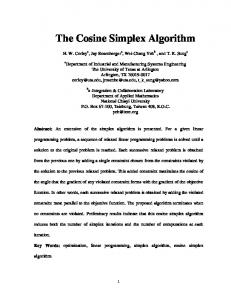
Figure1: Absorption spectra of (A) 50 µg.mL-1 erythromycin ethylsuccinate-DDQ charge-transfer complex, (B) the blank solution under the recommended procedure Optimization of experimental variables I. Univariable method The experimental variables affecting the development and stabilities of charge-transfer complex formation were achieved through a number of preliminary experiments. Such factors include reagent volume, reaction time, temperature, and the type of organic solvent. For this reason, a variable was modified while maintaining the other variables at their constant values, then by maintaining that variable at its optimized value, another was modified; all variables were optimized via this method. Effect of reagent volume In order to predict the optimum required amount of DDQ for quantitative reaction with erythromycin ethylsuccinate, different volumes (0.1 – 1.0 mL) of 0.1% solutions of DDQ were tested. The results shown in Figure 2 indicate that increasing the volume of DDQ has a positive effect on the absorption signal of the formed complex up to 0.2 mL, while larger volumes of reagent solution have reverse effect. This may be attributed to the possibility of formation of new species upon the reaction of erythromycin ethylsuccinate with relatively higher amounts of the reagent, which may absorb radiation at different wavelengths. Therefore, 0.2 mL of 0.1 % solutions of DDQ was found to be the optimum amount, since it results in maximum color intensity with minimal blank reading.
Figure 2: Effect of reagent amount on the absorbance of 50 µg.mL-1 erythromycin ethylsuccinate Effect of reaction time The optimum reaction time is determined by following the color development at ambient temperature (25 ± 2 °C). It was found that the reaction of erythromycin ethylsuccinate with DDQ, under the conditions of the study, is instantaneous, and the formed complex attained maximum absorbance immediately after mixing. The developed color remained strictly unaltered for at least 2 hours in dark place. Effect of temperature The optimum reaction temperature was determined by following the color development at ambient temperature in the range from (25 - 50 ± 2°C). It was found that. The value of the absorbance starts to decrease considerably when reaction temperature raised, this may be due to decomposition of the formed charge transfer complex.
9
Chemical and Process Engineering Research ISSN 2224-7467 (Paper) ISSN 2225-0913 (Online) Vol.35, 2015
www.iiste.org
According to the obtained results, room temperature (i.e. 25 ± 2°C) was selected as an optimum temperature for maximum color production (Figure 3). 0.255
Absorbance
0.254
0.253
0.252
0.251 20
30
40
Temperature (°C)
50
Figure 3: Effect of temperature on the absorbance of 50 µg.mL-1 erythromycin ethylsuccinate; 0.1% DDQ Effect of organic solvent Several organic solvents, namely acetonitrile, dichloromethane, chloroform, methanol, benzene, 1,2dichloroethane, in addition to water, were examined for their ability to solvate the reaction constituents and to results in maximum absorbance for erythromycin ethylsuccinate – DDQ charge transfer complex. Acetonitrile was found to be the most suitable solvent e to achieve quantitative recovery of erythromycin ethylsuccinate complex (Table 1) Table 1: Effect of different types of solvent on the determination of 50 µg.mL-1 erythromycin ethylsuccinate; 0.1% DDQ Solvent Absorbance Acetonitrile 0.255 Dichloro methane 0.224 Chloroform 0.155 Methanol 0.116 Benzene 0.062 1,2-Dichloro ethane 0.021 Water 0.042 II. Simplex method Simplex method used to optimize the required reagent volume, reaction time and the reaction temperature. After choosing the convenient boundary conditions for each of the mentioned control variables (Table 2). Table 2: Boundary of Simplex indeprndent variables for determination of erythromycin ethylsuccinate Variable Range Step size Reagent volume (mL) 0.1-0.5 0.1 Reaction Time (min.) 0-20 5.0 Temperature (°C) 25-45 5.0 Four arbitrary experimental conditions should were carried out and when the results were entered to the Multi-simplex program points (1 to 4), the Simplex program starts to reflect the worst point through the centroid of other points to obtain a new point 5. An experiment was then performed utilizing the variable setting as a reflected point; because this value was better than that at point 1, the latter was rejected and replaced by point 5. A measured absorption signal was feeding again to the program and the process is repeated successively until the optimum conditions are obtained and were similar to those obtained by the univariate method. (Table 3).
10
Chemical and Process Engineering Research ISSN 2224-7467 (Paper) ISSN 2225-0913 (Online) Vol.35, 2015
www.iiste.org
Table 3: Multivariate experiments (Simplex optimization) of the experimental condition for the determination of 50 µg.mL-1 erythromycin ethylsuccinate Reagent volume Reaction time Temperatur Exp. No. Abs. Operation (mL) (min.) (°C) 1 0.1 0 25 0.215 2 0.3 5 30 0.248 3 0.4 15 35 0.224 4 0.5 10 45 0.221 5 0.5 15 45 0.212 R 6 0.2 5 30 0.251 C 7 0.1 5 25 0.210 R 8 0.4 10 40 0.234 C 10 0.1 0 30 0.211 R 11 0.3 10 35 0.249 C 12 0.1 0 25 0.215 R 13 0.2 10 35 0.242 R 14 0.2 0 30 0.253 C 15 0.2 0 25 0.255 E 16(12) 0.1 0 25 0.215 E 17(12) 0.1 0 25 0.215 C 18 0.3 0 25 0.252 C 19(12) 0.1 0 25 0.215 R 20(2) 0.3 5 30 0.248 C 21 0.1 5 30 0.198 R 22(12) 0.1 0 25 0.215 C 23 0.4 5 30 0.246 R Calibration graph Employing the optimum experimental conditions, a linear calibration graph for the determination of erythromycin ethylsuccinate, by charge-transfer complex formation with DDQ, was obtained (Figure 4), which shows that Beer's law was obey in the concentration range of (10 -110) µg.mL-1, with a correlation coefficient (R= 0.9993) and detection limit of 0.351 µg.mL-1.
Absorbance
0.6
y = 0.0053x - 0.0125 R² = 0.9988
0.4
0.2
0 0
20
40
60
80
100
120
Concentration of the Drug (µg.mL-1) Figure 4: Calibration graph of erythromycin ethylsuccinate under optimum experimental conditions Spectral characteristics of the proposed method Under optimum experimental conditions of the proposed method, the regression plot showed linear dependence of absorbance signals on the concentrations of the studied drug in the range given. The regression equations, correlation coefficients, molar absorptivities, detection limits and sandell sensitivity in addition to other parameters are given in Table 4.
11
Chemical and Process Engineering Research ISSN 2224-7467 (Paper) ISSN 2225-0913 (Online) Vol.35, 2015
www.iiste.org
Table 4: Spectral characteristics and statistical data of the regression equation for determination of erythromycin ethylsuccinate via charge transfer formation Parameter Value λmax (nm) 585.5 Color yellow Linearity range (µg.mL-1) 10.0-110.0 Molar absorptivity(L.mol-1.cm-1) 4568.918 Regression equation A = 0.0053 [Cim. µg.mL-1] + 0.0125 Calibration Sensitivity 0.0053 Sandell's Sensitivity (µg.cm-2) 188.679 Correlation of Linearity (R2) 0.9988 Correlation coefficient (R) 0.9993 Detection limit (µg.mL-1) 0.351 Stoichiometry of the complex To establish structure of the complex formed between erythromycin ethylsuccinate and DDQ, slope analysis method Figures (5 and 6) and Job's method of continuous variation (Figure 7) have been. The results showed that the formed complex constructed with ratio of 1:1 (erythromycin ethylsuccinate: DDQ) .A proposed structure for the formed complex could be represented as in (Scheme 2). The possible mechanism for the reaction based on the formation of an original donor-acceptor (DA) complex through the interaction between tertiary amine group of erythromycin ethylsuccinate (electron donor) and DDQ (π - acceptor). On the other hand, the dissociation of DA complex is promoted by the high ionizing power of the solvent where a complete electron transfer from the donor to the acceptor moiety takes place, followed by formation of the DDQ radical anions as a predominant chromogen [25]. 0.6
Absorbance
y = 4579.x - 0.014 R² = 0.9980 0.4
0.2
0 0.00000
0.00004
0.00008
0.00012
Concentration of the Drug (mol.L-1) Figure 5: Results obtained for the slop ratio method, with variable concentrations of Erythromycin ethylsuccinate; (1.762x10⁻⁴MDDQ) 1.0
y = 4513x - 0.305 R² = 0.9941
Absorbance
0.8 0.6 0.4 0.2 0.0 0.00010
0.00015
0.00020
0.00025
Concentration of DDQ (mol.L-1) Figure 6: Results obtained for the slop ratio method, with variable concentrations of DDQ; (1.160x10⁻⁴ M erythromycin ethylsuccinate) Ratio = Slope R / Slope D =4513 / 4579 = 0.986 ≈1
12
Chemical and Process Engineering Research ISSN 2224-7467 (Paper) ISSN 2225-0913 (Online) Vol.35, 2015
www.iiste.org
0.25
Absorbance
0.20 0.15 0.10 0.05 0.00 0
0.2
0.4
0.6
0.8
1
(VD/VD+VR) Figure 7: Continuous variation of 5.80 x10⁻⁴ M erythromycin ethylsuccinate; 5.80 x10⁻⁴ M DDQ
Scheme 2: The proposed structure of the formed complex illustrating the possible charge transition between donor and acceptor
13
Chemical and Process Engineering Research ISSN 2224-7467 (Paper) ISSN 2225-0913 (Online) Vol.35, 2015
www.iiste.org
Accuracy and precision The accuracy and precision of the proposed method was checked by analyzing three replicates of three different concentration levels of the drug (within Beer's law range). The accuracy was determined by calculating the relative error percentage, while the precision was tested by calculating the percentage relative standard deviation (%RSD). The results indicated good accuracy with reasonable precision of the proposed method (Table 4). The proposed method was advantageous when compared statistically with other methods found in the literature in having good sensitivity and the results are shown in Table 5. Table 4: Evaluation of accuracy and precision for the determination of erythromycin ethylsuccinate Conc. ((µg.mL-1) Relative Error % R.S.D.* % Taken Found* 40 39.400 -1.500 1.635 70 69.570 -0.614 0.824 100 98.906 -1.694 1.367 *Average of three determinations. Table 5: Analytical parameters for the analysis of erythromycin ethylsuccinate by the proposed and others methods ε Correlation Ref. Linear range Recovery L.mo-l. methods Coefficient ( RSD% -1 No. µg.mL % cm-1 R) Spectrophotometric 3.0-15.0 37.43 0.9836-0.9892 97.6 0.48 23 Direct UV 3.0-15.0 44.03 0.9917-0.9967 106.5 0.65 1st Derivative Spectrophotometric 37 2.0-61.0 98.4-103.6 1.4-4.4 Ion-Pair Less than 6 High-pressure L.C. 60.0-120.0 99.9 1.0 % 38 Extraction 0.4.0-56.0 1.3 25 Charge transfer 1.724-129.3 8500 98.3 0.01439 Spectroflurimetric 0.0426-1.2 98.3-100.8 0.058 40 Charge transfer 1.0-80.0 9910 97 98.5000.824Proposed method 10.0-110 4568.918 0.9993 99.386 1.635 Interferences study The results showed that no interferences were found in the presence of up to 500 µg.mL-1 of the studied excipients (lactose, sucrose, starch, glucose, magnesium stearate and sodium citrate) in the determination of cimetidine (Table 6). Table 6: Percent recovery for 40 µg.mL-1of erythromycin ethylsuccinate in the presence of 500 µg.mL-1of excipients Erythromycin Ethylsuccinate Conc. Taken (40 µg.mL-1) Excipients Conc. Found (µg.mL-1) %Recovery Lactose 40.012 100.030 Sucrose 40.104 100.260 Starch 39.746 99.3650 Glucose 39.672 99.180 Magnesium Stearate 39.818 99.545 Sodium Citrate 40.204 100.510 *Average of three determinations. Analysis of dosage forms The applicability of the proposed method for the determination of erythromycin ethylsuccinate in commercial dosage form was examined by analyzing of their content of the active ingredient by the proposed method (charge-transfer complex formation). The results given in Table 7, reveal that the recoveries were in the range of, reflecting high accuracy and precision of the proposed method as indicated by low percentage relative standard deviation value. The recommended method was statistically compared with other methods, no significant
14
Chemical and Process Engineering Research ISSN 2224-7467 (Paper) ISSN 2225-0913 (Online) Vol.35, 2015
www.iiste.org
differences were found between the calculated and theoretical values of t and F- test at 95% confidence limit (Table 8). Table 7: Spectrophotometric determination of erythromycin ethylsuccinate in pharmaceutical preparations via charge-transfer complex formation with DDQ Labeled Found Conc. Conc.* amount amount Recovery R.S.D* taken Found (mg) % % Sample (mg) (µg.mL-1) (µg.mL-1) Erythrosam Erythromycin Ethyl Succinate 250 250mg/ Cap. SDI/Iraq Erythronin Erythromycin Ethyl Succinate 250 250mg/ Cap. NDI/Iraq Erythrodar Erythromycin Ethyl Succinate 250 250mg/ Cap. Jordan *Average of three determinations.
252.263
40
40.362
100.905
1.105
252.240
70
70.627
100.896
1.089
252.625
40
40.420
101.050
1.299
252.55
70
70.713
101.020
0.899
256.62
40
41.059
102.648
1.293
256.350
70
71.778
102.540
0.928
Table 8: t- and F-values for analysis of erythromycin ethylsuccinate in pharmaceutical compounds(S.D.I) Other Methods Ref. Proposed T-Valuesa F-valuesb No. Method, N xS.D N=3 0.369 10.426 (N=9) 9.800 1.400 37 S.D = 0.434 1.105 1.457 (N=8) 9.83 0.359 25 µ = 10.112 2.241 9.400 (N=6) 9.700 0. 140 40 Tc = 0.447 a- Theoretical values for t at 95% confidence limit were N=10(2.228), 9(2.262) and 7(2.365) respectively, b-Theoretical values for F at 95%were N=(8,2)(19.372), N=(2,7)(4.738) and N = (2,5)( 5.786) confidence limit respectively, C- Theoretical values for t at 95% confidence limit were N=2(4.303). Conclusions The utility of DDQ reagent for the spectrophotometric determination of erythromycin ethylsuccinate. was established. The method based charge-transfer complex formation between the cited drug and DDQ as a chromogenic reagent. The proposed method was found to be accurate, simple and sensitive. It was satisfactorily applied to the determination of erythromycin ethylsuccinate in pharmaceutical product samples. References 1. Alwan, Ala,dine, A. S. and Abou, Yousif, Z. (1990) Iraqi Drug Guide, 1st edition, NBSD, Iraq, 40-41. 2. British pharmacopeia (2007) CD. Rom, Majesty,s Stationary office, London , BP, Co.-UK. Electronic version 11. 3. Kanfer, I.; SKiner, M. F. and Walker, R. B. (1998) Analysis of macrolide antibiotics, Journal of Chromatography A, 812 (1/2). pp. 255-286. 4. Budavari, S. (2001) The Merck index”, New Jersy, Merck Company, Inc., Electronic version. 5. Wardrop, J.; Ficker, D.; Franklin, S. and Gorski, RJ.(2000) Determination of erythromycin and related substances in enteric-coated tablet formulations by reversed-phase liquid chromatography. J Pharm Sci., 89(9):1097-105. 6. Kiyoshi, T. and Michael, P. Kane (2006) Improved high-pressure liquid chromatographic method for the analysis of erythromycin in solid dosage form, Journal of Pharmaceutical sciences, 71(10):1160-1164. 7. Jennifer, S.Ridlen; David R. Skotty; Peter T. Kissinger and Timothy A. Nieman(1997) Determination of erythromycin in urine and plasma using microbore liquid chromatography with tris(2,2′bipyridyl)ruthenium(II) electrogenerated chemiluminescence detection, Journal of Chromatography B,
15
Chemical and Process Engineering Research ISSN 2224-7467 (Paper) ISSN 2225-0913 (Online) Vol.35, 2015
8.
9.
10. 11.
12. 13.
14.
15. 16.
17.
18.
19.
20. 21.
22.
23.
24.
25. 26. 27. 28. 29. 30.
www.iiste.org
694(2): 393-400. Deubel A.; Frandino AS.; Sorgel F. and Holzgggrabe U. (2006) Determination of erythromycin and related substances in commercial samples using liquid chromatography/ion trap mass spectrometry, Journal of Chromatogr A.; Dec; 1136(1):39-47. Zhiling, C.; Bing, L.; Weiwei, L.; Yinxing, S.; Wenming, B. and Guowei, Y. (2013) A Validated RP-LC Method for the Determination of Erythromycin an Oxime and Related Substances, Advance, Journal of Food Science and Technology 5(1): 68-71. Deubel, A. and U. Holzgrabe, (2007) Development of an enhanced separation of erythromycin and its related substances by liquid chromatography. J. Pharm. Biomed. Anal., 43(2): 493-498. Sonia, T. Hassib; Awatef, E. Farag and Ehab, F. Elkady, (2011) Liquid chromatographic and spectrophotometric methods for the determination of erythromycin stearate and trimethoprim in tablets, Bulletin of Faculty of Pharmacy, Cairo University 49(2):81–89. Griessmann, K.; Kaunzinger, A.; Schubert-Zsilavecz, M. and Abdel-Tawab M.(2007) A rapid HPLC-UV method for the quantification of erythromycin in dermatological preparations, Pharmazie. 62(9):668-671. Nasr, M. M. and Stanley C. M. (1998) High Performance Liquid Chromatographic Assay of Erythromycin Salts and Esters in Bulk and Pharmaceutical Dosage Forms, Journal of Liquid Chromatography & Related Technologies, 21(8):1147-1160. Taninaka, C.; Ohtani, H.; Hanada, E.; Kotaki, H.; Sato, H.; and Iga, T. (2000) Determination of erythromycin, clarithromycin, roxithromycin, and azithromycin in plasma by high-performance liquid chromatography with amperometric detection, Journal of Chromatography B, 738(2): 405–411. Liawruangrath, B.; and Liawruangrath, S. (2001) High performance thin layer chromatographic determination of erythromycin in pharmaceutical preparations, Chromatographia, 54(5-6):405-408. Fahimeh, K.; Hossein, A.; Sanaz N. and Masoumeh, G. (2014) Determination of erythromycins in fermentation broth using liquid phase extraction with back extraction combined with high performance liquid chromatography, Arabian Journal of Chemistry, 7(3):292-296. Wei, R.; Rong C.; Zhaohui, Z.; Yuli, Y.; Fang, L.; and Xinxi, F. (2014) Fast separation and determination of erythromycin with magnetic imprinted solid extraction coupled with high performance liquid chromatography. An international journal to further the chemical sciences, 4(36):18503-18511. Mohammad. R. G.; Shirin, P.; Farnoush, F.; Hosein, A.;, Morteza, H. and Parviz N.(2011) NanoComposite Carbon Paste Electrode and PVC membrane Sensor for Potentiometric Determination of Erythromycin, Int. J. Electrochem. Sci., 6:1968-1980. Minh, N. P.; Lam, T. B. and Giao, N. T.(2011) Simultaneous determination of erythromycin A in giant prawn and tilapia in Mekong region by stripping square wave voltammetry, International Food Research Journal, 18(1):387-395. Khashaba, PY. (2002) Spectrofluorimetric analysis of certain macrolide antibiotics in bulk and pharmaceutical formulations. J Pharm Biomed Anal, 27: 923-932. El-Rabbat, N.; Askal, HF.; Khashaba, PY. and Attia, NN. (2006) A validated spectrofluorometric assay for the determination of certain macrolide antibiotics in pharmaceutical formulations and spiked biological fluids, Journal of AOAC International, 89(5):1276-1287. Amin, A S. and Issa, Y M. (1996) Selective spectrophotometric method for the determination of erythromycin and its esters in pharmaceutical formulations using gentiana violet, J Pharm Biomed Anal,14(11):1625-1629. Rattaya r, A.; Wachiranee, V.; Worapot, S.; and Leena, S. (2007) Simple and Rapid Spectrophotometric Method for the Analysis of Erythromycin in Pharmaceutical Dosage Forms, Journal of Food and Drug Analysis, 15(1):10-14 Rohini, W.; Suhasini, B.; Hiten, P.; Aruna P.; and Ram, P.; (2012) Analysis of Erythromycin and Benzoyl Peroxide in Combined Dosage form by UV-Visible Spectrophotometry, Int J Pharm Pharm Sci, 4 (4):527531. LI, J.; LIU M.; DU Xiang-Y. and LI, Quan-M. (2009) Charge Transfer Reaction between Erythromycin Ethylsuccinate and Salicyl Fluorone, Chinese Journal of Spectroscopy Laboratory, 26(3):519-523. Spendley,W.; Hext, G.R.; and Himusworth, F.R.T. (1962) application of Simplex designs inoptimisation and evolutionary Sequential operation, Journal of Technometrics, 4: 441-462. Nelder, J. A.; and Mead, R. A. (1965) Asimplex Method for Function Minimization, Computer Journal, 7:308-313. Aberg, E. R. and Gustavsson, A.G.T. (1982) Design and Evaluation of Modified Simplex Methods, Analytica Chemica Acta, 144:39-53. Walters, F. H.; Parker, L. R.; Morgan, S. L.; and Deming, S. N. (1991) Sequential Simplex Optimization, 1st, CRC Press,Inc., Boca Raton, Florida, 44. Momenbeik, F.; Momeniz, Z. and Kharasani, H., J. (2005) Separation and determination of Vitamins E and
16
Chemical and Process Engineering Research ISSN 2224-7467 (Paper) ISSN 2225-0913 (Online) Vol.35, 2015
31.
32.
33.
34. 35. 36.
37.
38. 39. 40.
www.iiste.org
A in multivitamin syrup using micellar liquid chromatography and simplex optimization, Journal of Pharmaceutical and Biomedical Analysis, 37(2):383-387. Murillo Pulgarn, J.A.; Alanon Molina, A.; Alanon Pardo. M.T. (2002) The use of modified simplex method to optimize the room temperature phosphorescence variables in the determination of an antihypertensive drug, Journal of Talanta, 57(4):795-805. Tinoi, J.; Rakariyatham, N. and Deming, R.L. (2005) Simplex optimization of carotenoid production by Rhodotorula glutinis using hydrolyzed mung bean waste flour as substrate, Journal of Process Biochemistry, 40(7):2551-2557. Abdullah, A. B. and Gamal A. M. (2013) Spectrophotometric Determination of Trimipramine in Tablet Dosage Form via Charge Transfer Complex, Tropical Journal of Pharmaceutical Research,12(6):10571063. Hesham, S. (2008) Analytical study for the charge-Transfer complexes of gabapentin African Journal of Pharmacy and Pharmacology, 2 (7):136-144. Najma, S.; Saeed, A. M. and Saeeda, N. A. (2013) The Use of Chloranilic Acid for the Spectrophotometric Determination of Three Macrolidesthrough Charge Transfer Complex, Med chem 3(3): 241-246. Ibrahim A. D.; Samiha A. H.; Ashraf M. M. and Ahmed I. H. (2007) Sensitive Spectrophotometric method for the determination of H2- receptor antagonists in Pharmaceutical Formulation, Int J Biomed Sci. Jun, 3(2):123–130. Da̧ browska, D.; Regosz, A.; Piȩkoś, R.; Mierzwa, M. and Paruch, B. (1990)A study of ion-pair formation between erythromycin and bromothymol blue, methylthymol blue, and thymol blue and their use for assaying erythromycin in dosage forms, Microchemical Journal, 41( 2): 210-218. Issa, Y. M. and Amin, A. S. (2001) Extraction-Colorimetric Method for the Determination of Erythromycin and its Esters in Dosage Forms Using Chromotropic Acid Azo Dyes, Analytical Letters, 34(7):1163-1173. Pakinaz, Y. K. (2002)Spectrofluorimetric analysis of certain macrolide antibiotics in bulk and pharmaceutical formulations, Journal of Pharmaceutical and Biomedical Analysis, 27, (6):923-932. Sun, S. (2004) Spectrophotometric Determination of Erythromycin Ethylsuccinate with Charge Transfer Reaction between Erythromycin Ethylsuccinate and Alizarin, Chinese Journal of Spectroscopy Laboratory, 21(6):1115-1118.
17
The IISTE is a pioneer in the Open-Access hosting service and academic event management. The aim of the firm is Accelerating Global Knowledge Sharing. More information about the firm can be found on the homepage: http://www.iiste.org CALL FOR JOURNAL PAPERS There are more than 30 peer-reviewed academic journals hosted under the hosting platform. Prospective authors of journals can find the submission instruction on the following page: http://www.iiste.org/journals/ All the journals articles are available online to the readers all over the world without financial, legal, or technical barriers other than those inseparable from gaining access to the internet itself. Paper version of the journals is also available upon request of readers and authors.
MORE RESOURCES Book publication information: http://www.iiste.org/book/ Academic conference: http://www.iiste.org/conference/upcoming-conferences-call-for-paper/
IISTE Knowledge Sharing Partners EBSCO, Index Copernicus, Ulrich's Periodicals Directory, JournalTOCS, PKP Open Archives Harvester, Bielefeld Academic Search Engine, Elektronische Zeitschriftenbibliothek EZB, Open J-Gate, OCLC WorldCat, Universe Digtial Library , NewJour, Google Scholar