Oct 16, 2009 - Armin de Greiff, and Mark E. Ladd, âDiffusive sensitiv- ity to muscle architecture: ... Alan S. Willsky, âFiber tract clustering on manifolds with dual ...
Author manuscript, published in "IEEE International Symposium on Biomedical Imaging : from Nano to Macro, Boston : United States (2009)"
UNSUPERVISED CLASSIFICATION OF SKELETAL FIBERS USING DIFFUSION MAPS R. Neji1,2,3 , G.Langs4 , J-F. Deux5 , M. Maatouk5 , A. Rahmouni5 , G. Bassez5 , G. Fleury3 , N. Paragios1,2 1
Laboratoire MAS, Ecole Centrale Paris, Chˆatenay-Malabry, France 2 Equipe GALEN, INRIA Saclay - ˆIle-de-France, Orsay, France 3 D´epartement SSE, Ecole Sup´erieure d’Electricit´e, Gif-sur-Yvette, France 4 CIR lab, Department of Radiology, Medical University of Vienna, Vienna, Austria 5 Centre Hospitalier Universitaire Henri Mondor, Cr´eteil, France
hal-00424543, version 1 - 16 Oct 2009
ABSTRACT In this paper, we propose an application of diffusion maps to fiber tract clustering in the human skeletal muscle. To this end, we define a metric between fiber tracts that encompasses both diffusion and localization information. This metric is incorporated in the diffusion maps framework and clustering is done in the embedding space using k-means. Experimental validation of the method is performed over a dataset of diffusion tensor images of the calf muscle of thirty subjects and comparison is done with respect to ground-truth segmentation provided by an expert. Index Terms— DTI, Fibers, Diffusion Maps, Fiber Metrics, Human Skeletal Muscle 1. INTRODUCTION Myopathies are neuromuscular diseases that result in a disorder in the muscoskeletal system of the human body whose symptoms are an atrophy and weakness of the muscles. They concern a significant part of the population: for instance, they affect 4 to 6 % of the European population (25 to 30 million persons). It is therefore important to harness the potential of emerging modalities like diffusion tensor imaging (DTI) to extract information about the impact of these diseases on the fiber architecture within the human skeletal muscle and to provide an assessment of the condition of a patient. A preliminary step towards this analysis is to classify the fibers obtained from DTI in anatomically coherent fiber bundles. While DTI studies of the skeletal muscle [1, 2] focused on the evaluation of scalar values derived from DTI images like trace, fractional anisotropy and pennation angles, fiber segmentation has attracted less attention than in the study of human brain white matter, where a rich literature of unsupervised classification methods was proposed. For instance, the method presented in [3] introduced manifold learning techniques in the area of fiber bundling by relying on Laplacian Eigenmaps. In [4], spectral clustering along with the Hausdorff distance between fibers is considered. In [5], another
manifold learning technique is proposed based on a graphbased distance that captures local and global dissimilarities between curves and uses Locally Linear Embedding for clustering of the tracts. In [6], the Expectation-Maximization algorithm is used by considering Gamma distributions on the distance maps between fibers and cluster centers. The method proposed in [7] considers medoid-shift clustering combined with an Isomap-like manifold learning and suggested to include prior knowledge in the segmentation process using a white matter fiber atlas. Mean-shift was also used in [8] where each fiber is first embedded in a high dimensional space using its sequence of points, and adaptive mean-shift clustering was applied. A differential-geometric approach was recently proposed in [9] where clustering was done recursively using a consistency measure between fibers. In this paper, we propose the combination of diffusion maps with a metric defined in the fiber domain to cluster the fibers of the human skeletal muscle. Diffusion maps were used for Orientation Distribution Function (ODF) segmentation in Q-ball images in [10], where spatial coherence was imposed using the Markovian relaxation of the affinity matrix. However the fiber domain provides no straightforward spatial neighborhood relationships like those given by the nearest neighbors in the 3D image grid. In the definition of the metric, we show how to impose spatial coherence in the fiber domain, while taking into account the information provided by the tensor field. The metric is used in the diffusion maps framework along with the k-means algorithm in the embedding space for clustering purposes. We build upon the method we proposed in [11], where we suggested an approach based on kernel principal component analysis for fiber clustering. In this work, diffusion maps are used to better reflect the manifold structure of the fiber tracts. 2. DIFFUSION MAPS Diffusion maps [12] are a spectral embedding of a set X of n nodes, for which local geometries are defined by a kernel k : X × X → R. The kernel k satisfies k(x, y) ≥ 0, and
k(x, y) = k(y, x). This kernel can be interpreted as an affinity between nodes. The resulting graph (an edge between x and y carries the weights k(x, y)) can be transformed into a reversible Markov chain by the socalled normalized graph Laplacian construction. A related construction was used in [13] to define a geometry on a set of observations, or trajectories. We define X k(x, y) . (1) s(x) = k(x, y) and p(x, y) = s(x) y
(2)
hal-00424543, version 1 - 16 Oct 2009
y
Therefore it can be interpreted as the probability of the transition from node x to node y in one time step, or a transition kernel of a Markov chain. It gives a diffusion operator X P f (x) = a(x, y)f (y)dµ(y), (3) P is the Markov matrix with the entries p(x, y) and its powers P τ allow to propagate information through the Markov chain in τ timesteps according to the transition kernels. The operator P defines a geometry which can be mapped to an Euclidean geometry by an eigenvalue decomposition of P . The latter results in a sequence of eigenvalues λ1 , λ2 . . . and corresponding eigenfunctions Ψ1 , Ψ2 , . . . that fulfill P Ψi = λi Ψi . The diffusion map after τ timesteps Ψτ : X → Rw embeds each node i = 1, . . . , n in the Markov chain into a w dimensional Euclidean space where the clustering of the data points can be done using k-means τ λ1 Ψ1 (i) λτ2 Ψ2 (i) (4) i 7→ Ψτ (i) , .. . λτw Ψw (i) A common choice � for the kernel � k(., .) is the Gaussian kernel, d2 (x,y) i.e. k(x, y) = exp − 2σ2 , where d is a distance over the set X and σ a scale factor. Therefore, in order to apply the diffusion maps to fiber tracts, we define in the following a metric over the fiber domain. 3. A METRIC BETWEEN FIBER TRACTS Instead of considering a fiber tract as a set of points, we will view it as a set of Gaussian probability distributions. Indeed, this viewpoint is justified by the fact that tractography is based on the integration of the field of principal directions of diffusion when the tensor field is assumed to be continuous (by means of interpolation). Therefore the tensor information can be kept along with the spatial positions obtained by tractography. So one can consider that each fiber tract F is represented
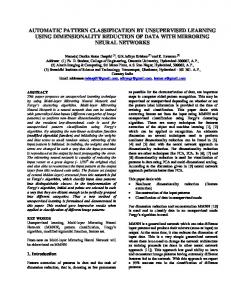
Fig. 1. An axial slice of a high-resolution T1-weighted image showing a manual segmentation of the calf muscle in seven groups
0.9 0.88 0.86 0.84 Dice coefficients
This new kernel is no longer symmetric, but it satisfies X ∀x, p(x, y) = 1.
0.82 0.8 0.78 0.76 0.74 0.72 0.7 Sigma = 0.5, k = 7
Sigma = 1, k = 7
Sigma = 0.5, k =10
Sigma =1, k =10
Fig. 2. Boxplots of dice overlap coefficients for the thirty subjects with different values of σ and k (the number of clusters). The box has lines at the lower quartile, median, and upper quartile values. The whiskers are lines extending from each end of the box to show the extent of the rest of the data. Outliers are data with values beyond the ends of the whiskers.
by a sequence of multivariate normal distributions (pi )i=1...N where N is the number of points of the fiber. The parameters (xi , Di ) of (pi ) are the spatial localization xi and the tensor Di at xi . More explicitly, given a diffusion (mixing) time t, the probability density function pi (y) at a position y is given by the following expression: � � (y − xi )t D−1 1 i (y − xi ) exp − pi (y) = p 4t det(Di )(4πt)3 (5) The main tool to define the fiber metric is the following affinity measure C(pi , pj ) defined as the normalized inner product between probability densities pi and pj : R pi (y)pj (y)dy qR (6) C(pi , pj ) = qR 2 2 (pi (y)) dy (pj (y)) dy
Let us now consider two fiber tracts F1 and F2 represented by pi )i=1...N2 , a set of probability densities (pi )i=1...N1 (resp. (e where N1 (resp. N2 ) is the number of points of F1 (resp. F2 ). The affinity between probability densities in (6) admits a straightforward generalization to the fiber domain to obtain b 1 , F2 ) as follows: a similarity measure C(F N2 N1 X X b 1 , F2 ) = 1 1 C(pi , pej ) C(F N1 N2 i=1 j=1
(7)
hal-00424543, version 1 - 16 Oct 2009
One can therefore derive the following metric d between fibers: v u b 1 , F2 ) C(F u q (8) d(F1 , F2 ) = t2 − 2 q b b C(F1 , F1 ) C(F2 , F2 )
It turns out that d(F1 , F2 ) has an explicit expression. Indeed, one can show (computations are omitted) that we can derive a closed form expression of C(pi , pej ) for multivariate normal distributions: √ det(Di ) 14 det(Dj ) 41 C(pi , pej ) = 2 2 p × det(Di + Dj ) � � 1 exp − (xi − xj )t (Di + Dj )−1 (xi − xj ) 4t
(a)
(b)
(c)
(d)
(9)
The computation of the metric d(F1 , F2 ) between fibers is straightforward using (7) and (8). Note how this formulation provides a natural way to take spatial relationships into account while keeping the information provided by the tensor field. 4. EXPERIMENTS AND RESULTS Thirty subjects (twenty healthy subjects and ten patients affected by myopathies) underwent a diffusion tensor imaging of the calf muscle using a 1.5 T MRI scanner. The following acquisition parameters were used : repetition time (TR)= 3600 ms, echo time (TE) = 70 ms, slice thickness = 7 mm and a b value of 700 s.mm−2 with 12 gradient directions and 13 repetitions. The size of the obtained volumes is 64 × 64 × 20 voxels with a voxel resolution of 3.125 mm × 3.125 mm × 7 mm. We acquired simultaneously high-resolution T1-weighted images that were segmented manually by an expert into seven muscle groups to provide the ground truth. To give an idea about the muscle architecture in the calf, we present in [Fig.1] a manual segmentation overlaid on an axial slice of a high-resolution T1-weighted image. The following muscle groups are considered: the soleus (SOL), lateral gastrocnemius (LG), medial gastrocnemius (MG), posterior tibialis (PT), anterior tibialis (AT), extensor digitorum longus (EDL), and the peroneus longus (PL). We manually delineated a region of interest (ROI) for
Fig. 3. Axial, coronal and saggital views of tractography segmentation in 7 classes overlaid on diffusion-free (B0) images for (a), (c) two healthy subjects (b), (d) two diseased subjects
fiber tracking [14] and the fibers with a majority of points lying outside of the ROI were discarded. The obtained manual segmentations of the T1-weighted images were downsampled to the resolution of the diffusion images and used to provide a ground-truth segmentation of the fiber tracts as follows: for each fiber, the number of voxels crossed by the fiber and belonging to each muscle group were counted. Then the fiber was assigned to the class with the majority vote. In order to quantitatively evaluate the proposed method, we measure the dice overlap coefficient of the obtained seg-
hal-00424543, version 1 - 16 Oct 2009
mentation with the ground-truth segmentation provided by the clinician. We tested the clustering method at two levels: for 7 and 10 clusters. The dimension of the diffusion maps embedding w was set to the number of clusters. The number of timesteps τ in (4) was set to τ = 1. We tested two values for the scale parameter of the Gaussian kernel: σ = {0.5, 1} and in all the experiments, the diffusion time t was set to t = 2 104 . The clustering in the embedding space is done using k-means with 50 restarts and taking the clustering result with the least distortion. Distortion is computed as the ratio of intra-class and inter-class variances. In [Fig.2], we present the boxplots of the dice overlap coefficients for the thirty subjects, using the different values of σ for 7 and 10 clusters. We can note that the quantitative results are rather satisfactory. For example, with the parameter σ set to σ = 1, we obtain a mean dice overlap coefficient of 0.78 (resp. 0.82) and a standard deviation of 0.05 (resp. 0.045) for 7 (resp. 10) classes . For a qualitative assessment, we show in [Fig.3] the obtained fiber classification in 7 clusters for two healthy and two diseased subjects. It is important to note in this setting that the diffusion images of the skeletal muscle are intrinsically noisier than brain images due to the short spin-spin (T2) relaxation time of the muscle tissue. Therefore the obtained fiber tracts are rather noisy, especially for diseased patients where the fat artifact is stronger. Despite the low quality of the tractography, our algorithm could still segment it in coherent fiber bundles. 5. CONCLUSION We proposed a diffusion maps based method for fiber clustering in the human skeletal muscle. The main ingredient of the algorithm is the definition of a metric between fibers that encompasses spatial and diffusion information. The experimental validation shows promising results both for healthy and diseased subjects. It would be interesting to perform statistical analysis of diffusion properties within each fiber bundle and assess the changes induced by myopathies. 6. REFERENCES [1] Craig J. Galban, Stefan Maderwald, Kai Uffmann, Armin de Greiff, and Mark E. Ladd, “Diffusive sensitivity to muscle architecture: a magnetic resonance diffusion tensor imaging study of the human calf,” European Journal of Applied Physiology, vol. 93, no. 3, pp. 253 – 262, 2004. [2] B.M. Damon, Z. Ding, A.W. Anderson, A.S. Freyer, and J.C. Gore, “Validation of diffusion tensor MRIbased muscle fiber tracking,” Magnetic Resonance in Medicine, vol. 48, pp. 97–104, 2002. [3] Anders Brun, Hae-Jeong Park, Hans Knutsson, and
Carl-Fredrik Westin, “Coloring of DT-MRI fiber traces using Laplacian eigenmaps,” in EUROCAST, 2003. [4] Lauren ODonnell and Carl-Fredrik Westin, “Automatic tractography segmentation using a high-dimensional white matter atlas,” IEEE TMI, vol. 26, no. 11, pp. 1562–1575, 2007. [5] Andy Tsai, Carl-Fredrik Westin, Alfred O. Hero, and Alan S. Willsky, “Fiber tract clustering on manifolds with dual rooted-graphs,” in CVPR, 2007. [6] M. Maddah, W. Grimson, S. Warfield, and W. Wells, “A unified framework for clustering and quantitative analysis of white matter fiber tracts,” Medical Image Analysis, vol. 12, no. 2, pp. 191–202, 2008. [7] Demian Wassermann and Rachid Deriche, “Simultaneous manifold learning and clustering: Grouping white matter fiber tracts using a volumetric white matter atlas,” in MICCAI 2008 Workshop - Manifolds in Medical Imaging: Metrics, Learning and Beyond., 2008. [8] Orly Zvitia, Arnaldo Mayer, and Hayit Greenspan, “Adaptive mean-shift registration of white matter tractographies,” in ISBI, 2008. [9] Peter Savadjiev, Jennifer S. W. Campbell, G. Bruce Pike, and Kaleem Siddiqi, “Streamline flows for white matter fibre pathway segmentation in diffusion MRI,” in MICCAI, 2008. [10] D. Wassermann, M. Descoteaux, and R. Deriche, “Diffusion maps clustering for magnetic resonance q-ball imaging segmentation,” International Journal on Biomedical Imaging, 2008. [11] Radhou`ene Neji, Nikos Paragios, Gilles Fleury, JeanPhilippe Thiran, and Georg Langs, “Classification of tensors and fiber tracts using Mercer-kernels encoding soft probabilistic spatial and diffusion information,” in CVPR, 2009. [12] Ronald R. Coifman and St´ephane Lafon, “Diffusion maps,” Appl. Comput. Harmon. Anal., vol. 21, pp. 5– 30, 2006. [13] Georg Langs and Nikos Paragios, “Modeling the structure of multivariate manifolds: Shape maps,” in CVPR, 2008. [14] Pierre Fillard, Nicolas Toussaint, and Xavier Pennec, “Medinria: DT-MRI processing and visualization software,” Similar Tensor Workshop, 2006.