Article
Using a Microfluidic Gradient Generator to Characterize BG-11 Medium for the Growth of Cyanobacteria Synechococcus elongatus PCC7942 : Chih-Chun Yang 1 , Rex C. Wen 2 , Claire R. Shen 2, * and Da-Jeng Yao 1, * Received: 2 September 2015 ; Accepted: 5 November 2015 ; Published: 13 November 2015 Academic Editors: Wen Jung Li and Ting-Hsuan Chen 1 2
*
:
Institute of Nanoengineering and Microsystems, National Tsing Hua University, Hsinchu 30013, Taiwan;
[email protected] Department of Chemical Engineering, National Tsing Hua University, Hsinchu 30013, Taiwan;
[email protected] Correspondence:
[email protected] (C.R.S.);
[email protected] (D.-J.Y.); Tel.: +886-3-5715131 (ext. 35706) (C.R.S.); +886-3-5715131 (ext. 42850) (D.-J.Y.); Fax: +886-3-5715408 (C.R.S.); +886-3-5745454 (D.-J.Y.) This paper is an extended version of our paper published in the 10th Annual IEEE International Conference on Nano/Micro Engineered and Molecular Systems (IEEE NEMS 2015), Xi’an, China, 7–11 April 2015.
Abstract: The photosynthetic cyanobacterium Synechococcus elongatus PCC7942 has recently gained great attention for its ability to directly convert CO2 into renewable chemicals upon genetic engineering. Thus, it is of great interest to increase the growth speed and lower the medium requirement for cultivating this cyanobacterium. The cultivation medium of Synechococcus elongatus PCC7942 has been developed, which consists of many inorganic and metal ingredients with a specific composition, known as the BG-11 medium. In this work, we analyzed the concentration effect of each ingredient and identified the absolutely essential components in BG-11 medium for cyanobacteria growth using the concentration gradient generator chip (CGGC) fabricated by MEMS technology. As shown by our results, removal of the individual component sodium nitrate, potassium phosphate, or magnesium sulfate from the BG-11 medium led to severe growth inhibition of Synechococcus elongatus PCC7942. Contrary to our expectation, increasing concentration of the crucial ingredients showed either insignificant or negative impact on cell growth. Overall, standard growth could be achieved without supplementation of ethylenediaminetetraacetic acid (EDTA) disodium, sodium carbonate, or sodium citrate to the culture medium. Further improvement of the CGGC-based microfluidic system based on this preliminary study may broaden its application range to analyze more complicated correlations. Keywords: cyanobacterium Synechococcus elongatus PCC7942; BG-11 medium characterization; growth optimization; microfluidic concentration gradient generator chip
1. Introduction With the advance of MEMS technology, many experiments can now be conducted on the small area of chips. The application of MEMS includes, but is not limited to, Radio-Frequency (RF) MEMS [1], Optical MEMS [2], and BioMEMS [3], where micro-scale or nano-scale devices can be used as molecular sensors, mechanical actuators, or structural support. In the field of BioMEMS, the major application lies in the realm of sample detection, biochemical reaction, cell cultivation, and/or cell separation. One of the examples in medical application is the use of polydimethylsiloxane (PDMS)
Micromachines 2015, 6, 1755–1767; doi:10.3390/mi6111454
www.mdpi.com/journal/micromachines
Micromachines 2015, 6, 1755–1767
chips fabricated by MEMS to sort the mobile and immobile sperms in the micro-fluidic channel [4] to increase in vitro fertilization efficiency. The concentration gradient generator chip (CGGC) [5] is another application enabled by MEMS for the generation of a stepwise concentration gradient in high throughput experiments. Concentration gradients can be achieved automatically via two different mechanisms: static or dynamic. In the static case, concentration gradient is formed by natural diffusion without any external force. On the other hand, dynamic generation of concentration gradient relies on the help of synthetic driving forces. In recent years, extensive use of CGGC in the biological fields has been reported [6]. Generation of a stepwise concentration gradient using a micro device equipped with multiple distribution channels and confluent points was reported by Yamada et al. in 2006 [7] to examine the effect of ethanol toxicity on the growth of yeast cells. Other applications of the microfluidic concentration gradient generator ranged from analysis of the tumor and drug interactions in a dynamic hypoxia microenvironment [8] to the study of lung cancer chemotherapy resistance [9]. Design and development of an integrated radial microfluidic gradient chip was also reported for cell apoptosis assays [10]. In addition to the designs which generate a linear type of concentration gradient, several other variations including the ones that can generate non-linear or log-scale concentration profiles, have been reported [11] and applied in studies where a wide range of concentration is necessary, such as the analysis of dosage response of enzyme inhibitors. As for cyanobacteria cultivation, since cells have a physiological range of salt and mineral concentration which it can tolerate, a finer concentration scale within the biological range is preferred and therefore used in this study. In this work, we aimed to improve the growth rate of the blue-green cyanobacteria by analyzing the essential components of the predefined growth medium using CGGC fabricated by MEMS technology. Cyanobacteria belong to a group of prokaryotic photoautotrophs that utilize light energy to fix CO2 into essential metabolites, and are collectively responsible for nearly 50% of all global photosynthetic activities [12]. Demand for a sustainable future and concern over global climate change has led to significant effort in the synthesis of commodity chemicals from renewable resources. Photosynthetic microorganisms such as cyanobacteria have therefore gained great attention for their ability to directly harvest sunlight and convert CO2 into biobased chemicals through genetic and metabolic engineering. In particular, the freshwater unicellular cyanobacterium Synechococcus elongatus PCC7942 has shown reliable transformability by exogenous DNA and has been widely engineered to synthesize various bio-monomer and biofuel molecules, such as ethylene [13], lactic acid [14], glucose [14], fructose [14], 2,3-butanediol [15], 1,2-propanediol [16], isobutyraldehyde [17], isobutanol [17], and 1-butanol [18]. Increasing growth speed of the cyanobacteria host is therefore of great interest as it would not only speed up the process of microbial engineering, but may also enhance the production efficiency of the target metabolite. One approach to improve the growth speed of cyanobacteria in a laboratory setting is to optimize the cultivation medium and tailor the supplements according to the microorganism’s need. A general cultivation medium for S. elongatus PCC7942 named BG-11 has been developed [19], and different versions [20,21] based on the slight modification of this original recipe has been widely used for supporting cyanobacteria growth in the laboratory. The defined BG-11 medium consists of various inorganic salts and trace metals at a fixed concentration (Table 1). Supplementation of sodium bicarbonate to the culture medium was done at times to provide additional carbon sources in addition to the atmospheric CO2 . While some of these medium ingredients are essential as the necessary nitrogen/phosphorous source, important enzyme cofactor, or buffering agent, some other components in the BG-11 medium may only be present for the purpose of generality to diversify its application. It is therefore our goal to identify the absolutely essential/non-essential ingredients for cyanobacteria growth and to characterize the medium by varying the concentration of each component in the hopes of achieving faster growth. In contrast to the manual generation of a concentration gradient in flasks, here we employed the CGGC to automatically and systematically generate six different concentrations of each BG-11
1756
Micromachines 2015, 6, 1755–1767
ingredient by setting the upper and lower concentration boundary. The goal was to create a concentration gradient from 0% to 100% with 20% interval using a microfluidic gradient generator. In this study, the concentration gradient was achieved using a Christmas tree-like microchannel structure [22], originally designed by Jeon et al. to generate and study gradient phenomenon on cell biology and surface chemistry. Similar to the CGGC design used in the testing of drug toxicity on embryonic zebrafish development reported by Yang et al. [23], our gradient chip consists of two inlets for medium introduction, which upon distribution into the Christmas tree-like microchannel, generated evenly-spaced concentration gradient among six cultivation chambers. Another similarity between our designs is the cultivation and examination of cells inside the confined chamber with manual inoculation, unlike some other reports [24,25] where a continuous flow of the solution was used to cultivate cells that were attached to the chamber surface. In order for us to achieve the desired concentration distribution, flow resistance would be the most important factor. The design of long microchannel was employed in this case for optimal mixing of the fluids inside the channel. The width of the microchannel (350 µm) was chosen to allow sufficient mixing since widening the channel would mean less flow resistance and therefore faster flow rates but lower mixing efficiency. Then, theoretical simulation and experimental green dye tests were performed to ensure the chip design and the flow setting were appropriate to reach the desired concentration gradient. After testing different flow rates in the system, 1.5 µL/min resulted in the best mixing efficiency with a concentration gradient very close to the numbers calculated by theoretical simulation. However, this was also accompanied by greater flow resistance and therefore took us a longer time for the gradient generation. In this study, cyanobacteria growth was monitored in the microfluidic cultivation chamber with a small volume of the medium. The major results were then verified again in bench-scale flasks to ensure consistency between the microfluidic device and our regular cell cultivation vessel. As shown by our results, absence of the individual component sodium nitrate, potassium phosphate, or magnesium sulfate from the BG-11 medium caused complete growth inhibition of S. elongatus PCC7942. On the other hand, removal of ethylenediaminetetraacetic acid (EDTA) disodium, sodium carbonate, and sodium citrate had no impact on the cell growth. In contrast to our expectation, increasing concentration of the individual medium component had either an insignificant or a negative effect on the cyanobacteria growth speed. In particular, when a 10-fold higher concentration of sodium nitrate or trace metal mix was added to the medium compared to the control composition (Table 1), severe growth retardation was observed. Overall, standard growth in bench-scaled flasks could be achieved in the absence of EDTA disodium, sodium carbonate, and sodium citrate as identified by the microfluidic experiments. However, doubling the concentration of potassium phosphate, sodium nitrate, sodium bicarbonate, and/or trace metal mix failed to improve cyanobacteria growth significantly in flasks. Table 1. Regular BG-11 medium composition used in this study as a control group. Concentration of each component was adopted from [20,21]. 50 mM of NaHCO3 was added unless otherwise specified. Final Concentration in the BG-11 Medium NaNO3 CaCl2 Ferric ammonium citrate Na2 EDTA K2 HPO4 MgSO4 Na2 CO3 Trace minerals Sodium citrate
1.5 g/L 0.0272 g/L 0.012 g/L 0.001 g/L 0.04 g/L 0.0361 g/L 0.02 g/L 1 mL stock/L * 0.00882 g/L
Note: * Trace mineral stock solution consists of 1.43 g H3 BO3 , 0.905 g MnCl2 ¨ 4H2 O, 0.111 g ZnSO4 ¨ 7H2 O, 0.195 g Na2 MoO4 ¨ 2H2 O, 0.0395 g CuSO4 ¨ 5H2 O, 0.0245 g Co(NO3 )2 ¨ 6H2 O per 500 mL of water.
1757
Micromachines 2015, 6, 1755–1767
2. Experimental Section Micromachines 2015, 6, page–page 2.1. Chemicals and Reagents
All chemicals were purchased from Sigma-Aldrich (St. Louis, MO, USA) or JT Baker (Center 2. Experimental Section Valley, PA, USA). Polydimethylsiloxane (PDMS), consisting of ingredients A and B, was purchased 2.1. Chemicals and Reagents MI, USA). from Dow Corning (Midland, All chemicals were purchased from Sigma-Aldrich (St. Louis, MO, USA) or JT Baker (Center
2.2. Device Valley,Fabrication PA, USA). Polydimethylsiloxane (PDMS), consisting of ingredients A and B, was purchased from Dow Corning (Midland, MI, USA). The concentration gradient generator device used in this study was fabricated by polymer fabrication, which included UV lithography and PDMS molding. The detail fabrication process is 2.2. Device Fabrication shown on Figure 1a and described as follows. First, we designed the patterns for the micro-channels, The concentration gradient generator device used in this study was fabricated by polymer which are 350 µm wide with six cultivation chambers by SolidWorks (2013 x64 Edition). The acrylic fabrication, which included UV lithography and PDMS molding. The detail fabrication process is matrixshown moldonwas then manufactured by a commercial company. Next, the channels were printed at Figure 1a and described as follows. First, we designed the patterns for the micro-channels, 20,000which dots are per350 inch on transparent film (Taiwan King (2013 Co. x64 Ltd.,Edition). Taoyuan, μm(DPI) wide with six cultivation chambers by Kong SolidWorks The Taiwan) acrylic and used as a photomask for lithography. Then the silicon mold was fabricated in a single step under UV matrix mold was then manufactured by a commercial company. Next, the channels were printed at 20,000 an dotsSU8-3050 per inch (DPI) on transparent (Taiwan KongHere King we Co. obtained Ltd., Taoyuan, Taiwan) layer and with light using photoresist under film a mask aligner. the bottom used as afrom photomask lithography. silicon mold was fabricated indevice, a single20 step under UV which six chambers acrylicfor matrix mold. Then Afterthe fabricating the microfluidic g of PDMS light of using an SU8-3050 photoresist a mask Here we obtained the fluidic bottom mold layer with consisted ingredients A and B withunder the ratio of aligner. 10:1 was poured onto the placed on six chambers from acrylic matrix mold. After fabricating the microfluidic device, 20 g of PDMS which a petri dish to yield a fluidic layer while 55 g of PDMS was poured onto the acrylic matrix mold to consisted of ingredients A and B with the ratio of 10:1 was poured onto the fluidic mold placed on a get the base layer. After degassing by vacuum chamber, the mold was baked for 35 min at 80 ˝ C. petri dish to yield a fluidic layer while 55 g of PDMS was poured onto the acrylic matrix mold to get Then,the thebase PDMS peeledchamber, from thethemold. Holes were a metal layer.layer Afterstructure degassingwas by vacuum mold was baked forpunched 35 min at by 80 °C. Then, pin at the terminals the inlets. Next, fluidic was bonded on top of another PDMS the PDMSoflayer structure was the peeled fromlayer the mold. Holes were punched by a metal pinwith at theoxygen terminals thewhole inlets. Next, theThe fluidic layer was bonded on chip top ofisanother with1b, oxygen plasma to formofthe device. resulting microfluidic shown PDMS in Figure composed plasma to form the whole device. The resulting microfluidic chip is shown in Figure 1b, composed of two layers of PDMS with six cultivation chambers. Detailed fabrication parameters are as of follows: two layers of PDMS with six fabrication are thickness as follows: of the spin coating speed is about 500cultivation rpm/10 chambers. s followedDetailed by 1600 rpm/30parameters s. The final spin coating speed is about 500 rpm/10 s followed by 1600 rpm/30 s. The final thickness of the pattern pattern after development is 85 µm (averaged from five sites of the microchannel). The soft bake time after development is 85 μm (averaged from five sites of the microchannel). The soft bake time is is 95 ˝ C for 30 min and the post exposure bake (PEB) time is 65 ˝ C for 1 min followed by 95 ˝ C for 95 °C for 30 min and the post exposure bake (PEB) time is 65 °C for 1 min followed by 95 °C for 5 min. 5 min.Plasma Plasma bonding: (1) Degas (vacuum situation) 0.2fill Torr; (2) fill oxygen 0.5 Torr for bonding: (1) Degas (vacuum situation) until 0.2 until Torr; (2) oxygen until 0.5 Torruntil for 30 s to 30 s tomodify modify PDMS surface to hydrophilic. thethe PDMS surface to hydrophilic.
1. Spin photoresist (PR) SU-8
4. PDMS Molding
Photoresist SU-8
2. Expose and develop (PR)
3. Define microchannel
5. Two layers of PDMS bonding (Upper: microchannel, Lower: base)
Upper layer PDMS
Lower layer PDMS
Silicon
(a)
(b)
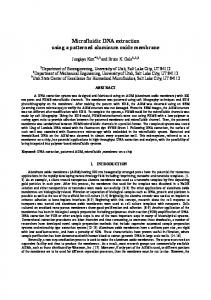
Figure 1. (a) Microfabrication process for the concentration gradient generator system. (b) Microfluidic
Figure 1. (a) Microfabrication process for the concentration gradient generator system; chip composed of two layers of PDMS with six cultivation chambers. (b) Microfluidic chip composed of two layers of PDMS with six cultivation chambers. 2.3. Design and Simulation of the Concentration Gradient Generator
2.3. Design and Simulation of the Concentration Gradient Generator
We used simulation to predict mathematical values and to estimate the concentration profile of
the used medium in the cultivation chamber so that a comparison between the theoretical data and theprofile We simulation to predict mathematical values and to estimate the concentration of the medium in the cultivation chamber so that 4 a comparison between the theoretical data and
1758
Micromachines 2015, 6, 1755–1767
the experimental results could be performed. The microchannel size and flow rate parameters were Micromachines chosen based on prior knowledge and experiments, which generated the most stable flow 2015, 6, page–page distributions. The dimension of each cultivation chamber is 2 cm (length) ˆ 0.6 cm (width) ˆ 0.7 cm experimental results could capacity be performed. The microchannel sizeofand parameters were ˆ 7 cm (height) with a total volume of 840 µL. The full size theflow chiprate is 9.5 cm (length) chosen based prior knowledge and element experiments, which generated the mostusing stable flow (width) ˆ 0.9 cm on (height). First, finite analysis was conducted CFDdistributions. software (V2010.0, The dimension of each cultivation chamber is 2 cm (length) × 0.6 cm (width) × 0.7 cm (height) with a ESI CFD Inc., Huntsville, AL, USA) to determine the solution profile in the channels and estimate the total volume capacity of 840 μL. The full size of the chip is 9.5 cm (length) × 7 cm (width) × 0.9 cm microfluidic generation of concentration gradients. In the software CFD-GEOM, a three-dimensional (height). First, finite element analysis was conducted using CFD software (V2010.0, ESI CFD Inc., modelHuntsville, of the microfluidic a width of 350 µmchannels and a height of 80the µm was constructed. AL, USA) to channel determinewith the solution profile in the and estimate microfluidic Therefore, the simulation result was based on a 3D structure.a three-dimensional For the fluid field simulation, we generation of concentration gradients. In the software CFD-GEOM, model of the channelconstant with a width 350 µm a height1.5 of 80µL/min µm was constructed. Therefore, testedmicrofluidic three different flowofrates (1and µL/min, and 2 µL/min) andthe boundary simulation was based on a inlets 3D structure. For walls the fluid tested three different conditions wereresult assigned at the and the offield thesimulation, channel. we The simulation results were constant flow rates (1 µL/min, 1.5 µL/min and 2 µL/min) and boundary conditions were assigned at shown in Figure 2. The viscosity coefficient of green dye and BG-11 medium was measured and the inlets and the walls of the channel. The simulation results were shown in Figure 2. The viscosity was shown to have the same value as deionized (DI) water. Therefore, the properties of water coefficient of green dye and BG-11 medium was measured and was shown to have the same value as 3 ´1 ¨ s´1 ) were used to simulate the BG-11 medium (density of 1000(DI) kg/m viscosity 0.7 kg¨ m deionized water.and Therefore, the of properties of water (density of 1000 kg/m 3 and viscosity of −1 −1 in the0.7 theoretical calculations. The concentration gradient pressure simulation showed kg·m ·s ) were used to simulate the BG-11 mediumand in the theoretical calculations. Themedium concentration andand pressure simulation showed (Figure medium 2). distribution is well balanced and distribution is wellgradient balanced perfectly symmetrical To further confirm experimentally, symmetrical (Figure 2). the To further ran DI water and green dye we ranperfectly DI water and green dye on chip toconfirm check experimentally, the mixing andweconcentration gradient formation. on the verified chip to check the mixing and introduction concentration gradient formation. The result verified The result smooth medium and symmetrical distribution as smooth the green dye medium introduction and symmetrical distribution as the green dye traveled forward with the same traveled forward with the same speed and reached the microchannel outlet at the same time (data speed and reached the microchannel outlet at the same time (data not shown). Image J, a widely and not shown). Image J, a widely andsoftware, commonly used image analyzing software, waspicture employed to commonly used image analyzing was employed to analyze the pixel ratio of the analyze pixel ratio of the picture andUpon thenanalysis, define the thesimulation gradient results distribution. Upon the andthe then define the gradient distribution. were 100%, 80%, analysis, 60%, 40%, 20%, and were 0% while the 80%, experimental results (green were 100%, 78%, 59%, 39.5%, 18%, simulation results 100%, 60%, 40%, 20%, anddye 0%test) while the experimental results (green dye and 0% under flow59%, rate of 1.5 µL/min. test) were 100%, 78%, 39.5%, 18%, and 0% under flow rate of 1.5 µL/min.
(a)
(b)
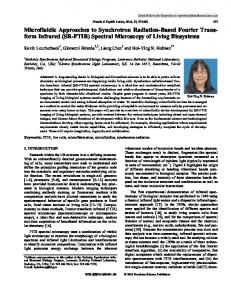
Figure 2. Simulation results by the CFD-VIEW for the analysis of concentration gradient and pressure
Figure 2. Simulation results by the CFD-VIEW for the analysis of concentration gradient and distribution at 1.5 μL/min flow rate in the microchannel. (a) Concentration distribution in the pressure distribution at 1.5 µL/min flow rate in the microchannel. (a) Concentration distribution microchannel with the highest concentration at the left and the lowest concentration at the right in theposition. microchannel withdistribution the highest at where the left and the lowestasconcentration (b) Pressure in concentration the microchannel pressure decreases the solution at the right position; (b) the Pressure distribution in the microchannel where pressure decreases as the solution traveled from top to the bottom. traveled from the top to the bottom. 2.4. Cyanobacteria Cultivation Medium and Condition
2.4. Cyanobacteria Cultivation Medium andstrain Condition Wild type S. elongatus PCC7942 was cultured in regular BG-11 medium (Table 1) containing 50 mM NaHCO3 in screwed-cap flasks or microfluidic chambers, as specified in the text.
Wild type S. elongatus PCC7942cyanobacteria strain was cultured in plates, regularcells BG-11 containing For re-streaking and maintaining growth on weremedium grown on(Table BG-111) agar 50 mM NaHCO screwed-cap flasks or of microfluidic chambers,is listed as specified inFor thethetext. For 3 in of (1.5% w/v) plates, which the concentration individual components in Table 1. re-streaking andBG-11 maintaining growth on“11.4X” plates,ofcells were component, grown on BG-11 agar (1.5% cases when medium cyanobacteria was modified with “0X” or a specific we meant none of the specific the component was added the “0X” case, or 11.4-fold higher concentration w/v) plates, of which concentration ofinindividual components is listed in Table 1.relative For the cases the level shownwas on Table 1 waswith added in the keeping all other ingredients when to BG-11 medium modified “0X” or “11.4X” “11.4X”case of awhile specific component, we meant none of unchanged. The reason why we choose the number 11.4X was to adjust for the dilution of the specific the specific component was added in the “0X” case, or 11.4-fold higher concentration relative to the level shown on Table 1 was added in the “11.4X” 5case while keeping all other ingredients unchanged. The reason why we choose the number 11.4X was to adjust for the dilution of the specific component 1759
Micromachines 2015, 6, 1755–1767
upon addition of cell resuspension into the culture medium in the cultivation chamber so that the final concentration of the specific component would be 10X (see Section 2.5 below). Cultures were grown under 35 µE¨ s´1 ¨ m´2 light conditions at 30 ˝ C with 100 rpm shaking speed. Cell growth was monitored by measuring OD730 using the Biotek Eon spectrophotometer, in which the optical density (OD) of a cyanobacteria culture at 730 nm is positively correlated with the cyanobacteria cell count and is commonly used to quantify its growth. 2.5. Generation of Concentration Gradient in the Microfluidic Chamber Using CGGC Before loading the culture medium into the device, we washed the micro-channels with 75% ethanol using a syringe followed by DI water twice to sterilize the channels and cultivation chambers. For each round of the experiment, we varied the concentration of one component in the BG-11 medium between “0” to “10-fold” relative to the regular BG-11 medium, except for the case of sodium bicarbonate where “5-fold” was set as the upper bound. To achieve the final concentration gradient of “0, 2X, 4X, 6X, 8X, 10X”, we manually prepared “0X” and “11.4X” of the specific component in BG-11 medium. After the chip pre-treatment, the modified BG-11 media with 0X and 11.4X of the specific component were loaded into the microchannel as the lower and upper boundary, and the concentration gradients were automatically generated using the syringe pump to inject the two mediums into the pre-designed CGGC, where they mixed and resulted in “0X, 2.3X, 4.6X, 6.8X, 9.1X, 11.4X” of the particular ingredient. This concentration gradient was then adjusted back to the desired “0, 2X, 4X, 6X, 8X, 10X” upon addition of the cell resuspension (50 µL) to the original medium volume of 350 µL in each cultivation chamber (see Section 2.6 below). A similar concept was applied to the case of sodium bicarbonate, where “0X” and “5.7X” were used as the boundaries to achieve a final concentration gradient of “0X, 1X, 2X, 3X, 4X, 5X”. The injection flow rate into the CGGC was maintained constantly at 1.5 µL/min. It took approximately 4 h to reach a medium volume of 350 µL in each cultivation chamber. The use of bigger cultivation volume compared to other applications in the confined chamber was chosen based upon the sample loading amount requirement for measuring cell density using a spectrophotometer. 2.6. Cyanobacteria Cultivation in the Microfluidic Chamber To inoculate cyanobacteria cells into the medium contained in the microfluidic chamber, we first scraped some wild type cells from the plate and resuspended them into 5 mL regular BG-11 medium with “0X” of the specific component (whose concentration effect is to be tested). Resuspension of cells in “0X” of the specific component avoided altering the “0X” state in the cultivation chamber upon addition of the resuspended cells into the chamber. The concentration gradient of the specific component in each chamber was prepared so that the addition of 50 µL of the resuspended cells to 350 µL of the modified medium would result in a final concentration gradient of 0X, 2X, 4X, 6X, 8X and 10X in the cultivation chamber. To ensure all concentration tests start at the same cell density, the cell resuspension was always adjusted to an OD730 of 0.1 before inoculating 50 µL into each chamber. The final volume of culture medium in each chamber was 400 µL with a starting cyanobacteria cell density of around 0.01 (OD730 ). Mixing of the cyanobacteria cell and the medium solution in the cultivation chamber was performed manually by pipetting the solution up and down during inoculation of the cells. Once cells were inoculated into the chambers, the microfluidic chip was placed into a petri dish (14 cm diameter) and sealed with parafilm to prevent drying. The cultures were then incubated under 30 ˝ C for 72 h with 100 rpm of reciprocating motion (back-and-forth shaking). Then, cell density in each chamber was measured at 730 nm using a spectrophotometer. 2.7. Verification of the Concentration Effects in Flasks To verify concentration effects in bench-scale flasks, different BG-11 mediums with unique concentrations of the specific component were prepared as indicated in the results section. Unless 1760
Micromachines 2015, 6, 1755–1767
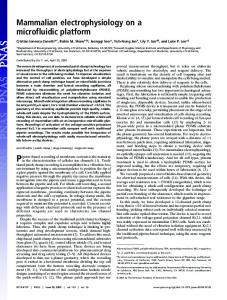
otherwise specified, the rest of the BG-11 constituents remained unchanged. Similar to procedures in Section 2.6 above, wild type cyanobacteria cells were scraped from the plate and resuspended into the modified BG-11 medium with an OD730 of 0.1 before inoculation. Then, 5 mL of the cell resuspension was added to 35 mL of the same modified BG-11 medium in screw-cap flasks to reach a starting cyanobacteria cell density of around 0.01 (OD730 ). The cultures were incubated at 30 ˝ C for a few days with 100 rpm of orbital or reciprocating shaking. Samples were taken every day throughout the experiment by taking 200 µL of the culture for cell density measurements. 3. Results and Discussion 3.1. Identification of the Optimal Cultivation Volume for Cyanobacteria in the Microfluidic Chamber Before we could use the CGGC to test the concentration effects of various components in the BG-11 medium, we first needed to examine and identify a suitable cultivation condition for optimal cyanobacteria growth within the microfluidic chamber. Based on our design, the maximum volume allowable in the microfluidic chamber is about 840 µL (2 cm in length ˆ 0.6 cm in width ˆ 0.7 cm in height). Since mixing of the cells by shaking the microfluidic device is necessary to avoid cell precipitation in the medium, and the extent of mixing varies with the volume loaded, we first tested cyanobacteria growth in the microfluidic chamber with 250 µL, 300 µL, 350 µL, 400 µL, 450 µL, 500 µL, 550 µL, and 600 µL of medium volume under 100 rpm of orbital shaking. The regular BG-11 recipe (Table 1) was used as the growth medium in this test. After three days, we observed spilling and cross-contamination of cultures with a volume greater than 500 µL. There was also obvious cell precipitation at the bottom of each chamber across all volumes tested. We therefore hypothesized that orbital shaking may not be ideal for mixing cells contained in the rectangular-shaped cultivation chamber (Figure 1b). Switching to the mode of reciprocal shaking (back-and-forth motion) improved the extent of mixing and reduced cell precipitation significantly. Cell density of cyanobacteria reached an OD730 of about 1.0–1.2 in the chamber for medium volumes between 250 and 400 µL. After taking into account possible medium evaporation during the course of the experiment, we picked a working volume of 400 µL for cyanobacteria cultivation in the microfluidic chamber for further experiments. We also verified that the chamber position has no impact on the cyanobacteria growth or extent of mixing by achieving similar cell density across all chamber positions with an identical medium volume (left picture in Figure 3b). 3.2. Effects of BG-11 Medium Composition on Cyanobacteria Growth in the Microfluidic Device To test which BG-11 medium ingredient is absolutely essential for cyanobacteria growth and if variation of its concentration could lead to improved growth speed, we used the designed CGGC to automatically generate six different concentrations of one specific component of the BG-11 medium. A concentration gradient of “0X, 2X, 4X, 6X, 8X, 10X” for a specific component relative to the level present in the regular BG-11 was generated across the microfluidic chambers, and the experiment was repeated three times for each component. The resulting cell density from each chamber after three days of incubation was then compared to the cell density obtained with regular BG-11 medium which we refer to as the “control” group. Cyanobacteria growth for the control group was repeated many times across all positions in the microfluidic chambers to ensure consistency. An average cell density of OD730 of 1.12 ˘ 0.1 was obtained as the “control” growth standard and was used as the reference to measure the impact of ingredient concentration on cell growth. We set the average “control” cell density to be 100% and displayed the results by % increase or decrease of cell growth relative to the average “control” cell density (Figure 3a). The BG-11 medium components can then be categorized into three groups based on their concentration effects on growth: essential, concentration-insensitive, and concentration-sensitive as described below.
1761
Micromachines 2015, 6, 1755–1767 Micromachines 2015, 6, page–page Potassium Phosphate
Sodium Nitrate
120% 100% 80% 60% 40% 20%
160%
(Sample OD / Control OD) 100%
(Sample OD / Control OD) 100%
(Sample OD / Control OD) 100%
140%
140% 120% 100% 80% 60% 40% 20% 0%
0% 0X
2X
4X
6X
8X
Calcium Chloride
4X
6X
8X
120% 100% 80% 60% 40% 20% 6X
8X
60% 40% 20%
10X
0X
120% 100% 80% 60% 40% 20% 0X
2X
4X
6X
8X
10X
Concentration relative to regular BG-11
Sodium Citrate
6X
8X
10X
Sodium Carbonate
0%
10X
4X
160%
140%
Concentration relative to regular BG-11
2X
Concentration relative to regular BG-11
(Sample OD / Control OD) 100%
(Sample OD / Control OD) 100%
(Sample OD / Control OD) 100%
140%
4X
80%
EDTA Disodium
0%
140% 120% 100% 80% 60% 40% 20% 0% 0X
2X
4X
6X
8X
10X
Concentration relative to regular BG-11
Ferric Ammonium Citrate
160%
160%
(Sample OD / Control OD) 100%
(Sample OD / Control OD) 100%
2X
160%
2X
120% 100%
Concentration relative to regular BG-11
160%
0X
140%
0%
0X
10X
Concentration relative to regular BG-11
140% 120% 100% 80% 60% 40% 20% 0% 0X
2X
4X
6X
8X
140% 120% 100% 80% 60% 40% 20% 0%
10X
0X
Concentration relative to regular BG-11
2X
4X
6X
8X
10X
Concentration relative to regular BG-11
Sodium Bicarbonate
Trace Metal Mix
160%
160%
(Sample OD / Control OD) 100%
(Sample OD / Control OD) 100%
Magnesium Sulfate
160%
160%
140% 120% 100% 80% 60% 40% 20% 0%
140% 120% 100% 80% 60% 40% 20% 0%
0X
1X
2X
3X
4X
5X
Concentration relative to regular BG-11
0X
2X
4X
6X
8X
10X
Concentration relative to regular BG-11
(a)
(b) Figure3. 3. (a) (a) Cyanobacteria Cyanobacteria growth Figure growth comparison comparison cultivated cultivatedwith withdifferent differentBG-11 BG-11medium mediumcomposition composition in the microfluidic device for 72 h. Chart title indicates the specific medium component in the microfluidic device for 72 h. Chart title indicates the specific medium componentofofwhich whichthe the concentration was varied as shown by the x-axis relative to the amount used in the regular concentration was varied as shown by the x-axis relative to the amount used in the regularBG-11 BG-11 medium (Table (Table 1). 1). The The y-axis medium y-axis represents represents the the % % increase increase or or decrease decreasein incell celldensity densitycompared comparedtotothe the “control”, which was cultivated under regular BG-11 medium. Standard deviation “control”, which was cultivated under regular BG-11 medium. Standard deviationwas wascalculated calculated based on on three three repeats repeats for for the the group group grown based grown under under modified modified media. media. An An average averagecell celldensity densityofof 730 = 1.12 ± 0.1 was obtained for the “control” group by averaging cell densities across all six OD OD730 = 1.12 ˘ 0.1 was obtained for the “control” group by averaging cell densities across all six cultivation chambers chambers with with many many repeats; repeats. (b) cultivation (b) Example Example illustration illustration of of cyanobacteria cyanobacteriagrowth growthininthe the microfluidic cultivation chamber after 72 h. Left: control group grown in regular BG-11 medium microfluidic cultivation chamber after 72 h. Left: control group grown in regular BG-11 medium across across all six chambers. Right: testgrown group with grown with different concentrations of trace metal mix in all six chambers. Right: test group different concentrations of trace metal mix in the order the order of 10X, 8X, 6X, 4X, 2X, to 0X going from left to right. of 10X, 8X, 6X, 4X, 2X, to 0X going from left to right.
8 1762
Micromachines 2015, 6, 1755–1767
3.2.1. Sodium Nitrate, Potassium Phosphate, and Magnesium Sulfate are Essential Components for Cyanobacteria Growth Cultivation of cyanobacteria in different concentrations of the individual components present in the BG-11 medium revealed the three ingredients essential for cell growth, namely sodium nitrate, potassium phosphate, and magnesium sulfate. Removal of these three ingredients individually from the medium led to complete growth inhibition in the microfluidic chamber as shown by our results. Increasing the concentration of potassium phosphate or magnesium sulfate in the medium from 2X to 10X relative to the regular BG-11 formula had no significant effect on the cyanobacteria growth, except that 20% higher cell density was observed in the case of 2X potassium phosphate (Figure 3a). As for sodium nitrate, increasing concentration to 2X also showed a 20% improvement in cell growth; however, raising the concentration from 4X to 10X led to a proportional decrease in cell density. The level of pH in the modified BG-11 medium with 10X sodium nitrate was confirmed to be nearly identical (pH ~8.5) to the pH of regular BG-11. Similar observations with increasing nitrate concentration were reported in [26] where the growth of different strains of cyanobacteria was inhibited when the nitrate supplementation approached 10 g/L, a concentration much higher than those found in their natural habitat. The necessity of nitrate, phosphate, and sulfate may lie in the importance of element nitrogen, phosphorous, and sulfur in supporting the basis of life. While phosphorous is essential as the building block for the DNA backbone and the synthesis of ATP, sulfur and nitrogen are indispensable elements found in amino acids (cysteine and methionine contains sulfur) and proteins. Nitrogen also plays an important role in nucleic acid synthesis. On the other hand, magnesium participates in many enzymatic reactions as the stabilizing cofactor. Our results have verified that cyanobacteria S. elongatus PCC7942 requires the presence of a nitrogen, phosphorous, and sulfur source in the medium in order to maintain optimal growth. However, increasing the supply of these elements higher than the control recipe did not improve the growth speed more than 20%. 3.2.2. Removal or Increase of Calcium Chloride, EDTA Disodium, Sodium Carbonate, or Sodium Citrate Supplementation had no Significant Effect on Cyanobacteria Growth In contrast to the ingredients discussed in the results from Section 3.2.1 whose removal led to significant growth retardation of cyanobacteria, elimination of the following BG-11 medium components, calcium chloride, EDTA disodium, sodium carbonate, and sodium citrate, individually from the growth medium had no obvious impact on cell growth in the microfluidic chamber, except for the case of ferric ammonium citrate where a 20% decrease in cell density was observed. Elevating their concentration from 2X to 10X relative to the regular BG-11 did not influence the final cell density of cyanobacteria either (Figure 3a). This result may indicate the non-essentiality of these ingredients for cell growth, or for certain cases such as calcium and iron, maybe only a minute quantity possibly found in the water or chemical impurity is necessary for normal growth. Both calcium and iron are crucial elements required for the activity of signal transduction [27], electron transport in the photosystems [28], and certain classes of enzymes with Fe-S clusters. Iron is of particular importance for photosynthetic microorganisms such as cyanobacteria due to its binding to the thylakoid protein complexes for electron flow [28]. It is possible that trace amount of iron and calcium are present in our purified water or in other added chemicals so that removal of calcium chloride or ferric ammonium citrate supplementation from the cultivation medium had only a small impact on cyanobacteria growth. On the other hand, EDTA and sodium carbonate are two common ingredients found in biological buffers and growth medium. Whereas sodium carbonate may be added to form the bicarbonate buffering system, EDTA is mostly known to act as a chelating agent to scavenge metal ions when it is desired to suppress the metal ion reactivity. Citrate is a central metabolite found in the tricarboxylic acid (TCA) cycle, which for certain microorganisms may serve as a sole carbon source to support growth. In this study, we identified these five concentration-insensitive ingredients in the BG-11 medium of which variation of their concentration had no significant effect on cell growth.
1763
Micromachines 2015, 6, 1755–1767
Absence of citrate, EDTA, or carbonate individually from the cultivation medium appeared to have no adverse impact on cyanobacteria growth. 3.2.3. Variation of the Trace Metal or Sodium Bicarbonate Concentration had Considerable Impact on Cyanobacteria Growth During the course of cyanobacteria cultivation, sodium bicarbonate can be supplemented as an additional carbon source in addition to the atmospheric CO2 . As shown in the Figure 3a, when the bicarbonate concentration was increased to 2X that of the original level (50 mM), cyanobacteria cell density at the 72nd hour was improved by 40% compared to the control group. However, elevating the bicarbonate concentration more than 3X appeared to have a detrimental effect on cell growth, with cell density inversely proportional to the bicarbonate level. Absence of bicarbonate from the medium also led to certain degrees of growth retardation since the cells had to rely on atmospheric CO2 as the sole carbon source. Trace metal is another group of ingredients which had a significant impact on cell growth as its concentration was varied. The trace metal mixture consists of six different metal compounds, including H3 BO3 , MnCl2 , ZnSO4 , Na2 MoO4 , CuSO4 , and Co(NO3 )2 . As we know, trace metals play an essential role in mediating the basic cellular metabolism and enzymatic reactions. In particular, certain metal ions such as Zn, Mn, and Cu may have indispensable function in photosynthesis and carbon fixation as they are essential enzyme cofactors involved in water oxidation, electron transfer, and CO2 assimilation [28]. Nevertheless, it is possible that very low amounts of such metals are required by cyanobacteria to maintain normal cellular function. As a result, if trace amount had been present in the medium from water or chemical impurity, it would explain why removal of the trace metal mixture entirely from the cultivation medium had no apparent effect on cell growth. We observed a 20% increase in cell density when the trace metal concentration was raised to 2X relative to the control level. Interestingly, when the trace metal concentration surpassed 6X in the medium, complete growth inhibition of cyanobacteria was observed (Figure 3a, b-right). It is possible that an excessive concentration of the trace metals has inhibitory effects on essential enzymes and/or cellular regulations. The level of pH in the modified BG-11 medium with 10X sodium bicarbonate or 10X trace metal mix was confirmed to be nearly identical (pH ~8.5) to the pH of regular BG-11. 3.3. Verification of Medium Composition Effects on Growth in Bench-Scale Flasks To verify that the concentration effects observed in the microfluidic chamber is not a vessel-dependent observation and similar effects would also be reflected in bench-scale flasks, we conducted growth experiments of cyanobacteria in screwed-cap flasks with medium compositions that showed significant growth differences from the microfluidic tests. The resulting growth trend over the course of four days is then compared to the one obtained from the control group, which was grown under the regular BG-11 medium recipe (Table 1). As shown in Figure 4, elimination of sodium nitrate, potassium phosphate, or magnesium sulfate supplementation individually from the cultivation medium resulted in similar growth inhibition in flasks as observed in the microfluidic chamber experiments, confirming their necessity for cyanobacteria growth. On the other hand, individual removal of calcium chloride, EDTA disodium, sodium carbonate, sodium citrate, or the trace metal mix from the medium did not cause much adverse effect on growth in the flasks throughout the course of cultivation. Cell growth appeared to be completely unharmed by the elimination of EDTA disodium, sodium carbonate, and sodium citrate supplementation from the culture medium. We also verified that removal of the aforementioned five ingredients simultaneously from the medium was not significantly detrimental as seen from Figure 4. Absence of ferric ammonium citrate supplementation was a bit more harmful to growth when cultivated in flasks than in the microfluidic device, where more than a 50% decrease in cell density was observed in flasks. Finally, we tested if similar 20%–40% growth enhancement of cyanobacteria as shown by the microfluidic experiments can be achieved in flasks with the addition of 2X potassium phosphate, 2X
1764
Micromachines 2015, 6, 1755–1767
sodium nitrate, sodium bicarbonate, and/or 2X trace metal mix. Parallel to the results obtained Micromachines 2015,2X 6, page–page from the microfluidic chip, doubling the concentration of these four components did consistently increasecyanobacteria cyanobacteria growth growth by by 10%–20% 10%–20% compared compared to increase to the the control control group; group; however, however, the thegrowth growth improvementwas was not not very very significant significant when when taking taking into improvement into account account the the growth growth deviation deviationinindifferent different batchesof ofthe thecontrol controlexperiment. experiment. batches
Essential component
Cell density (OD730nm)
1 0.8
control
0.6
no sodium nitrate no potassium phosphate
0.4
no magnesium sulfate no ferric ammonium citrate
0.2 0 0
2
3
day
4
Less-essential component
1
Cell density (OD730nm)
1
control no calcium chloride
0.8
no EDTA disodium
0.6
no sodium carbonate 0.4
no trace metal
0.2
no sodium citrate
0 0
2
3
day
4
no (calcium chloride, EDTA disodium, sodium carbonate, trace metal mix, sodium citrate)
Growth enhancing component
1
Cell density (OD730nm)
1
control
0.8
2X sodium bicarbonate
0.6
2X sodium nitrate 2X potassium phosphate
0.4
2X trace metal mix
0.2
2X sodium bicarbonate + 2X sodium nitrate + 2X potassium phosphate + 2X trace metal mix
0 0
1
2
day
3
4
Figure4.4. Verification Verification of of significant significant findings findings from from the Figure the microfluidic microfluidic experiments experimentsin inbench-scale bench-scaleflasks. flasks. The results were grouped into three categories, essential, less essential, and growth The results were grouped into three categories, essential, less essential, and growth enhancing enhancing depending on on ifif their their supplementation supplementation was was necessary necessary to depending to maintain maintain normal normal cell cell growth growth inin flasks flasks compared to the control (grown under regular BG-11 medium). For all the tests shown compared to the control (grown under regular BG-11 medium). For all the tests shownhere, here,the the BG-11medium mediumwas wasmodified modifiedaccording according to to the the figure figure legends legends shown. shown. BG-11
4. Conclusions 4. Conclusions With the CGGC fabricated by the MEMS technology, we were able to build a concentration With the CGGC fabricated by the MEMS technology, we were able to build a concentration gradient automatically and use it for many different applications. In this study, analysis of the BG-11 gradient automatically and use it for many different applications. In this study, analysis of the BG-11 medium composition on cyanobacteria growth was performed by generating concentration gradients medium composition on cyanobacteria growth was performed by generating concentration gradients of the individual medium components using CGGC. The ultimate goal of our work is to examine the of the individual medium components using CGGC. The ultimate goal of our work is to examine complicated relationship between multi- concentration gradients and cell growth with variation of the complicated relationship between multi- concentration gradients and cell growth with variation more than one medium component at the same time, as realized in 2D systems [29,30]. This study of more than one medium component at the same time, as realized in 2D systems [29,30]. This presents a preliminary analysis of the accuracy of a microfluidic chip-based generation of study presents a preliminary analysis of the accuracy of a microfluidic chip-based generation of concentration gradients and cyanobacteria cultivation. The results shown here demonstrated high concentration gradients and cyanobacteria cultivation. results shown demonstrated high consistency between CGGC-based growth response and The bench-scale growthhere behavior with different medium composition, which solidifies the foundation for future design and analysis of complex 1765 medium and growth relationship using a 2D system. 11
Micromachines 2015, 6, 1755–1767
consistency between CGGC-based growth response and bench-scale growth behavior with different medium composition, which solidifies the foundation for future design and analysis of complex medium and growth relationship using a 2D system. Upon optimization of the working volume in the microfluidic chamber for cyanobacteria cultivation, we identified the absolutely essential and potentially non-essential ingredients in the BG-11 medium. Sodium nitrate, potassium phosphate, and magnesium sulfate are the three important components that had to be supplemented for normal cell growth; however, increasing their concentration did not result in better growth speed. Apart from the case of ferric ammonium citrate where its removal led to obvious growth retardation, the rest of the BG-11 medium components, including calcium chloride, EDTA disodium, sodium carbonate, sodium citrate, and the trace metal mix, appear to be non-essential or required in such trace amounts that removal of their supplementation did not cause significant harm to cell growth. Among them, sodium nitrate, sodium bicarbonate, and the trace metal mix are the ingredients that would hurt growth if their concentrations were raised above 4X relative to the regular BG-11 recipe. The rest of the components had no effect on cell growth with increasing concentrations up to 10X. Further expansion of the CGGC design to a 2D system will potentially allow us to analyze and discover more complex correlations between growth and medium composition. Acknowledgments: This work was supported by the Ministry of Science and Technology with grant #103-2218-E-007-009-MY2. Author Contributions: Chih-Chun Yang designed and performed the experiment in the microfluidic chip, acquired and analyzed the data, and drafted the manuscript. Rex C. Wen performed the experiment in flasks, acquired and analyzed the data. Claire R. Shen designed and supervised the experiment concerning cyanobacteria cultivation, analyzed the data and wrote the manuscript. Da-Jeng Yao designed and supervised the experiment concerning the microfluidic device and proofread the manuscript. Conflicts of Interest: The authors declare no conflict of interest.
References 1. 2. 3.
4. 5. 6. 7.
8.
9.
10.
Huff, G.H.; Bernhard, J.T. Integration of packaged RF MEMS switches with radiation pattern reconfigurable square spiral microstrip antennas. IEEE Trans. Antennas Propag. 2006, 54, 464–469. [CrossRef] Solgaard, O.; Godil, A.A.; Howe, R.T.; Lee, L.P.; Peter, Y.A.; Zappe, H. Optical MEMS: From Micromirrors to Complex Systems. J. Microelectromech. Syst. 2014, 23, 517–538. [CrossRef] Jivani, R.R.; Lakhtaria, G.J.; Patadiya, D.D.; Patel, L.D.; Jivani, N.P.; Jhala, B.P. Biomedical microelectromechanical systems (BioMEMS): Revolution in drug delivery and analytical techniques. Saudi Pharm. J. 2013. [CrossRef] Huang, H.-Y.; Huang, P.-W.; Yao, D.-J. Enhanced efficiency of sorting sperm motility utilizing a microfluidic chip. Microsyst. Technol. 2015. [CrossRef] Tirella, A.; Marano, M.; Vozzi, F.; Ahluwalia, A. A microfluidic gradient maker for toxicity testing of bupivacaine and lidocaine. Toxicol. Vitro 2008, 22, 1957–1964. [CrossRef] [PubMed] Kim, S.; Kim, H.J.; Jeon, N.L. Biological applications of microfluidic gradient devices. Integr. Biol. 2010, 2, 584–603. [CrossRef] [PubMed] Yamada, M.; Hirano, T.; Yasuda, M.; Seki, M. A microfluidic flow distributor generating stepwise concentrations for high-throughput biochemical processing. Lab Chip 2006, 6, 179–184. [CrossRef] [PubMed] Wang, L.; Liu, W.; Wang, Y.; Wang, J.-C.; Tu, Q.; Liu, R.; Wang, J. Construction of oxygen and chemical concentration gradients in a single microfluidic device for studying tumor cell-drug interactions in a dynamic hypoxia microenvironment. Lab Chip 2013, 13, 695–705. [CrossRef] [PubMed] Wang, S.Y.; Yue, F.; Zhang, L.C.; Wang, J.R.; Wang, Y.Y.; Jiang, L.; Lin, B.C.; Wang, Q. Application of microfluidic gradient chip in the analysis of lung cancer chemotherapy resistance. J. Pharm. Biomed. Anal. 2009, 49, 806–810. Yang, C.G.; Wu, Y.F.; Xu, Z.R.; Wang, J.H. A radial microfluidic concentration gradient generator with high-density channels for cell apoptosis assay. Lab Chip 2011, 11, 3305–3312. [CrossRef] [PubMed]
1766
Micromachines 2015, 6, 1755–1767
11. 12. 13.
14.
15. 16. 17. 18. 19. 20. 21. 22. 23.
24.
25.
26.
27. 28. 29. 30.
Yun, J.Y.; Jambovane, S.; Kim, S.K.; Cho, S.H.; Duin, E.C.; Hong, J.W. Log-Scale Dose Response of Inhibitors on a Chip. Anal. Chem. 2011, 83, 6148–6153. [CrossRef] [PubMed] Field, C.B.; Behrenfeld, M.J.; Randerson, J.T.; Falkowski, P. Primary production of the biosphere: Integrating terrestrial and oceanic components. Science 1998, 281, 237–240. [CrossRef] [PubMed] Ungerer, J.; Tao, L.; Davis, M.; Ghirardi, M.; Maness, P.C.; Yu, J.P. Sustained photosynthetic conversion of CO2 to ethylene in recombinant cyanobacterium Synechocystis 6803. Energy Environ. Sci. 2012, 5, 8998–9006. [CrossRef] Niederholtmeyer, H.; Wolfstadter, B.T.; Savage, D.F.; Silver, P.A.; Way, J.C. Engineering Cyanobacteria to Synthesize and Export Hydrophilic Products. Appl. Environ. Microbiol. 2010, 76, 3462–3466. [CrossRef] [PubMed] Oliver, J.W.K.; Machado, I.M.P.; Yoneda, H.; Atsumi, S. Cyanobacterial conversion of carbon dioxide to 2,3-butanediol. Proc. Natl. Acad. Sci. USA 2013, 110, 1249–1254. [CrossRef] [PubMed] Li, H.; Liao, J.C. Engineering a cyanobacterium as the catalyst for the photosynthetic conversion of CO2 to 1,2-propanediol. Microb. Cell Fact. 2013, 12, 4. [CrossRef] [PubMed] Atsumi, S.; Higashide, W.; Liao, J.C. Direct photosynthetic recycling of carbon dioxide to isobutyraldehyde. Nat. Biotechnol. 2009, 27, 1177–1180. [CrossRef] [PubMed] Lan, E.I.; Liao, J.C. ATP drives direct photosynthetic production of 1-butanol in cyanobacteria. Proc. Natl. Acad. Sci. USA 2012, 109, 6018–6023. [CrossRef] [PubMed] Allen, M.M. Simple conditions for growth of unicellular blue-green algae on plates. J. Phycol. 1968, 4, 1–4. [CrossRef] Bustos, S.A.; Golden, S.S. Expression of the Psbdii Gene in Synechococcus sp. Strain PCC 7942 Requires Sequences Downstream of the Transcription Start Site. J. Bacteriol. 1991, 173, 7525–7533. [PubMed] Stanier, R.Y.; Kunisawa, R.; Mandel, M.; Cohen-Bazire, G. Purification and properties of unicellular blue-green algae (order Chroococcales). Bacteriol. Rev. 1971, 35, 171–205. [PubMed] Jeon, N.L.; Dertinger, S.K.W.; Chiu, D.T.; Choi, I.S.; Stroock, A.D.; Whitesides, G.M. Generation of solution and surface gradients using microfluidic systems. Langmuir 2000, 16, 8311–8316. [CrossRef] Yang, F.; Chen, Z.G.; Pan, J.B.; Li, X.C.; Feng, J.; Yang, H. An integrated microfluidic array system for evaluating toxicity and teratogenicity of drugs on embryonic zebrafish developmental dynamics. Biomicrofluidics 2011, 5, 24115. [CrossRef] [PubMed] Choudhury, D.; van Noort, D.; Iliescu, C.; Zheng, B.X.; Poon, K.L.; Korzh, S.; Korzh, V.; Yu, H. Fish and Chips: A microfluidic perfusion platform for monitoring zebrafish development. Lab Chip 2012, 12, 892–900. [CrossRef] [PubMed] Hsiung, L.C.; Chiang, C.L.; Wang, C.H.; Huang, Y.H.; Kuo, C.T.; Cheng, J.Y.; Lin, C.H.; Wu, V.; Chou, H.Y.; Jong, D.S.; et al. Dielectrophoresis-based cellular microarray chip for anticancer drug screening in perfusion microenvironments. Lab Chip 2011, 11, 2333–2342. [CrossRef] [PubMed] Ernst, A.; Deicher, M.; Herman, P.M.J.; Wollenzien, U.I.A. Nitrate and phosphate affect cultivability of cyanobacteria from environments with low nutrient levels. Appl. Environ. Microbiol. 2005, 71, 3379–3383. [CrossRef] [PubMed] Shi, J.Q.; Wu, Z.X.; Song, L.R. Physiological and molecular responses to calcium supplementation in Microcystis aeruginosa (Cyanobacteria). N. Z. J. Mar. Freshw. Res. 2013, 47, 51–61. [CrossRef] Raven, J.A.; Evans, M.C.W.; Korb, R.E. The role of trace metals in photosynthetic electron transport in O2 -evolving organisms. Photosynth. Res. 1999, 60, 111–149. [CrossRef] Hu, S.W.; Xu, B.Y.; Xu, J.J.; Chen, H.Y. Liquid gradient in two-dimensional matrix for high throughput screening. Biomicrofluidics 2013, 7, 64116. [CrossRef] [PubMed] Jang, Y.H.; Hancock, M.J.; Kim, S.B.; Selimovic, S.; Sim, W.Y.; Bae, H.; Khademhosseini, A. An integrated microfluidic device for two-dimensional combinatorial dilution. Lab Chip 2011, 11, 3277–3286. [CrossRef] [PubMed] © 2015 by the authors; licensee MDPI, Basel, Switzerland. This article is an open access article distributed under the terms and conditions of the Creative Commons by Attribution (CC-BY) license (http://creativecommons.org/licenses/by/4.0/).
1767