Int. J. Data Mining and Bioinformatics, Vol. x, No. x, xxxx
Using Hybrid Hierarchical K-means (HHK) clustering algorithm for protein sequence motif Super-Rule-Tree (SRT) structure construction Bernard Chen* Department of Computer Science, University of Central Arkansas, 201 Donaghey Avenue. Conway, AR 72035, USA E-mail:
[email protected] *Corresponding author
Jieyue He Department of Computer Science, Georgia State University, 34 Peachtree Street Room1417, Atlanta, GA 30303, USA School of Computer Science and Engineering, Southeast University, Nanjing 210096, China E-mail:
[email protected]
Stephen Pellicer and Yi Pan Department of Computer Science, Georgia State University, 34 Peachtree Street Room1417, Atlanta, GA 30303, USA E-mail:
[email protected] E-mail:
[email protected] Abstract: Many algorithms or techniques to discover motifs require a predefined fixed window size in advance. Because of the fixed size, these approaches often deliver a number of similar motifs simply shifted by some bases or including mismatches. To confront the mismatched motifs problem, we use the super-rule concept to construct a Super-Rule-Tree (SRT) by a modified Hybrid Hierarchical K-means (HHK) clustering algorithm, which requires no parameter set-up to identify the similarities and dissimilarities between the motifs. By analysing the motif results generated by our approach, they are significant not only in sequence area but also in secondary structure similarity. Keywords: SRT; super-rule-tree; hybrid hierarchical k-means clustering algorithm; protein sequence motif.
Copyright © 200x Inderscience Enterprises Ltd.
1
2
B. Chen et al. Reference to this paper should be made as follows: Chen, B., He. J., Pellicer, S., Tai, P.C., Harrison, R. and Pan, Y. (xxxx) ‘Using Hybrid Hierarchical K-means clustering algorithm for protein sequence motif Super-Rule-Tree (SRT) structure construction’, Int. J. Data Mining and Bioinformatics, Vol. x, No. x, pp.xxx–xxx. Biographical notes: Bernard Chen received the BSc in Computer Science from Fu-Jen Catholic University, Taipei, Taiwan, in 2002. He received his PhD in Computer Science with specialisation in Bioinformatics from Georgia State University, USA, in 2008. He is currently working as an Assistant Professor in Computer Science Department, University of Central Arkansas. His main research interests include bioinformatics, data mining algorithms, fuzzy logic, soft computing, microarray, protein array analysis and high-performance computing. Jieyue He received the BSc and MSc from Department of Computer Science and Technique at Nanjing University, China, and received her PhD in Computer Science with specialisation in Bioinformatics from Southeast University, China. She is a research scientist in Department of Computer Science, Georgia State University, USA and a Professor of the school of Computer Science and Engineering, Southeast University, China. Her current research interests include bioinformatics, data mining, machine learning and database system. Stephen Pellicer received the BS in Computer Science from University of Georgia, Athen, Georgia. He is currently working towards the PhD in the Department of Computer Science, Georgia State University, under the supervision of Dr. Y. Pan. He is also one of Molecular Basis of Disease (MBD) PhD fellow. His main research interests include high-performance computing, peer-to-peer network, data mining algorithms and bioinformatics. Yi Pan is the Chair and a Professor in the Department of Computer Science and a Professor in the Department of Computer Information Systems at Georgia State University. He received his PhD in Computer Science from the University of Pittsburgh, USA, in 1991. His research interests include parallel and distributed computing, optical networks, wireless networks and bioinformatics. He has published more than 100 journal papers with over 30 papers published in various IEEE journals. His recent research has been supported by NSF, NIH, NSFC, AFOSR, AFRL, JSPS, IISF and the states of Georgia and Ohio.
1
Introduction
One of the most important Bioinformatics research fields in sequence analysis is searching for motifs, since these recurring patterns have the potential to determine a protein’s conformation, function and activities. To identify these motifs, most of the enumerative algorithms in Bioinformatics research area need to specify the size of the motif in advance. Because of the fixed size, they often deliver a number of similar motifs 1
including mismatches or
2
shifted by one base (Ohler and Niemann, 2001), which is problematic.
Using Hybrid Hierarchical K-means clustering algorithm
3
The first problem implies that some group motifs may be similar to one another. The second problem probably can be more easily seen in this way: If there exists a biological sequence motif with length of 12 and we set the window size to 9, it is highly possible that we discovered two similar sequence motifs where one motif covers the front part of the biological sequence motif and the other one covers the rear part. In this paper, we deal with the first problem and manage the second one in succeeded future work. We deal with the ‘including mismatches’ problem by using the super-rules concept (He et al., 2005) to cluster those motifs and find the similarities among them. Two of the most popular algorithms for distance-based clustering are Hierarchical clustering (Jain and Dubes, 1988) and K-means clustering (MacQueen, 1967). According to Hu et al. (2007), many improvements to these two famous clustering algorithms have been proposed (Bradley and Fayyad, 1998; Brown and Huntley, 1990; Pelleg and Moore, 2000; Zhang et al., 1996; Karypis et al., 1999); however, they adopt our HHK clustering algorithm (Chen et al., 2005), which directly combines the two classic methods and yields good results. In this paper, we proposed the latest version of HHK, which requires no predefined parameters, to further improve the algorithm. In our previous work (Chen et al., 2006), we identified 343 high-quality protein sequence motifs, which transcend protein family boundaries. The input data set is generated from whole protein sequences by the sliding window technique; however, the information we tried to obtain is sequence motif knowledge, which is only several small parts of each sequence. Therefore, not all segments in the data set can provide significant information. In our latest research work (Chen et al., 2008), to obtain more precise motif information, we utilise our previous effort and combine it with ranking SVM to eliminate the redundant or less meaningful segments in our original data set. We proposed a Super GSVM-FE model (Chen et al., 2008) for protein sequence motif information extraction and applied it on one of our information granule numbers, i.e., eight. In this work, we applied our Super GSVM-FE model on all of our information granules so that we obtained 541 extracted high-quality protein sequence motifs, which transcend protein family boundaries. On the basis of the fact that some motifs maybe similar to one another, we try to further discover the relation between these motifs. Therefore, the HHK clustering algorithm is applied to discover super-rules and construct SRT structure. The rest of the paper is organised as follows. Section 2 gives the data mining techniques including clustering, super-rule concepts and a novel positional association rule algorithm. Section 3 discusses how we set up the experiment with the new algorithm. Results and conclusions are given in Sections 4 and 5, respectively.
2
Methods
2.1 Super GSVM-FE model The Super GSVM-FE Model (shown in Figure 1) uses the fuzzy concept to divide the original data set into several smaller information granules. For each granule, after five iterations of traditional K-means clustering, the greedy K-means is applied. In the next step, we adopt ranking SVM to rank all members in each cluster generated by the greedy K-means clustering algorithm, and then we filter out lower ranked members. The number
4
B. Chen et al.
of segments to eliminate is decided by a user-defined filtrate percentage. On the basis of our experimental results (Chen et al., 2008), 20% is the optimal trade-off between ranking-SVM training time and protein sequence motifs quality. After the feature elimination step, we collect all surviving data points in each information granule and then run greedy K-means with same initial centroids we previously generated. Finally, we collect all the results in all granules to create the final protein sequence motif information. We have performed a complete process of Super GSVM-FE Model on our data set (Chen et al., 2006) and generated 541 extracted high-quality protein sequence motifs, which transcend protein family boundaries. Figure 1
The sketch of super GSVM-FE model
2.2 Novel Hybrid Hierarchical K-means (HHK) clustering algorithm Clustering is a technique to divide data sets into several subsets whose elements share similar attributes. Among clustering algorithms, Hierarchical and K-means clustering are the two most popular and classic methods. However, both have their innate
Using Hybrid Hierarchical K-means clustering algorithm
5
disadvantages. Hierarchical clustering cannot represent distinct clusters with similar expression patterns. Also, as clusters grow in size, the actual expression patterns become less relevant. K-means clustering requires a specified number of clusters in advance and chooses initial centroids randomly; in addition, it is sensitive to outliers. We present a hybrid approach to combine the merits of the two classic approaches and discard disadvantages we mentioned. A brief description of HHK clustering algorithm (Chen et al., 2005) is as follows. First, we carried out agglomerative hierarchical clustering and let the programme stop at a certain terminal point (a user-defined percentage that is determined by the whole clustering process carried out by hierarchical clustering). From the clusters generated from hierarchical clustering, we computed the mean value of each cluster as the initial point for K-means to obtain the initial centroid. Also, the number of clusters generated from hierarchical clustering is K-means number of clusters. After that, we worked on K-means clustering with which every cluster must at least contain the same objects generated from hierarchical clustering. This is because that hierarchical clustering had already put objects that were very close with one another into clusters, and the goal of K-means clustering is to put close objects together, which is in the same direction as what hierarchical clustering accomplished. Therefore, we can trust the results of hierarchical clustering. We apply HHK clustering algorithm for super-rules (He et al., 2005) generation in this paper. To avoid human intervention and let the super-rule present the original data nature, we modified our HHK clustering algorithm to become a fully parameter-free algorithm. The original HHK required the user to decide when to stop the hierarchical clustering and proceed to K-means clustering. Since the role of HHK clustering algorithm is to generate the super-rules, the results of the clustering should be as detailed as possible. Therefore, the approach we propose to avoid the parameter set-up is to let the agglomerative hierarchical clustering complete execution, and we record the number of clusters it generated. After that, we carry out the HHK clustering algorithm and let the hierarchical clustering stop when it generates the largest number of clusters. The reason for this process is that while the hierarchical clustering stops at the point we mentioned, the HHK clustering may generate the largest number of super-rules as well as the most detailed information. We may apply the HHK on the super-rules again to generate super-super-rules if necessary. By this manner, we can form an SRT structure. The HHK clustering is summarised in Table 1. Table 1
The HHK clustering algorithm
(1)
Finish a complete agglomerative Hierarchical clustering on the data and record the number of clusters generated during the process
(2)
Run the agglomerative Hierarchical clustering again and stop the process when the largest number of clusters is generated
(3)
Execute the K-means clustering on the remaining data which are not processed in step (2). Use centroids in every cluster generated in step (2) as the initial centroids in the K-means clustering algorithm
6
B. Chen et al.
3
Experiment set-up
3.1 Data set The original data set used in this work includes 2710 protein sequences obtained from Protein Sequence Culling Server (PISCES) (Wang and Dunbrack, 2003). It is the data set that we used in Chen et al. (2007a, 2007b) to generate protein sequence motifs. No sequence in this database shares more than 25% sequence identity. The frequency profile from the HSSP (Jain and Dubes, 1988) is constructed based on the alignment of each protein sequence from the Protein Data Bank (PDB) where all the sequences are considered homologous in the sequence database. For the frequency profiles (HSSP) representation for sequence segments, each position of the matrix represents the frequency for a specified amino acid residue in a sequence position for the multiple sequence alignment. We also obtained secondary structure from DSSP (Kabsch and Sander, 1983), which is a database of secondary structure assignments for all protein entries in the PDB. DSSP originally assigns the secondary structure to eight different classes. In this paper, we convert those eight classes into three based on the following method: H, G and I to H (Helices); B and E to E (Sheets); all others to C (Coils). Five hundred fourty one different sequence motifs with window size of nine generated from the original data set (Chen et al., 2008) are included in this paper. Each window corresponds to a sequence segment, which is represented by a 9 × 20 matrix plus additional nine corresponding representative secondary structure information. Twenty rows represent 20 amino acids and 9 columns represent each position of the sliding window.
3.2 Dissimilarity measure According to Zhong et al. (2005), the city block metric is more suitable for this field of study since it will consider every position of the frequency profile equally. The following formula is used to calculate the dissimilarity between two sequence segments: L
N
Dissimilarity = ∑ ∑ Fk (i, j ) − Fc (i, j ) i =1 j =1
where L is the window size and N is 20 that represent 20 different amino acids. Fk(i, j) is the value of the matrix at row i and column j used to represent the sequence segment. Fc(i, j) is the value of the matrix at row i and column j used to represent the centroid of a give sequence cluster. The lower the dissimilarity value is, the higher the similarity two segments have.
3.3 Structure similarity measure Cluster’s average structure is calculated using the following formula:
∑
ws i =1
max( p i , H , p i , E , p i , C ) ws
Using Hybrid Hierarchical K-means clustering algorithm
7
where ws is the window size and Pi,H shows the frequency of occurrence of helix among the segments for the cluster in position i. Pi,E and Pi,C are defined in a similar way. If the structural homology for a cluster exceeds 70%, the cluster can be considered structurally identical (Zhong et al., 2005). If the structural homology for the cluster exceeds 60% and lower than 70%, the cluster can be considered weakly structurally homologous (Zhong et al., 2005).
3.4 HSSP-BLOSUM62 measure BLOSUM62 (Henikoff and Henikoff, 1992) is a scoring matrix based on known alignments of diverse sequences. By using this matrix, we may tell the consistency of the amino acids appearing in the same position of the motif information generated by our method. Because different amino acids appearing in the same position should be close to each other, the corresponding value in the BLOSUM62 matrix will give a positive value. For example, if the rule indicates that amino acids A1 and A2 are two elements that frequently appear in some specific position, then A1 and A2 should have similar biochemical property. Hence, the measure is defined as follows: If k = 0:
HSSP-BLOSUM62 measure = 0
Else If k = 1:
HSSP-BLOSUM62 measure = BLOSUM62ij
Else:
HSSP-BLOSUM62 measure =
∑ ∑ HSSP ⋅ HSSP ⋅ BLOSUM 62 ∑ ∑ HSSP ⋅ HSSP k −1
k
i =1
j = i +1 k −1 i =1
i
j
j = i +1
i
ij
k
j
k is the number of amino acids with frequency higher than a certain threshold in the same position (in this paper, 8% is the threshold). HSSPi indicates the percent of amino acid i appearing. BLOSUM62ij denotes the value of BLOSUM62 on amino acid i and j. The higher HSSP-BLOSUM62 value indicates more significant motif information. When k equals zero, it indicates that there is no amino acid appearing in the specific position, so the value for this measure is assigned zero. While k equals one, it indicates that there is only one amino acid appearing in the position. In this case, we assign the corresponding amino acid’s diagonal value in BLOSUM62.
3.5 HSSP-BLOSUM62 Gain To evaluate the cluster results, we proposed a new evaluation method called “HSSP-BLOSUM62 GAIN”. The idea comes from the fact that when we use Positional Association Rule algorithm to link two or more motifs, we cannot gain or lose any secondary structure similarity on each position of the new motif. This is because the computation of secondary structure similarity on each position considers all participated members; therefore, the value simply equals the average value. On the other hand, while the motifs are linked together, the noticeable amino acids on each position are changed. Under the circumstance of not sacrificing secondary structure similarity, we try to use this measure to show that our clustering results do not loss biochemical significance either. The “HSSP-BLOSUM62 GAIN” value is calculated by the increase in the new
8
B. Chen et al.
motif’s overall HSSP-BLOSUM62 value minus the average of all participated motifs’ overall HSSP-BLOSUM62 value.
4
Experimental results
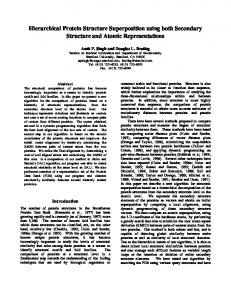
4.1 Super-Rule-Tree (SRT) In Zhong’s work (Zhong et al., 2005), 253 sequence motifs with high structural similarities are revealed by their improved K-means clustering algorithm with the fixed window size 10, and those motifs are grouped into 27 major patterns according to their common characteristics. This suggests that many motifs are similar to one another. Since the data set we used is very similar to Zhong et al. (2005), we selected both from PISCES (Zhong et al., 2005) (our PISCES list was more updated) and expended by HSSP, we believe that our results that come from our Fuzzy Greedy K-means (FGK) model (Chen et al., 2006) should have a similar trend. Therefore, we perform HHK clustering algorithm on our 541 motifs for SRT generation. As we discussed in Section 2.2, we carry out a complete hierarchical clustering and record the number of clusters generated during the process as shown in Figure 2. It is clear that a peak is found during 34.26% of the clustering and it generated 108 clusters. After we obtain this information, we may start the HHK clustering: initially, we run the hierarchical clustering until 108 clusters are generated; after that, by using the centre of these 108 clusters as the initial centroids, we run K-means clustering algorithm for the remaining motifs (the motifs that have not been clustered yet). After 108 level-1 super-rules are generated, since the number of super-rules is still large, we perform another HHK clustering. Figure 3 is the analysis of when to stop the hierarchical clustering. In the end, we construct a SRT as shown in Figure 4. Figure 2
The relation between percentages of hierarchical clustering is completed and the numbers of clusters are generated for level-1 super-rule generation (see online version for colours)
Using Hybrid Hierarchical K-means clustering algorithm Figure 3
9
The relation between percentages of hierarchical clustering is completed and the numbers of clusters are generated for level-2 super-rule generation (see online version for colours)
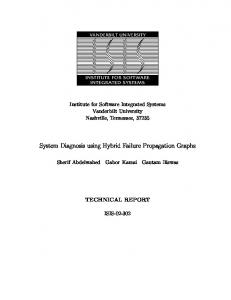
4.2 Super-rules presentation Figure 5 gives an example of level-1 super-rule 48, which belongs to level-2 super-rule 6 (EC/CEC) and its components: motif #102, 123, 138 and 380. Figure 6 gives an example of level-1 super-rule 2, which belongs to level-2 super-rule 2 (all Helixes) and its components: motif #2 and 365. Figure 7 gives an example of level-1 super-rule 22, which belongs to level-2 super-rule 1 (all Helixes) and its components: motif #32 and 485. The motif presentation format is combined with amino acid logo (Crooks et al, 2004): •
The upper box gives the motif ID number, the number of members belonging to this motif and the average secondary structural similarity.
•
The graph demonstrates the type of amino acid frequently appearing in the given position by amino acid logo. It only shows the amino acid appearing with a frequency higher than 8%. The height of symbols within the stack indicates the relative frequency of each amino or nucleic acid at that position.
•
The x-axis label indicates the representative secondary structure and the structural similarity among all members to the position. For example, H70 indicates that the representative secondary structure is Helix and 70% of the whole members’ secondary structure is Helix to this position.
10 Figure 4
B. Chen et al. The Super-Rule-Tree (SRT) of 541 different sequence motifs
Using Hybrid Hierarchical K-means clustering algorithm Figure 5
Example of level-1 super-rule #48 generated from motif #102, 123, 138, 380 (see online version for colours)
Figure 6
Example of level-1 super-rule #2 generated from motif #2,365 (see online version for colours)
11
12 Figure 7
B. Chen et al. Example of level-1 super-rule #22 generated from motif #32, 485 (see online version for colours)
By analysing Figures 5–7, we can recognise that although the clustering is performed on the sequence (primary structure) base only, the secondary structures among these motifs are almost the same. The motifs #102, 123, 138 and 380 in Figure 5 not only all constructed in a Coil–Sheet–Coil for, but also start from two weak Coils followed by stronger Sheet structure and then ends in weak Coil (Only the motif #123 is slightly varied.). The motif 2 and 365 in Figure 6 show relative weaker secondary structure similarity on first position and ninth position. Despite that, all other motifs in the middle give extremely high secondary structure similarity (> 90%). Both motifs in Figure 7 start with five strong Helix and drop dramatically on 6th position. The last three positions are concluded by three strong Coils. We may also tell from the figures that the super-rule is an adequate representation of the motifs.
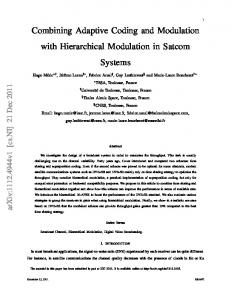
4.3 Super-rules evaluation We evaluate our clustering results by calculating the HSSP-BLOSUM62 measure on each super-rule. We calculate the average HSSP-BLOSUM62 Gain on level-1 super-rules that belong to the same level-2 super-rules. Figure 8 is the demonstration of the results. By analysing Figure 8, 8 out of 16 groups gain the HSSP-BLOSUM62 value, especially the super-rules belonging to level-2 super-rule 3, 6, 7, 14 and 15. On the other hand, 8 of those slightly lose the value. The overall average HSSP-BLOSUM62 gain equals 0.0356. Since the overall value is a positive value, we do not lose biochemical significance during the super-rule generation. Therefore, we may conclude that the superrules are generated under the circumstance of not sacrificing secondary structure similarity and even increase some biochemical significance.
Using Hybrid Hierarchical K-means clustering algorithm Figure 8
5
13
The average HSSP-BLOSUM62 gain on the level-1 super-rules that belong to the same level-2 super-rules (see online version for colours)
Conclusions
In this paper, we propose some novel ideas: •
we modified the HHK clustering algorithm into a parameter-free approach to reduce the human inference on the clustering results
•
Super-Rule-Tree (SRT) is a higher level of super-rule concept; it can serve as a visualised graph analysis of the similarity of motifs
•
a novel measure named “HSSP-BLOSUM62 GAIN” is proposed to evaluate the clustering results.
It is the first time that HHK clustering algorithm is applied to generate super-rules and SRT. The fully automatically generated SRT gives a clear big picture of relations between protein sequence motifs and motifs. Although the works described in this paper are merely based on protein primary structure computation, the results are also meaningful to protein secondary structure as well as the biochemical point of view. One of the most important future works is to solve another problem, similar motifs with shifted spaces, caused by fixed window size approach. Association rules with distance specification might be handy. For example, the information we obtain contains not only “If motif A appears in a protein sequence, then motif B also appears” but also considers “the information of the distance between motif A and B in the sequence”. The only problem is that if many motifs are similar to each other, then we may obtain lots of meaningless information such as “If motif A appears in a protein sequence, then motif B also appears with distance zero”. We may avoid this situation by feeding super-rules instead of original motif. Since fixed window size approach may cause two problems simultaneously, a systematic strategy that combines both SRT and ‘distance’ association
14
B. Chen et al.
rules is very reasonable. We believe that many further researches can be derived from this work.
Acknowledgements This research was supported in part by US National Science Foundation under grants CCF-0514750, and CCF-0646102. This work was also supported under by Science Foundation of Jiangsu Province of China (BK2007105).
References Bradley, P.S. and Fayyad, U.M. (1998) ‘Refining initial points for K-means clustering’, Proc. 15th International Conf. on Machine Learning, Madison, Wisconsin, USA p.727. Brown, D.E. and Huntley, C.L. (1990) ‘A practical application of simulated annealing to clustering’, Pattern Recognition, Vol. 25, No. 4, pp.401–412. Chen, B., Tai, P.C. and Harrison, R. (2005) ‘Novel hybrid hierarchical-K-means clustering method (HK-means) for microarray analysis’, Computational Systems Bioinformatics Conference, 2005, Workshops and Poster Abstracts. IEEE, Stanford University, California, USA, pp.105–108. Chen, B., Tai, P.C., Harrison, R. and Pan, Y. (2006) ‘FGK model: an efficient granular computing model for protein sequence motifs information discovery’, IASTED Proc. International Conference on Computational and Systems Biology (CASB), Dallas, pp.56–61. Chen, B., Pellicer, S., Tai, P.C., Harrison, R. and Pan, Y. (2007a) ‘Super granular SVM feature elimination (Super GSVM-FE) model for protein sequence motif information extraction’, Computational Intelligence and Bioinformatics and Computational Biology, 2007, CIBCB’07. IEEE Symposium on, Honolulu, Hawaiii, USA, pp.317–322. Chen, B., Pellicer, S., Tai, P.C., Harrison, R. and Pan, Y. (2007b) ‘Super granular shrink-SVM feature elimination (Super GS-SVM-FE) model for protein sequence motif information extraction’, Bioinformatics and Bioengineering, 2007. BIBE 2007. Proceedings of the 7th IEEE International Conference on, Boston, MS, USA, pp.379–386. Chen, B., Pellicer, S., Tai, P.C., Harrison, R. and Pan, Y. (2008) ‘Efficient super granular SVM feature elimination (Super GSVM-FE) model for protein sequence motif information extraction’, Int. J. Functional Informatics and Personalised Medicine, Vol. 1, pp.8–25. Crooks, G.E., Hon, G., Chandonia, J.M. and Brenner, S.E. (2004) ‘WebLogo: a sequence logo generator’, Genome Research, Vol. 14, pp.1188–1190. He, J., Chen, B., Hu, H.J., Harrison, R., Tai, P.C., Dong, Y. and Pan, Y. (2005) ‘Rule clustering and super-rule generation for transmembrane segments prediction’, IEEE Computational Systems Bioinformatics Conference Workshops (CSBW’05), Stanford University, California, USA, pp.224–227. Henikoff, S. and Henikoff, J.G. (1992) ‘Amino acid substitution matrices from protein blocks’, Proceedings of the National Academy of Sciences of the United States of America, Vol. 89, pp.10915–10919. Hu, J., Ray, B.K. and Singh, M. (2007) ‘Statistical methods for automated generation of service engagement staffing plans-References’, IBM Journal of Research and Development, Vol. 51, pp.281–293. Jain, A.K. and Dubes, R.C. (1988) Algorithms for Clustering Data, Prentice-Hall, Inc., Upper Saddle River, NJ, USA. Kabsch, W. and Sander, C. (1983) ‘Dictionary of protein secondary structure: pattern recognition of hydrogen-bonded and geometrical features’, Biopolymers, Vol. 22, pp.2577–2637.
Using Hybrid Hierarchical K-means clustering algorithm
15
Karypis, G., Han, E. and Kumar, V. (1999) Multilevel Refinement for Hierarchical Clustering, Defense Technical Information Center. MacQueen, J. (1967) ‘Some methods for classification and analysis of multivariate observations’, Proceedings of the 5th Berkeley Symposium on Mathematical Statistics and Probability, Berkeley, California, USA, Vol. 1, p.14. Ohler, U. and Niemann, H. (2001) ‘Identification and analysis of eukaryotic promoters: recent computational approaches’, Trends in Genetics, Vol. 17, pp.56–60. Pelleg, D. and Moore, A. (2000) ‘X-means: extending K-means with efficient estimation of the number of clusters’, Proceedings of the 17th International Conf. on Machine Learning, Stanford University, California, USA, pp.727–734. Wang, G. and Dunbrack, R.L. (2003) PISCES: a Protein Sequence Culling Server, Bioinformatics, Vol. 19, No. 12, pp.1589–1591. Zhang, T., Ramakrishnan, R. and Livny, M. (1996) ‘BIRCH: an efficient data clustering method for very large databases’, Proceedings of the 1996 ACM SIGMOD International Conference on Management of Data, Montreal, Canada, pp.103–114. Zhong, W., Altun, G., Harrison, R., Tai, P.C. and Pan, Y. (2005) ‘Improved K-means clustering algorithm for exploring local protein sequence motifs representing common structural property’, NanoBioscience, IEEE Transactions on, Vol. 4, pp.255–265.