Lexical Navigation: Using Incremental Graph Drawing for Query Refinement Daniel Tunkelang Carnegie Mellon University, School of Computer Science
Roy J. Byrd James W. Cooper IBM T. J. Watson Research Center
Abstract Query refinement is a powerful tool for a document search and retrieval system. Lexical navigation—that is, the exploration of a network that expresses relations among all possible query terms—provides a natural mechanism for query refinement. An essential part of lexical navigation is the visualization of this network. This dynamic visualization problem is essentially one of incrementally drawing and manipulating a non-hierarchical graph. In this paper, we present the graph-drawing system we have developed for lexical navigation.
1.
Introduction
The central challenge for users of document retrieval systems is to create queries that are effective at retrieving all and only those documents that meet the users' information requirements. The Lexical Navigation system [2] was designed to help meet this challenge. Its approach is to construct a lexical network representing concepts and relationships found in the entire document collection, and to use this network to prompt users with candidate terms for query refinement. The subject of this paper is a graph drawing system for displaying and navigating large lexical networks. The next section describes lexical networks and presents our motivation for using them for query refinement. Section 3 describes our graph drawing system. Section 4 illustrates the system in action and compares it to DEC's Visual LiveTopics. Section 5 outlines the status of our work and plans to extend it. We note that [6] describes a related but limited approach. Our work is independent. 2.
Lexical Networks
When translating an information requirement into a query for a document retrieval system, a user must construct a query using terms that match those found in database documents. The user faces the "vocabulary problem" described in [7]. One aspect of this problem is specificity; for example, the query term "fruit" will not be as helpful as "pear," "nectarine," or "raisin," assuming that the latter concepts are part of the information requirement. Another aspect is ambiguity. An otherwise unconstrained query containing the term "nut" could return documents related to hardware, seeds, and eccentric people. Finally, there is the problem that (according to [1] and [17]) large full-text databases contain many different expressions for the same concept. Manual and automatic techniques for enhancing queries are described in [8], [11], [17], and [18]. The techniques follow two themes: query expansion using terms obtained from thesauruses or co-occurrence lists, and relevance feedback—that is, adding query terms obtained from documents known to be relevant. Despite some successes (see [18]), automatic techniques have serious limitations. Thesauruses rarely contain the most useful types of information for query expansion. Published references miss current names and technical terms. Also, thesauruses often contain only synonym, hypernym, and hyponym relations. Actual relations are richer and often domain-specific. At the same time, there is no reliable means for automatically disambiguating query terms. In general, these techniques ignore the best sources of good query terms: the document collection itself and the user.
We address the above problems using a technique called "lexical navigation," which we developed for the LexNav document query and retrieval system. In LexNav, we address the vocabulary problem by analyzing all of the collection's documents and by leveraging the user's intuition about concept relations. Before queries begin, we use a suite of text analysis tools called "Talent" to develop a vocabulary of the ordinary words, proper names, and largely multi-word technical terms from the entire collection. Additional Talent tools organize the vocabularies into an extensive set of relationships consisting of triples of . Once extracted, the entire set of relationships for a collection is organized into a "lexical network," in which the vocabulary items are the nodes and the relations are the links. The nodes, which represent concepts in the subject domain of the document collection, contain a number of attributes, including: the canonical form and other variant forms of the vocabulary item, the category (term, person, place, organization, etc.), and occurrence statistics. The links in the lexical network represent the domain relationships among concepts. They contain the name of the relationship, if known, the strength of the relationship, represented as a number between 0 and 100, and the direction of the relationship. These relationships and the networks they produce are overwhelmingly non-hierarchical. Lexical networks are stored in a database, from which individual nodes and links can be efficiently accessed. Please see [2] for more details about the properties of Lexical Networks. Lexical navigation allows the user to explore the contents of lexical networks derived from the collection being queried. By showing the user domain-specific names and terms related to his/her original query, lexical navigation reminds the user of alternative concepts and labels for original query concepts that might be useful for improving the query. We model this exploration of the domain's concept space as a navigation through the lexical network from some starting point related to the query. 3.
Visualizing the Lexical Network
LexNav’s first user interface displayed lexical networks in tabular form. Users could click on a displayed node in order obtain a new list box containing relations which linked it to other nodes. Although in principle powerful enough to explore a lexical network, the list box interface was not adequate for meeting our goal of providing an intuitive navigation mechanism for lexical networks. The lexical network described in the previous section is a large, non-hierarchical network. Its size—ranging from thousands to millions of terms—precludes the possibility of visualizing the entire network simultaneously. The lack of hierarchy rules out approaches that assume a taxonomy of terms. We need a way to navigate relevant portions of the network and portray its general class of relations among terms. The literature (see [4]) categorizes graph drawing algorithms according to whether they presume a hierarchy (or near hierarchy) among the nodes. Algorithms for drawing hierarchies are mostly based on [12]. For non-hierarchical networks, most approaches use simulated physical models based on [5]. They are generally slow and unreliable, since the lack of a hierarchy makes the problem space unwieldy. There is some consensus regarding the desirable aesthetics for drawings of non-hierarchical networks: nodes connected by short paths in the network should be drawn near each other, and edge crossings should be avoided. The former tells the user that physical proximity in the drawing corresponds to logical proximity in the network. The latter helps ensure the clarity of the drawing. In addition, there is the common-sense requirement that node and edge labels should be legible, and that nodes not overlap.
Recall that we are dynamically presenting the user with a small part of the network. The interactivity of the application raises the need for a dynamic algorithm that can draw the network incrementally with enough constancy for the user to maintain a sense of the state of the network and his/her current position in it. Constancy is the vague notion that small modifications to the network should not substantially change the drawing. Only recently have researchers been paying serious attention to the problem of incremental graph drawing (see [10] and [13]). Our present application illustrates its importance. We have developed two drawing algorithms based on [14] and [15]. Both algorithms use a cost function based on [5] and performs incremental placement in such a way as to achieve a reasonable response time and preserve constancy of the drawing. The cost function has three components: a node-node “electrical” repulsion, an edge “spring” energy, and, for the first algorithm, edge-crossing avoidance. The repulsion models Coulomb’s Law: the energy for each pair of nodes is proportional to the inverse square of the distance between them. The spring energy models Hooke’s Law: the energy for each edge is proportional to the square of the difference between its length and its rest length, which corresponds to the strength of the relation. For the first algorithm, there is a constant energy for each edge crossing in the drawing. The heart of both algorithms is inserting the neighbors of already placed nodes. The first algorithm splits node insertion into two cases, depending whether the new node has at least two neighbors already placed in the current drawing. If the new node has only one placed neighbor, then the algorithm inserts the new node by splitting the largest angle between two edges incident to that neighbor; otherwise, it uses sampling techniques from [14]. In both cases, it then “makes room” for the new placement by creating a rectangle of space around it to avoid overlap with the other nodes while minimally perturbing their positions. The second algorithm is discussed in [15]. Having established an initial position in the lexical network, the user navigates it on a scrollable canvas. Operations include “growing” nodes to see their neighbors (color indicates whether a node has unseen neighbors), dragging nodes to modify the drawing, combining nodes into clusters, and accessing a node’s attributes. The graph drawing system has been implemented as a Java 1.1 client/server application: the client can be an applet while the server is an application using Java RMI and JDBC to connect to the data base containing the lexical network. 4.
Example Scenarios and Comparison with Visual LiveTopics
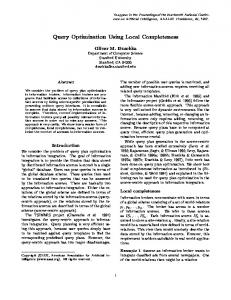
We illustrate the operation of our system with the scenarios in Figures 1 through 4. The database used in this scenario was extracted from a 10 M portion of Wall Street Journal data from [9], and contains roughly 20,000 nodes and 50,000 links. To our knowledge, DEC's Visual LiveTopics (VLT) system (see [3], [16]) is the only other implemented system which uses graphical layout of lexical networks for query reformulation. Significant differences between VLT and LexNav, include: §
VLT establishes position in the network based on the hit-list obtained by processing the original query, whereas LexNav obtains its initial position directly from the query.
§
VLT drawings are static, while LexNav permits incremental movement within the network without requiring the processing of intermediate queries.
§
VLT network nodes are single words, while LexNav's nodes are often multi-
word proper names and domain terms. Furthermore, by construction, a lexical network node represents the canonical form and all variants of the underlying term. §
VLT’s inter-word relationships are precomputed, unnamed, and (apparently) static, whereas LexNav uses Talent to compute new lexical networks for each collection, containing domain-specific names, terms, and relationships.
1. The term “handwriting recognition is placed and expanded to show the terms immediately surrounding it. All of the relations show are bidirectional and unnamed.
5.
Status and Future Plans
Our system has been incorporated in the user interface client of the LexNav document query and retrieval system. We have demonstrated it to researchers and developers at IBM, as well as to IBM customers. As explained earlier, lexical networks are too large to be viewed in their entirety. In the LexNav system, our largest network was extracted from a 140 M collection of financial and technical documents and comprises 51,000 nodes and over 85,000 links. Since performance is independent of the total size of the network, we expect to scale up to significantly larger collection and network sizes. Scale and performance may become issues for local complexity. If a node has too many neighbors, both the aesthetics and performance of layout deteriorate. We plan to introduce summarizing conventions to address this issue. The user could expand summary nodes using display techniques more appropriate than graph layout, e.g. a list box. We are also developing filtering strategies. The node categories, relation types, relation strengths, and other attribute data stored in lexical networks provide a rich basis for controlling the size and complexity of local network neighborhoods.
Bibliography [1] Bates, Marcia J. “Human, Database, and Domain Factors in Content Indexing and Access to Digital Libraries and the Internet,” Allerton, 1996 [2] Cooper, James W. and Byrd, Roy J., "Lexical Navigation: Visually Prompted Query Expansion and Refinement" in Proceedings of the 2nd ACM International Conference on Digital Libraries, July 1997.
[3] DeJesus, Edmund X., "The Searchable Kingdom" in Byte, June 1997. [4] Di Battista, Giuseppe et al., "Annotated Bibliography on Graph Drawing Algorithms" in Computational Geometry: Theory and Applications 4, 1994. [5] Eades, Peter, "A Heuristic for Graph Drawing,'' in Congressus Numerantium 42, 1984. [6] Fowler, Richard H., Wilson, Bradley A., and Fowler, Wendy A. L. “Information Navigator: An information system using associative networks for display and retrieval”, Report NAG9551, No, 92-1, Dept of Computer Science, University of Texas - Pan American, Edinburg, TX. [7] Furnas, G. W, Landauer, T. K., Gomes, L. M., and Dumais, S. T. “The Vocabulary Problem in Human-System Communication,” in Communications of the ACM, vol. 30, no. 11, November 1987, pp. 964-971. [8] Harman, D. “Relevance Feedback and Other Query Modification Techniques,” in W. B. Frakes and R. Baeza-Yates, eds., Information Retrieval: Data Structures and Algorithms, Prentice-Hall, 1992. [9] NIST TIPSTER Information-Retrieval Test Research Collection, on CD-ROM, published by the National Institute of Standards and Technology, Gaithersburg, MD, 1993. [10] North, Stephen C., “Incremental Layout in DynaDAG,” in Proceedings of Symposium on Graph Drawing, 1995. [11] Schatz, Bruce R., Johnson, Eric H., Cochrane, Pauline A., and Chen, Hsinchun,” Interactive Term Suggestion for Users of Digital Libraries,” in Proceedings of ACM Digital Libraries Conference, 1996. [12] Sugiyama, Kozo et al., "Methods for Visual Understanding of Hierarchical Systems" in IEEE Transactions on Systems, Man, and Cybernetics 11, No. 2, 1981. [13] Tom Sawyer, on the World-Wide Web at http://www.tomsawyer.com. [14] Tunkelang, Daniel, "A Practical Approach to Drawing Undirected Graphs", Technical Report CMU-CS-94-161, Carnegie Mellon University, June 1994. [15] Tunkelang, Daniel and Wegman, Mark, “Applying Numerical Approximation to Graph Drawing,” unpublished manuscript. To request, please send email to
[email protected]. [16] Visual LiveTopics, on the World-Wide Web at http://www.altavista.digital.com. [17] Voorhees, E. M. “Query Expansion using Lexical-Semantic Relations,” in Proceedings of the 17th Annual ACM-SIGIR Conference, 1994, pp. 61-69. [18] Xu, Jinxi and Croft, W. Bruce “Query Expansion Using Local and Global Document Analysis,” Proceedings of the 19th Annual ACM-SIGIR Conference, 1996, pp. 4-11.