Experiments in the Automatic Marking of ER-Diagrams Pete Thomas
Kevin Waugh
Neil Smith
Department of Computing Open University Milton Keynes, UK +44 (0)1908652695
Department of Computing Open University Milton Keynes, UK +44 (0)1908652695
Department of Computing Open University Milton Keynes, UK +44 (0)1908652695
[email protected]
[email protected]
[email protected]
ABSTRACT In this paper we present an approach to the computer understanding of diagrams and show how it can be successfully applied to the automatic marking (grading) of student attempts at drawing entity-relationship (ER) diagrams. The automatic marker has been incorporated into a revision tool to enable students to practice diagramming and obtain feedback on their attempts.
Categories and Subject Descriptors K.3.2 [Computer and Information Systems Education]: computer science education.
General Terms Experimentation.
Keywords Diagram understanding, automatic grading, entity-relationship diagrams, teaching tool.
1. INTRODUCTION In this paper we present an approach to the computer understanding of diagrams and show how it can be successfully applied to the automatic marking (grading) of student attempts at drawing entity-relationship (ER) diagrams. A great deal of activity in diagrammatic reasoning has focused on precise diagrams, such as the use of diagrams in mathematic proof [6] and visual query interfaces to GISs [1]. In our applications, the diagrams are imprecise. That is, the required features of such diagrams are either malformed or missing, or extraneous features are included. Imprecise diagrams frequently occur in student answers to assignment questions. Our interest in this area has arisen from our work in the automatic grading of free-form text assignment answers [10,11]. The automatic grading of answers in textual form has received much attention over recent years [2,8]. Our approach to marking diagrams is similar in that we currently do not attempt to address Permission to make digital or hard copies of all or part of this work for personal or classroom use is granted without fee provided that copies are not made or distributed for profit or commercial advantage and that copies bear this notice and the full citation on the first page. To copy otherwise, or republish, to post on servers or to redistribute to lists, requires prior specific permission and/or a fee. ITiCSE 05, June 27–29, 2005, Lisbon , Portugal. Copyright 2005 ACM 1-59593-024-8/05/0006…$5.00.
any higher-order semantic structures, which is equivalent to looking for key words and phrases in a sentential answer. One diagrammatic grading system is DATsys [14], a diagrammatic front-end to the CourseMaster marking system. DATsys provides a method for constructing bespoke diagram editors, but does little to address how those diagrams are graded.
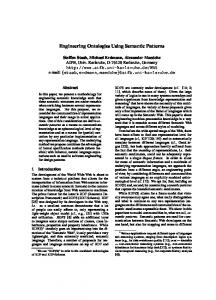
2. DIAGRAM UNDERSTANDING The approach we have taken to the understanding of diagrams [9] is in five stages which we have named segmentation, assimilation, identification, aggregation and integration. The first two stages translate a raster-based image into a set of diagrammatic primitives such as boxes, lines and text. The output from a drawing tool, such as the one illustrated below for constructing ER-diagrams, is effectively a set of diagrammatic primitive objects each with its own set of attributes, including special coordinates. The use of a tool makes the first stages redundant by removing all inaccuracies. The identification stage uses domain knowledge to identify what we have called minimal meaningful units (MMUs). Thus, a line between two boxes in an ER-diagram is taken to represent a relationship between two entities, whereas an arrow between two boxes is taken to represent a transition, in time, between two actions in the domain of processor architectures. Therefore, an association between two boxes denoted by a line is an MMU; however the representation and meaning is domain specific. The identification stage identifies all MMUs contained within the set of diagrammatic primitives. The aggregation stage combines MMUs into higher level, abstract features. For example, the diagram shown in Figure 1 consists of two pipelines and an association between them. A pipeline consists of three associations (MMUs). Fetch
Decode
Execute
Write
forward Fetch
Decode
Execute
Write
Figure 1. A processor pipeline architecture. The final stage, interpretation, looks for meaning in a diagram. In our current application, meaning is ascribed to a student generated
diagram through comparison with a specimen solution (another diagram represented as a set of abstract features) for which a grade, based on the degree of similarity, is generated. In general, a student generated diagram is imprecise in the sense that it can be incomplete, contain extraneous material, or be malformed (in the sense that it does not conform to standard rules for drawing specific features in the given domain). An example would be illustrated by Figure 1 if the arrows were missing. In this case, associations can be inferred from special considerations. While it would be possible to design a drawing tool to enforce the rules (and one might wish to do so in a teaching context), we felt that, for assessment purposes, there should be some latitude in what the tool would accept.
performing less well where students scored poorly. If this machine tool were a human marker the monitoring process would describe it as strict at the lower achievement end of the assessment scale. Table 1. Typical marks: first experiment Human mark
25
22
20
20
18
13
23
15
25
21
Auto mark
23
23
21
22
20
18
24
18
25
21
25
20
22
21
22
23
15
25
20
17
25
21
25
25
21
23
22
23
24
21
25
22
20
25
21
25
Tutor
3. EXPERIMENTS AND RESULTS
In both experiments, the student diagrams were marked by a number of independent tutors working with a specimen solution and mark scheme provided by the course presentation team. In our distance education system, tutors’ work is monitored to ensure consistency of marking between tutors. Figure 2 shows the specimen solution to illustrate the relative simplicity of the expected answer.
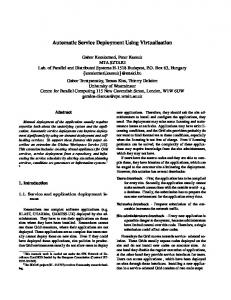
7
6
No of student diagrams
Our approach to automatic marking has been tested in two experiments based on a third-level undergraduate Database course in which students are asked to draw ER-diagrams that model scenarios specified in their assignments [15]. The first experiment examined student answers to a well-structured problem with limited degrees of freedom. We expected all students to do well on this question and we hoped for good results from the automatic marker. The second experiment looked at answers to a much more open-ended question appearing in the course’s final assignment. Here we expected a much more varied set of answers and the marking algorithm to perform less well as students could produce answers which were valid, but which varied from the model solution.
Auto
8
5
4
3
2
1
0 25
23
22
21
20
19
18
17
16
15
14
13
Score
Figure 3. Marks comparison: first experiment. Table 2. Comparison of human vs machine markers: first experiment Mean
St. dev
Range
Human mark
21.35
3.429
13-25
Machine mark
22.42
2.120
18-25
When we look at the correlation between the two sets of marks (Table 3), Pearson’s correlation coefficient is 0.925, (which is significant at the 0.01 level, two-tailed, N=26). Spearman’s rho statistic can be used to see how well the automatic marker ranks the students compared to the human markers and we obtain 0.931 (which is significant at the 0.01 level, two-tailed, N=26). These results show excellent correspondence between the two sets of marks for both the direct comparison with human marks and with the ranked order of student answers. Table 3. Correlation statistics: first experiment Figure 2. Specimen solution: first experiment. Table 1 and Figure 3 show the marks awarded by the tutors and the automatic marker on the first experiment (26 students). The maximum mark for the question was 25. Figure 3 shows the number of diagrams gaining a particular mark. The descriptive statistics given in Table 2 show a strong similarity with the results we have obtained in experiments with the machine marking of text [11,13]. The mean marks show good agreement but the standard deviation illustrates that the automatic marker provides a narrower range of marks than the human markers,
Pearson correlation coefficient
Spearman’s rho
0.925**
0.931**
** Significant at the 0.01 level, 2-tailed, N=26 Turning now to the second experiment, Figure 4 shows the specimen solution, which is slightly larger than the one in the first experiment. The question was substantially harder than in the first experiment. Table 4 gives the descriptive statistics for the second experiment. Here we had fewer student answers to analyse (14, a subset of the
24 in the first experiment). The maximum mark available for this question was 12. Table 4. Comparison of markers: second experiment Mean
St. dev
Range
Human mark
8.25
2.34
4-11
Machine mark
7.79
2.01
5-11
As expected, the students found this question harder than in the first experiment, but the automatic marker’s performance in terms of comparability with human markers was better. Note that, once again, the standard deviation is smaller for the automatic marker than the human markers
Table 7. Second experiment with synonym identification. Pearson correlation coefficient
Spearman’s rho
0.925**
0.931**
** Significant at the 0.01 level, 2-tailed, N=14
4. DISCUSSION The results outlined above were both pleasing and, to some extent, unexpected. The nature of the questions in the two experiments was very different. In the first experiment, the question was very precise, leaving very little scope for students to choose their own labels (names for the entities and relationships), whereas the question in the second experiment described its scenario with much less precision, providing considerable scope for choice of both relationships and labels. We therefore expected students to provide good solutions to the first question (they did) and for the automatic marker to perform well (it did). In the second experiment we expected much more diversity in student answers with a wider and generally poorer set of marks (they were). However, we expected the automatic marker to be much less accurate, which it wasn’t. The automatic marker incorporates a number of parameters (weights) that can affect its marking performance. For example, in both experiments we weighted the existence of a relationship equally with the correctness of the type of that relationship. However, we gave more importance to the choice of ‘correct’ names for the relationships in the first experiment compared to the second – in accordance with the marking scheme provided to the human markers. In our teaching environment, in order to ensure consistency between human markers, we provide detailed marking instructions which may have allowed us to encode the automatic marker’s mark scheme accurately. However, we did no post-hoc tuning of parameters.
Figure 4. Specimen solution: second experiment. The two correlation measures, shown in Table 5, are slightly higher than for the first experiment, and hence still highly significant, an unexpected yet pleasing result. Table 5. Correlation statistics: second experiment. Pearson correlation coefficient
Spearman’s rho
0.928**
0.935**
** Significant at the 0.01 level, 2-tailed, N=14 After completing the two experiments, we added an additional stage to the marking algorithm to look for potential synonymous entity names because students were found to use names of their own choosing that might not be expected a priori, given the descriptions in the question. This stage, which we do not have space to describe in detail here, improved the simple descriptive statistics, as shown in Table 6, whilst maintaining the high correlations (Table 7). Table 6. Machine marker with synonym identification. Mean
St. dev
Range
Human mark
8.25
2.34
4-11
Machine mark
8.00
2.22
5-11
The method for determining a mark first computes a similarity measure (a value between 0 and 1) between relationships in the specimen solution and relationships in a student’s answer. Then, the best match is found – the match between relationships which maximises the overall similarity between diagrams. The best match is then scored according to the given mark scheme. This scheme does not guarantee to find the best plausible match – the matches between relationships that a human would necessarily agree are reasonable. We would expect that our maximization of similarities would be accurate when the student’s answers are (almost) correct but would not accurately reflect answers containing errors. And this is what we have observed. Clearly, we need to repeat the experiments with larger numbers of student answers. For prototypical experiments such as these we ask for student volunteers (an effect of the UK’s data protection act) which normally results in small data sets. We hope to be able to increase the size of our data sets for the next presentation of the course to include all students (several hundreds).
5. AN APPLICATION A by-product of the marking process is the ability to provide feedback to a student in the form of a commentary on the comparison between the student’s answer and the specimen solution. In particular, we show diagrammatically, the inferred correspondence between relationships in the two ER-diagrams.
This ability has been incorporated into a software ‘revision tool’ in which students are presented with a collection of typical assessment questions on the construction of ER-Diagrams. The tool contains a diagramming tool [12] with which students draw their answers. The tool then marks an answer and provides feedback in terms of a mark and a sequence of relationship diagrams. In addition, the tool also allows the student to view an interactive version of the specimen solution. That is, clicking on a specific part of the solution causes the tool to highlight those parts of the question which relate to the chosen part of the solution. Figure 5 shows the user interface to the revision tool. Figure 5. The revision tool.
6. FUTURE WORK As a direct follow-up to the work presented here, we intend to perform further experiments in the marking of ER-diagrams with larger student numbers and testing the usefulness of the revision tool. We also need to investigate a more ‘plausible’ maximization algorithm which may mean moving beyond the search for simple MMUs (the equivalent of key words and phrases in sentential
REFERENCES [1] Anderson, M., McCartney, R. (2003) Diagram processing: Computing with Diagrams. Artificial Intelligence 145 (1-2) 181-226 .
forms) and which can deal with marking schemes that deal with multiple plausible solutions. We also wish to apply this work to other domains starting with UML diagrams. In addition, we intend to examine whether our approach can be used in non-network-like domains.
7. SUMMARY In this paper we have described an approach to the understanding of diagrams in the domain of ER-diagrams. We have applied our approach to the problem of marking student answers to assessment questions in a database course with some success.
The results of experiments with two questions of different difficulty showed that the automatic marker produced results that were comparable to human markers with high correlation in terms of Pearson’s correlation coefficient and in the ranking of students. We have added a feedback facility to the automatic marker and built a revision tool to help students practice drawing ERdiagrams.
[2] Burstein, J., C. Leacock, et al. (2001). Automated Evaluation of Essays and Short Answers. In Proceedings Fifth International Computer Assisted Assessment Conference, Loughborough University, UK, Learning & Teaching Development, Loughborough University, 41-45.
[3] Chok, S.S. and Marriott, K. (1995) Parsing visual languages. In Proceedings of the Eighteenth Australian Computer Science Conference, Australian Computer Science Communications, 17, 90-98. [4] Donlon, J.J., Forbus, K.D. (1999) Using a geographic information system for qualitative spatial reasoning about traceability. In Proceedings of the Qualitative Reasoning Workshop, Loch Awe, Scotland. [5] Iizuka, K., Tanaka, J. and Shizuki, B (2001) Describing a drawing editor by using constraint multiset grammars. In Proceedings of the Sixth International Symposium on the Future of Software Technology (ISFST 2001), Zhengzhou, China. November, 2001. www.iplab.is.tsukuba.ac.jp/paper/international/iizukia-isfst2001.pdf
(accessed 02/06/04) [6] Jamnik, M. (1998) Automatic Diagrammatic proofs of Arithmetic Arguments. PhD Thesis, University of Edinburgh. [7] Marriott, K., Meyer, B. and Wittenburg, K.B. (1998) A survey of Visual Language Specification and Recognition. In Visual Language Theory, eds: Marriott, K and Meyer, B., Springer-Verlag, New York, 8-85, ISBN 0-378-98367-8. [8] Shermis, M.D, Burstein, J.C. (2003) (eds.) Automated Essay Scoring: a cross-disciplinary approach. Lawrence Erlbaum Associates, Mahwah, NJ, USA. ISBN 0-8058-3973-9. [9] Smith, N, Thomas, P.G. and Waugh, K. (2004) Interpreting Imprecise Diagrams. In Proceedings of the Third International Conference in the Theory and Application of Diagrams. March 22-24, Cambridge, UK. Springer Lecture Notes in Computer Science, eds: Alan Blackwell, Kim
Marriott, Atsushi Shimojima, 2980, 239-241. ISBN 3-54021268-X. [10] Thomas, P.G., Price, B., Paine, C. Richards, M. (2002) Remote Electronic examinations: an architecture for their production, presentation and grading. British Journal of Educational Technology (BJET), 33 (5) 539-552. [11] Thomas, P.G. (2003) Evaluation of Electronic Marking of Examinations, In Proceedings of the 8th Annual Conference on Innovation and Technology in Computer Science Education (ITiCSE 2003), Thesaloniki, Greece, 50-54. [12] Thomas, P.G (2004) Drawing Diagrams in an Online Exam, In Proceedings of the 8th Annual International Conference in Computer Assisted Assessment. Loughborough University, Loughborough, UK, 403-413. [13] Thomas, P.G. (2004) Grading Diagrams Automatically. Technical Report of the Computing Department, Open University, UK. TR2004/01. [14] Tsintsifas A., (2002), A Framework for the Computer Based Assessment of Diagram-Based Coursework, Ph.D. Thesis, Computer Science Department, University of Nottingham, UK. [15] Waugh, K.G., Thomas, P.G., Smith, N. (2004) Toward the Automated Assessment of Entity-Relationship Diagrams. In Proceedings of the 2nd LTSN-ICS Teaching, Learning and Assessment in Databases Workshop. Edinburgh. http://www.ics.ltsn.ac.uk/pub/databases04/index.html (accessed 22/11/04)