implies electronic and magnetic phase separation. ... structure calculations.7 Signatures of a second phase transi- ... dence of the entropy S in both crystals.
PHYSICAL REVIEW B
VOLUME 62, NUMBER 17
1 NOVEMBER 2000-I
Metallization and magnetic order in EuB6 S. Su¨llow,1,* I. Prasad,1,† M. C. Aronson,1 S. Bogdanovich,1,‡ J. L. Sarrao,2,§ and Z. Fisk2 1
Department of Physics, University of Michigan, Ann Arbor, Michigan 48109–1120 National High Magnetic Field Laboratory, 1800 East Paul Dirac Drive, Florida State University, Tallahassee, Florida 32310 共Received 9 February 2000兲
2
We present the results of field- and temperature-dependent resistivity and magnetization M measurements which show that colossal magnetoresistance in semimetallic EuB6 is not associated with its bulk Curie temperature T C ⫽12.6 K, determined by a scaling analysis of M (H,T), but with a second phase transition at T M ⫽15.5 K. We propose that metallization occurs at T M via the overlap of magnetic polarons. The separation of the charge delocalization and bulk magnetic ordering transitions implies electronic and magnetic phase separation.
The discovery of colossal magnetoresistance 共CMR兲 in rare-earth manganites and manganese pyrochlores has renewed interest in the properties of magnetic polarons.1 As has often been noted, CMR was also observed in a very different class of rare-earth magnets 关EuO,2 EuB6 ,3–5 Gd1⫺x Eux Se 共Ref. 6兲兴 almost 30 years ago. It is generally believed that magnetic polarons are present in all of these materials, and that the sensitivity of polaronic transport to field is responsible for CMR. Although EuB6 has historically been grouped with charge-doped rare-earth chalcogenides and oxides, in which the polaronic carriers are extrinsic, it has recently been shown that this intriguing material is a rare example of a low carrier density semimetal which also orders ferromagnetically.7–9 We present here a detailed study of the field- and temperature-dependent resistivity and magnetization M of EuB6 which suggests the presence of magnetic polarons in this system, and demonstrates that bulk magnetic order and metallization occur at different temperatures. This is a phenomenon unique to EuB6 , and we will argue that it implies electronic and magnetic phase separation. EuB6 crystallizes in the simple cubic CaB6 structure. The electronic structure is derived primarily from the hybridization of the boron p bands, filled by electrons donated by the Eu ions, which are found to be divalent by both photoemission10 and Mo¨ssbauer11 measurements. Electronic structure calculations7 indicate that small dilations of the boron octohedra cause overlap of the conduction and valence bands at the X points, rendering EuB6 semimetallic. Shubnikov–de Haas and de Haas–van Alphen measurements8,9 as well as angle-resolved photoemission 共ARPES兲 measurements10 confirm that EuB6 is a semimetal. Quantum oscillation studies found that the sample studied here has an intrinsic carrier density of 1.2⫻1020 cm⫺3 . 9 Neutron-diffraction measurements on EuB6 共Ref. 12兲 find that the spontaneous moment first appears near ⬃16 K, increases slowly as the temperature is lowered, and then displays quasi-mean-field behavior below ⬃12–13 K. The saturation moment of 6.9⫾0.2 B , measured at 1.5 K, is somewhat reduced from the nominal Eu2⫹ value of 7.94 B , but is in good agreement with the 7.02 B predicted by bandstructure calculations.7 Signatures of a second phase transition at 15.5 K have been found in the resistivity, the lowfield magnetization, and the zero-field specific heat.13,14 0163-1829/2000/62共17兲/11626共7兲/$15.00
PRB 62
Currently, there is no explanation for the origin of this second transition, or its relationship to the lower temperature transition, which we will argue is a bulk ferromagnetic transition. However, the pressure dependences of both transitions indicate that the conduction electrons mediate the magnetic order of the Eu moments.15 We present here the results of resistivity and magnetization measurements which show that the CMR in EuB6 is associated with this second, higher temperature transition, which we will call T M . Our primary experimental conclusion is that the ferromagnetic transition at T C ⬃12.6 K is preceded by a charge delocalization transition at T M , which we will argue results from the overlap of magnetic polarons. Large single crystals of EuB6 were prepared from an aluminum flux, using both natural abundance Eu and B, as well as 153Eu 共94–98 % enrichment兲 and 11B. Magnetization measurements were carried out in a Quantum Design superconducting quantum interference device magnetometer. The crystals are needle shaped, and the electrical resistance was determined with the current flowing parallel to the long axis, which is a principal crystallographic direction. By comparing positive and negative field sweeps, we determined that no measurable transverse resistance was included in our measurements at any temperature. Sample dependence is an important issue in EuB6 , since it is a system with a very small number of intrinsic carriers. In the course of our study, we have investigated a number of samples of dramatically different qualities. Most of the results reported in this paper are from measurements carried out on the same natural abundance, single crystal used previously for quantum oscillation measurements9 and high resolution x-ray-diffraction14 measurements. The residual resistivity of this sample is one of the lowest reported in the literature, and the specific heat and resistive anomalies at both transitions are extremely sharp, compared to previously published reports. Further, quantum oscillation measurements on this crystal find an extremely low extrinsic carrier concentration of one hole per 185 unit cells. We compare the electrical resistivity of this sample to that of another single crystal of EuB6 in Fig. 1共a兲. The second crystal has a much higher residual resistivity, and a single, broad resistive transition. Examination of the temperature derivative of the resistivity in Fig. 1共b兲 reveals that the lower 11 626
©2000 The American Physical Society
PRB 62
METALLIZATION AND MAGNETIC ORDER IN EuB6
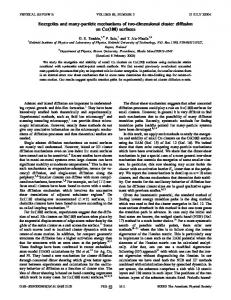
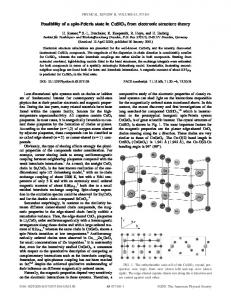
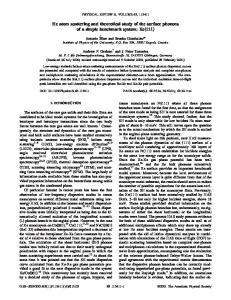
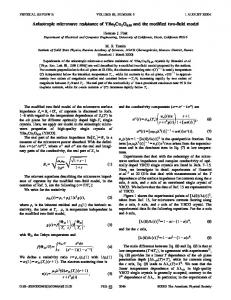
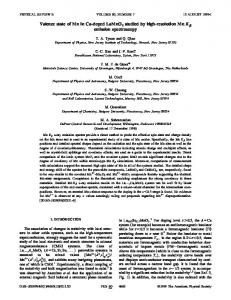
FIG. 1. A comparison of the temperature dependences of the electrical resistivity 共a兲 and the temperature derivative of the resistivity 共b兲 for two single crystals of EuB6 . Most of the results reported here were obtained on the sample represented by the filled circles.
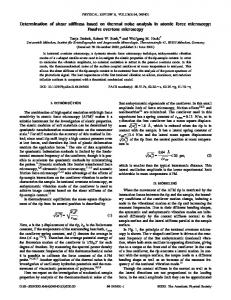
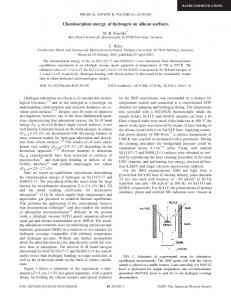
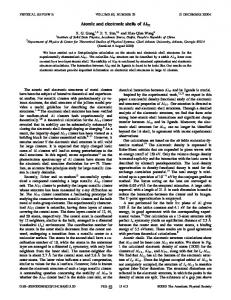
transition occurs at approximately the same temperature in the two samples, although the resistive transition is less temperature dependent in the second sample. The major difference between the two samples is that the upper transition is absent in the lower quality crystal. These results are echoed in the specific-heat measurements, shown for the two samples in Fig. 2. The dominant feature in the specific heat is the broad peak suggesting a magnetic transition at T C ⫽12.6 K with substantial magnetic disorder. As we have previously noted,14 the Eu2⫹ moment crystal-field degeneracy is lifted by the internal field of the ferromagnet, leading to a Schottky-like anomaly at low temperatures. The apparent shift of the 12.6 K specific-heat peak to higher temperatures in the higher quality sample indicates that there is less magnetic entropy under the peak in this sample, not that T C has changed. In addition, a distinct -like transition with a maximum at T M ⫽15.1 K is seen near the upper transition in the higher quality crystal, but is absent in the lower quality crystal. We have subtracted the phonon contribution to the specific heat, and computed the temperature depen-
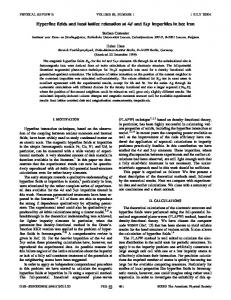
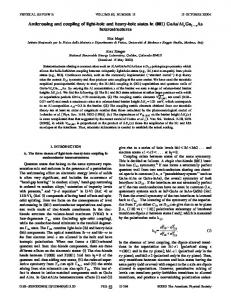
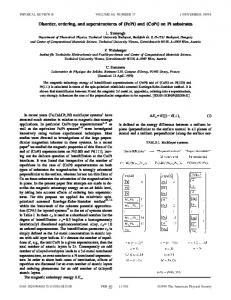
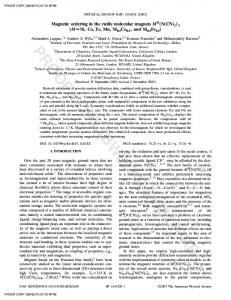
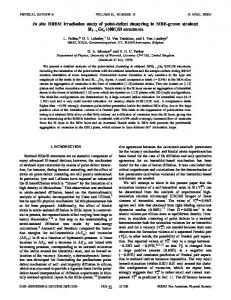
FIG. 3. The magnetization M as a function of the internal magnetic field at selected temperatures. Solid lines are guides for the eye.
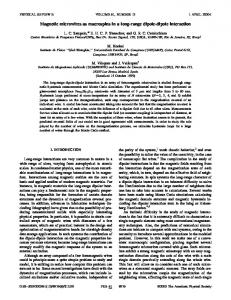
dence of the entropy S in both crystals. The result is plotted in Fig. 2共b兲. For both samples, the entropy saturates at high temperatures at a value close to R(3 ln 2), the expected value for a mole of Eu2⫹ ions. In the lower quality crystal, the entropy saturates at T C , while the entropy of the higher quality crystal changes more gradually with temperature, and continues to increase up to the upper transition T M . This result indicates that the gradual decrease in entropy between T M and T C cannot be the result of simple disorder broadening, as the effect is more marked in the less disordered sample. We conclude from these comparisons that the higher temperature transition is much more sample dependent than the lower transition, and is only well defined in the highest quality samples. Our first task is to determine whether ferromagnetic ordering occurs at the upper or lower transition, using an analysis of the field- and temperature-dependent magnetization. The field dependences of the magnetization for temperatures between 4.3 and 20 K are presented in Fig. 3. Here, the field is oriented along the 共100兲 crystalline axis of the sample, and has been corrected for demagnetization effects, which are only significant below 2000 Oe. We have used Arrott plots to determine the Curie temperature and critical exponents of these data. The underlying assumption of the Arrott plot is that it is possible to expand the field H in odd powers of the magnetization M:16 H/M ⫽a o ⫹a 1 M 2 ⫹a 2 共 M 2 兲 2 ⫹•••.
FIG. 2. A comparison of the specific heat C and the magnetic entropy S for the two samples of Fig. 1.
11 627
共1兲
We have replotted the data of Fig. 3 as H/M as a function of M 2 in Fig. 4. The intercept of the isotherms with the horizontal axis is the square of the spontaneous magnetization of the ferromagnet M 2S , while the intercept with the vertical axis is ⫺1 0 , the inverse of the zero-field susceptibility. Since demagnetization effects and domain reorientation generally dominate the low-field magnetization of ferromagnets, it is necessary to extrapolate these intercepts from the high-field magnetization. For this reason, we have omitted
11 628
¨ LLOW et al. S. SU
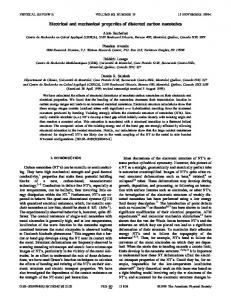
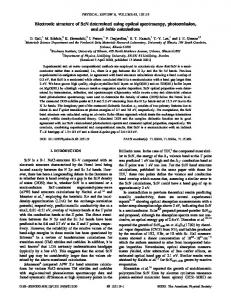
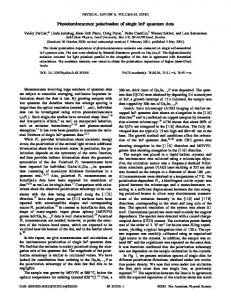
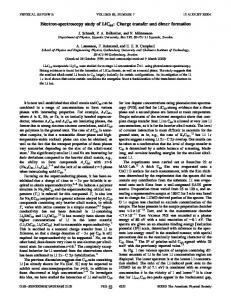
FIG. 4. Arrott plots of the magnetization isotherms. As described in the text, lines are polynomial fits to the high field, large M data. 共a兲 20 K, 共b兲 18.5 K , 共c兲 17.5 K , 共d兲 16 K , 共e兲 14.5 K , 共f兲 13 K, 共g兲 11 K, 共h兲 10 K, 共i兲 8 K, 共j兲 6.6 K, 共k兲 4.3 K.
data taken in fields of 2000 Oe and less. We have used thirdorder polynomials to generate the extrapolations which appear in Fig. 4. The Arrott plot analysis indicates that the spontaneous moment first appears between 11 and 13 K. We can obtain an accurate value for the Curie temperature T C by examining the temperature dependence of o , which appears in Fig. 5共a兲. The scaling analysis requires that o diverge as the temperature is lowered towards the ferromagnetic transition at T C , 0 (t)⬀t ⫺ ␥ , where t⫽(T⫺T C )/T C . We define the ⫺1 quantity T * ⫽ 关 d/dT(ln ⫺1 o )兴 ⫽(T⫺TC)/␥, which is plotted in Fig. 5共b兲. A least-squares analysis gives T C ⫽12.6 ⫾0.2 K, and ␥ ⫽0.88⫾0.01. As a consistency check, we see that this power law agrees well with 0 over more than a decade in reduced temperature, as shown in Fig. 5共a兲. The spontaneous magnetization M S extracted from the Arrott plot analysis is shown in Fig. 6共a兲. At the lowest temperatures, M S approaches the 7.94 B expected for Eu2⫹ mo-
FIG. 5. 共a兲 The extrapolated zero-field susceptibility 0 as a function of reduced temperature t⫽(T⫺T C )/T C . 共b兲 The temperature intercept of T * , defined in the text, determines the bulk ferromagnetic transition T C ⫽12.6⫾0.2 K. Solid lines are least-squares fits, described in the text.
PRB 62
FIG. 6. 共a兲 The temperature dependence of the spontaneous moment determined by the Arrott plot analysis. The line is a powerlaw fit using T C ⫽12.6 K. 共b兲 The spontaneous moment obeys a power law in reduced temperature 共solid line兲 with a slope  ⫽0.36⫾0.013.
ments. In the ferromagnetic phase, M S ⬀ 兩 t 兩 ⫺  . As demonstrated in Fig. 6共b兲, we find  ⫽0.36⫾0.02, using T C ⫽12.6 ⫾0.2 K. Again, the results of this power-law fit are compared to M S (T) in Fig. 6共a兲. The most stringent test of the scaling hypothesis is whether the magnetization curves can be described by the expression M 共 H,t 兲 ⫽t  f 共 H/t ␥ ⫹  兲
共2兲
for a wide range of the scaling variable H/t ␥ ⫹  . All the magnetization data with T⭓13 K have been replotted as M t ⫺  as a function of H/t ␥ ⫹  in Fig. 7 using the values T C ⫽12.6,  ⫽0.36, and ␥ ⫽0.88, taken from the Arrott plot
FIG. 7. Scaling of the magnetization M for fields H⭓0.2 T, and T⭓T C ⫽12.6 K. All fields have been corrected for demagnetization effects. 13 K (䊉), 13.5 K (䊊), 14 K (䊐), 14.5 K (䉭), 15 K (䉮), 15.5 K (䉰), 16 K (䉯), 16.5 K (〫), 17 K (*), 17.5 K 共⫹兲, 18 K ($), 18.5 K (%), 19 K (#), 19.5 K 共!兲, and 20 K 共@兲. Inset: The same quantities in a double log plot.
PRB 62
METALLIZATION AND MAGNETIC ORDER IN EuB6
FIG. 8. M /H int for fields of 75 G (䊉), 200 G (䊊), 1000 G (䊐), and 2000 G (〫). Solid lines are guides for the eye.
analysis. The scaling is excellent, and the inset to Fig. 7 shows that the scaling extends over almost three decades of the scaling variable H/t ␥ ⫹  . In summary, our analysis of the magnetization of EuB6 in fields greater than 2000 Oe reveals that bulk ferromagnetic order occurs at the lower transition, T C ⫽12.6⫾0.2 K. This result is in agreement with the neutron-diffraction measurement12 as well as with the presence of a large, but broad, specific-heat anomaly found near this temperature.14 The critical exponent  ⫽0.36⫾0.02 agrees well with theoretical estimates for the three-dimensional Heisenberg model, 0.365⫾0.003.17 However, the value for the exponent ␥ ⫽0.88⫾0.01 is in poor agreement with either the meanfield value ␥ ⫽1, or the three-dimensional Heisenberg model ␥ ⫽1.336⫾0.004. As we will argue below, we believe that this discrepancy may result from phase separation in EuB6 in the paramagnetic state, although the ferromagnetic state with T⭐T C is homogeneous. We stress that this scaling analysis is limited to fields above 2000 Oe, and has nothing to say about the low-field behavior. Magnetization measurements in very low fields indicate the onset of a small spontaneous moment at the upper transition as well, just as was found in the neutrondiffraction measurement.12 To demonstrate this, we have plotted M /H int as a function of temperature for demagnetization corrected fields H int ranging from 75–2000 Oe in Fig. 8. We have previously reported the detailed field dependences of this transition.14 In the lowest fields M /H int increases sharply near 15.5 K, while increased fields rapidly broaden and suppress the transition. The detailed temperature dependences of M /H int (T) can be quantitatively affected by uncertainties in the demagnetization corrections, as well as by the possibility of inhomogeneous field penetration in our nonellipsoidal sample. However, the rapid increase in M /H int below 15.5 K in low fields is a robust result, and indicates the presence of a spontaneous moment. Since an Arrott plot analysis is impossible in this field range, we cannot determine the magnitude of the spontaneous moment associated with the higher temperature transition. However, the entropy associated with the 15.5 K specific-heat anomaly in this sample is approximately 15% of the total R ln 8 measured at and below 15 K. Assuming this is entirely magnetic
11 629
FIG. 9. 共a兲 The temperature dependence of the resistivity of EuB6 in zero field 共a兲 and in fields of 0.05 T 共b兲, 0.1 T 共c兲, 0.2 T 共d兲, 0.5 T 共e兲. 153Eu11B6 (䊉) 共b兲 The temperature derivative of the resistivity for the same fields, as well as for 153Eu11B6 (䊉) at zero field. The larger residual resistivity (34 ⍀ cm) and broadened transition of the latter indicate that it is the lower quality crystal.
entropy, this suggests that approximately 15% of the Eu moments order at the higher temperature transition, and the remainder at the 12.6 K bulk transition. In addition, Fig. 8 suggests that magnetic fields suppress the spontaneous moment at T M . It would be of interest to test these conclusions by repeating the neutron-diffraction experiment with greater emphasis on temperatures between T M and T C , comparing results in zero field and in fields larger than 2000 Oe. The field and temperature dependences of the electrical resistivity show that charge transport is much more strongly affected by the 15.5 K transition than by the 12.6 K bulk ferromagnetic transition. The temperature dependences of the electrical resistivity in fixed external fields ranging from 0.05–0.5 T are presented in Fig. 9共a兲. In zero field, the resistance drops more than a factor of 30 from its value of ⬃330 ⍀-cm just above the Curie temperature to its residual value of 8.7 ⍀ cm at 1.2 K. The magnitude of this resistance drop is consistent with the loss of spin disorder scattering, and as expected, Fig. 9共a兲 shows that magnetic fields rapidly suppress the resistance drop. In a normal metallic ferromagnet, the temperature derivative of the critical scattering resistivity / T is a maximum at the Curie temperature.18 The presence of two phase transitions is dramatically revealed in Fig. 9共b兲, where we have plotted / T at different fields. The field dependences of the resistivity near the two transitions are very different. Magnetic fields modestly suppress the critical scattering found near the 12.6 K Curie temperature and broaden the transition. In contrast to this typical ferromagnetic behavior, the resistance near the upper transition is more rapidly suppressed, and the transition is dramatically broadened and shifted to larger temperatures. Figure 9共b兲 demonstrates that the maximum magnetoresistance occurs not at the lower temperature bulk ferromagnetic transition, but rather at the 15.5 K transition. The transition, which we define by the maximum in / T is 15.5 K in zero field and increases to 17.2 K in 0.2 T. We have also measured the zero-field resistance of a single crystal of EuB6 prepared with 153Eu and 11B, and the results are plotted in Figs. 9共a兲 and 9共b兲. The residual resis-
11 630
¨ LLOW et al. S. SU
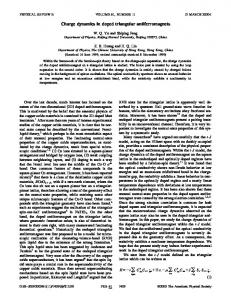
FIG. 10. 共a兲 The magnetoresistivity (H) at 4.9 K (䊉), 10 K (䊊), 13 K (*), 15.5 K (䊐), and 20 K 共⫹兲. The inset illustrates the procedure to extract the magnetic contribution * from the total magnetoresistivity for the data at 15.5 K: (䊐) total resistivity (H); 共solid line兲 metallic magnetoresistivity ⬀H 2 ; 共dashed line兲 magnetic magnetoresistivity * . The normalized ⌬ * (H)/ * (0) at the same temperatures is shown in 共b兲.
tivity of this sample is 34 ⍀ cm, suggesting a larger amount of disorder than in the natural abundance sample studied here. Figure 9共b兲 shows that neither of the resistive transitions displays a measurable isotope effect. Magnetic fields have the largest effect on the resistivity near the higher temperature transition. We have plotted the resistance as a function of demagnetization corrected field H int at several fixed temperatures in Fig. 10共a兲. At the lowest temperatures, the magnetoresistance is positive and quadratic in field, representing the metallic magnetoresistance ubiquitous in conducting hexaborides.9,19,20 As the temperature is raised, a negative contribution to the magnetoresistance appears at low fields, whose magnitude increases to a maximum near the 15.5 K transition. As demonstrated in the inset of Fig. 10共a兲, above 8 K it is possible to isolate the negative part of the magnetoresistance, * , by fitting and subtracting the high field, magnetoresistance, met ⬀H 2 , from the measured (H,T). The normalized magnetoresistance ⌬ * / * (H⫽0) is plotted in Fig. 10共b兲 at different temperatures. At every temperature, ⌬ * / * (H⫽0) approaches ⫺1 in high fields, indicating that the zero field magnetic magnetoresistance is completely suppressed. As Fig. 10共b兲 indicates, this is accomplished in the smallest fields when the temperature is near T M . The low-field magnetoresistance near T M is similar to those found in other CMR compounds,1,2,6 including rare-earth manganites. A comparison of the field- and temperature-dependent resistivity and magnetization is consistent with the resistivity originating with spin disorder scattering from the magnetic background, which we have shown is critical at T C ⫽12.6 K. Figure 11 details the relationship between the absolute value of ⌬ * / * and M at different temperatures, with magnetic field as the implicit variable. For temperatures above 15 K, data at fields from 0.2–5 T fall onto a single curve ⌬ * / * (M /M 0,0), where M 0,0 is the zero-temperature spontaneous moment, taken to be 6.9 B per Eu. For T ⭐15 K, ⌬ * / * is initially almost independent of magnetization, suggestive of ferromagnetic intergranular scattering,
PRB 62
FIG. 11. The absolute value of the magnetic magnetoresistivity ⌬ * / * (H⫽0) vs the normalized magnetization M /M 0,0 . Symbols have the same meaning as in Fig. 7. The inset displays the data between 15 and 20 K. The solid line represents ⌬ * / * (H⫽0) ⫽C(M /M 0,0) 2 , with C⫽75⫾20 for M /M 0,0⬍0.07.
but eventually rejoins the universal curve at a value of M /M 0,0 which increases with decreasing temperature. The inset of Fig. 11 compares the absolute value of ⌬ * / * (0) with the theoretical expression for spin disorder scattering in low fields: ⌬ * / * (0)⫽C(M /M 0,0) 2 . The agreement is reasonable for M /M 0,0⭐0.07 and gives C⫽75⫾20. The same qualitative relationship is found in the rare-earth manganites.21 While C is expected to increase with decreasing carrier concentration,22,23 the value in EuB6 is at least an order of magnitude larger than these theories predict, given the known carrier concentration. It follows from our analysis of the scaling properties of M (H,T) and from the relationship between ⌬ * / * and M /M 0,0 in Fig. 11 that ⌬ * / * can also be scaled with H and reduced temperature t⫽(T⫺T C )/T C , with T C ⫽12.6 K. As Fig. 11 suggests, it is not possible to achieve a satisfactory data collapse if we choose the critical temperature to be 15.5 K. This implies a very powerful and perhaps surprising result about the 15.5 K metallization transition. Specifically, at temperatures greater than 15.5 K, carriers are scattered by magnetic fluctuations which are critical at 12.6 K, not 15.5 K. In essence, the incipient divergence in the resistance associated with the bulk ferromagnetic transition at 12.6 K is cut off by a sudden metallization transition at 15.5 K, whose onset temperature is itself extremely sensitive to magnetic fields. The picture which emerges from the resistivity and magnetization data is quite unique. EuB6 undergoes a bulk ferromagnetic transition at 12.6 K, which impacts the resistivity only modestly. In contrast, the higher temperature transition at 15.5 K is marked by the appearance of a weak spontaneous moment. Specific-heat measurements indicate that the great majority of the Eu moments order at 12.6 K, and that approximately 15 % of the moments are affected by the upper transition. The most dramatic signature of the higher temperature transition is in the electrical resistivity, which is exquisitely sensitive to variations in both temperature and
PRB 62
METALLIZATION AND MAGNETIC ORDER IN EuB6
field. In the most essential terms, EuB6 makes a transition at 15.5 K from a localized and poorly conducting paramagnetic state to a delocalized and metallic state with a small spontaneous moment. The primary effect of magnetic field is to suppress this higher temperature transition, approaching a bulk phase transition near 12.6 K in high fields. So far, we have not offered an explanation for the microscopic origin of this higher temperature transition. We argue here that this transition is from a high-temperature state of isolated and localized carriers, which we will suggest are magnetic polarons, to a low-temperature conducting state, resulting from the overlap of these polarons. We are not the first to suggest that magnetic polarons are present in EuB6 . Twenty years ago Kasuya proposed5 that magnetic polarons are a ubiquitous feature of low carrier density systems with localized magnetic moments. While the argument at that time for magnetic polarons in EuB6 was essentially an analogy to related systems such as EuO and Eu1⫺x Gdx Se, sufficient experimental and theoretical information has accrued in the ensuing years to make this argument explicit for EuB6 . Magnetic polarons are stabilized when it is energetically favorable for the carriers to spin polarize the local moments over a finite distance, with the increased energy of the spin system compensated by the reduced kinetic energy of the carrier, which is subsequently localized in the polaron. In contrast to the Jahn-Teller-assisted double-exchange process found in the manganites,24 a local lattice deformation is not required for this purely magnetic polaron. There are a number of observations in EuB6 which are consistent with the presence of magnetic polarons above T M . While the resistance near room temperature in EuB6 is metallic, and originates primarily from spin disorder scattering,15 there is a broad minimum near 100 K and the resistance begins to increase as the temperature is lowered towards T M . Except very near T M , where Fig. 11 shows that the resistance is primarily spin disorder scattering, we suggest that the increase in resistance with decreasing temperature is the result of charge localization by means of magnetic polaron formation. In agreement with this suggestion, Fig. 9 shows that magnetic fields suppress the resistance on this temperature interval, increase T M , and reduce the energy barrier evidenced in the temperature-dependent scattering, all as expected for magnetic polarons. More direct evidence for isolated polarons above T M comes from Raman scattering,25 which finds two field sensitive modes, whose symmetry properties are those expected for magnetic polarons. Since these new modes are observed below 30 K, we adopt this value as an estimate for the polaron formation temperature. We suggest that the narrowness of the semimetallic bands is the primary energetic factor which makes magnetic polarons possible in EuB6 . Figure 9共b兲 shows that both T C and T M , taken from the zero field d /dT for 153Eu11B6 and natural abundance EuB6 single crystals, are identical, confirming a minimal role for lattice strain. Instead, polaron stability is controlled by two energy scales:26 the local momentconduction electron exchange 共IS兲, and the conduction electron bandwidth E o . We estimate the former to be 0.24 eV by equating the measured 330 ⍀ -cm found above T M , less an estimated 165 ⍀-cm of field-independent lattice resistivity, to the spin disorder scattering.27 ARPES measurements10 and band-structure calculations7 give E o
11 631
⫽0.25 eV. These values yield an estimate of the polaron onset temperature of 230 K. It is only necessary to decrease IS by a factor of 2, consistent with experimental uncertainties, to obtain the 30 K onset temperature observed in the Raman measurement.25 The magnetic polarons have a calculated radius at formation of ⬃ two lattice constants, where they occupy ⬃10% of the sample volume. Enhancing the local moment magnetization by lowering the temperature or increasing the magnetic field increases the size of magnetic polarons, and, we suggest, can lead to their metallization via overlap. Polaron overlap is marked in EuB6 by the drop in resistivity at T M , and by the accompanying rapid increase in carrier number or decrease in carrier mass implied by zero-field optical reflectivity measurements.13 While a small spontaneous moment is found at T M , the bulk ferromagnetic transition occurs at 12.6 K. The separation of the charge delocalization and bulk magnetic ordering temperatures is a phenomenon unique to EuB6 , and is not observed in rare-earth manganites or the doped rare-earth chalcogenides.28 We propose that at 15.5 K the EuB6 phase separates into a conducting and ferromagnetically ordered phase coexisting with a paramagnetic and poorly conducting majority phase. Our proposal is that the conducting phase results from the overlap of magnetic polarons, and forms a percolating, low resistance path across the otherwise insulating sample at 15.5 K. The magnetic signature at T M is commensurate with the small number of moments involved in this conducting and ferromagnetic phase, estimated from the specific-heat anomaly as approximately 15% of all Eu moments. This is less than the cubic lattice percolation limit, and we speculate that the entropy gain associated with the delocalization of the carriers makes up the difference. As the temperature is lowered from 15.5 to 12.6 K, the volume fraction of the conducting, ferromagnetic phase increases at the expense of the paramagnetic phase, until the sample becomes homogeneous, conducting, and a bulk ferromagnet at 12.6 K. The gradual development of the homogeneous phase is mirrored in the unusually slow freezeout of entropy found between T M and T C . Finally, we hypothesize that the absence of a well-defined polaron metallization transition in highly disordered samples 共Figs. 1 and 2兲 may result from the inability of the sample to generate both a percolating conducting path and a substantial correlation length for ferromagnetic order at other than the bulk transition. Magnetic field is expected to increase polaron size, and the field dependence of T M suggests that the polaron dimensions are the same whether the overlap transition occurs in zero field at 15.5 or at 17.2 K in a field of 0.2 T. We estimate that T M (H) intersects the polaron stabilization temperature T pol (H) at ⬃31 K and 1.5 T. In zero field, polarons decompose into free carriers as the temperature is raised above T pol ⯝30 K,25 but in 0.5 T and for temperatures below 31 K the polarons are so large that metallization accompanies polaron formation. The quantum oscillation measurements9 support this view, finding an almost constant carrier concentration and effective mass at all temperatures. This is reasonable, as the high fields in which these measurements are performed far exceed the metallization field at any temperature below 31 K. We have presented here a detailed study of the relationship between transport and magnetization in EuB6 , which is
11 632
¨ LLOW et al. S. SU
PRB 62
consistent with the presence of magnetic polarons. We show that the zero-field ferromagnetic transition occurring at 12.6 K is preceded by charge delocalization at 15.5 K. EuB6 is unique among polaronic hosts because its intrinsic carriers themselves mediate the magnetic interactions among localized Eu moments. We propose that EuB6 finds a unique compromise between magnetic order and charge localization, not possible in higher carrier concentration magnets. Namely, the carrier and magnetic entropies can be reduced by ordering part of the sample, with the energy differential of the magnetic moments accommodated by the localization of carriers. The remainder of the sample orders at a lower, bulk
temperature. It appears that this sort of electronic phase separation is ultimately untenable if the overall carrier concentration is increased by pressure or doping, or if the polaron size is enhanced by field. The system then reverts to a homogeneous magnetic state, found in relatively high carrier concentration metallic magnets with polarons, such as rare-earth manganites.
*Present
16
address: Dept. of Physics, TU Braunschweig, Braunschweig, Germany. † Present address: Harvard Univ., Cambridge, MA 02138. ‡ Present address: NHMFL, Tallahassee, FL 32310. § Present address: Los Alamos National Laboratory, Los Alamos, NM 87545. 1 For reviews, see A. P. Ramirez, J. Phys.: Condens. Matter 9, 8171 共1997兲; M. A. Subramanian et al., Science 273, 81 共1996兲. 2 J. B. Torrance et al., Phys. Rev. Lett. 29, 1168 共1972兲; M. R. Oliver et al., Phys. Rev. B 5, 1078 共1972兲. 3 Z. Fisk et al., J. Appl. Phys. 50, 1911 共1979兲. 4 C. N. Guy et al., Solid State Commun. 33, 1055 共1980兲. 5 T. Kasuya et al., Solid State Commun. 8, 1543 共1970兲; T. Kasuya et al., J. Phys. 共Paris兲, Colloq. 41, C5-161 共1980兲. 6 S. von Molnar and S. Methfessel, J. Appl. Phys. 38, 959 共1967兲. 7 S. Massidda et al., Z. Phys. B: Condens. Matter 102, 83 共1997兲. 8 R. G. Goodrich et al., Phys. Rev. B 58, 14 896 共1998兲. 9 M. C. Aronson et al., Phys. Rev. B 59, 4720 共1999兲. 10 J. A. Clack et al. 共unpublished兲. 11 M. Abd-Elmeguid et al. 共unpublished兲. 12 W. Henggeler et al., Solid State Commun. 108, 929 共1998兲. 13 L. Degiorgi et al., Phys. Rev. Lett. 79, 5134 共1997兲. 14 S. Su¨llow et al., Phys. Rev. B 57, 5860 共1998兲. 15 J. C. Cooley et al., Phys. Rev. B 56, 14 541 共1997兲.
We thank P. Thalmeier, S. L. Cooper, P. Littlewood, A. J. Millis, and J. W. Allen for useful discussions. Work at the University of Michigan was supported by the U.S. Department of Energy, Office of Basic Energy Sciences, under Grants No. 94-ER-45526 and 97-ER-2753.
J. S. Kouvel and M. E. Fisher, Phys. Rev. 136, A1626 共1964兲. V. Privman et al., in Phase Transitions and Critical Phenomena, edited by C. Domb and J. L. Lebowitz 共Academic, New York, 1991兲, p. 1. 18 M. E. Fisher and J. S. Langer, Phys. Rev. Lett. 20, 665 共1968兲. 19 J. C. Cooley et al., Phys. Rev. B 52, 7322 共1995兲; 共unpublished兲. 20 A. J. Arko et al., Phys. Rev. B 13, 5240 共1976兲. 21 M. F. Hundley et al., Appl. Phys. Lett. 67, 860 共1995兲; J. Z. Sun et al., ibid. 67, 2726 共1995兲. 22 N. Furukawa, J. Phys. Soc. Jpn. 63, 3214 共1994兲. 23 P. Majumdar and P. Littlewood, Nature 共London兲 395, 479 共1998兲; Phys. Rev. Lett. 81, 1314 共1998兲. 24 A. J. Millis, Nature 共London兲 392, 147 共1998兲; A. J. Millis et al., Phys. Rev. Lett. 74, 5144 共1995兲; G. Zhao et al., Nature 共London兲 381, 676 共1996兲; N. A. Babushkina et al., ibid. 391, 159 共1998兲. 25 P. Nyhus et al., Phys. Rev. B 56, 2717 共1997兲. 26 A. Yanase, Int. J. Magn. 2, 99 共1972兲. 27 P. G. de Gennes, J. Phys. Radium 23, 510 共1962兲. 28 We note that metallization occurs in EuO below the ferromagnetic transition 共Ref. 2兲 and is thought to result from a small to large polaron crossover which is destabilized by spin waves 关D. Emin et al., Phys. Rev. B 35, 641 共1987兲兴. 17