PHYSICAL REVIEW B, VOLUME 63, 115411
He atom scattering and theoretical study of the surface phonons of a simple benchmark system: Xe„111… Antonio Sˇiber and Branko Gumhalter* Institute of Physics of the University, P.O. Box 304, 10001 Zagreb, Croatia
Andrew P. Graham† and J. Peter Toennies M. P. I. fu¨r Stro¨mungsforschung, Bunsenstraße 10, D-37073 Go¨ttingen, Germany 共Received 26 July 2000; revised manuscript received 9 October 2000; published 28 February 2001兲 Low-energy inelastic helium atom scattering measurements of the Xe共111兲 surface phonon dispersion curves are presented and compared with the results of extensive lattice dynamics analysis and complete one-phonon and multiphonon scattering calculations in the exponentiated distorted-wave Born approximation. The comparisons show that the Xe共111兲 surface phonon dispersion curves and the individual excitation time-of-flight peak intensities are well described using the gas-phase He-Xe and Xe-Xe pair potentials. DOI: 10.1103/PhysRevB.63.115411
PACS number共s兲: 68.35.Ja, 34.50.Dy, 63.22.⫹m
I. INTRODUCTION
The surfaces of the rare gas solids and their thin films are considered to be ideal model systems for the investigation of interlayer and intralayer interactions since the two body forces between the rare gas atoms are well known.1 Consequently, the structure and dynamics of the rare gas monolayer and bulk solid surfaces have been studied extensively using inelastic neutron scattering 共INS兲,2 helium atom scattering3–8 共HAS兲, low-energy electron diffraction9,10 共LEED兲, ultraviolet photoemission spectroscopy11–18 共UPS兲, angle resolved ultraviolet photoelectron emission 共ARUPS兲, inverse photoemission spectroscopy19–21 spectroscopy22,23 共IPES兲, thermal desorption spectroscopy24 共TDS兲, scanning tunneling microscopy25 共STM兲, and scanning force tunneling microscopy26 共SFM兲. The large body of information made available from these studies has also provided important information on the interactions among noble gas atoms in the condensed phase. Of particular interest in recent years has been the first observation of low-frequency dispersive modes in xenon monolayers on several different metal substrates using lowenergy HAS, in addition to the intense and nearly dispersionless, perpendicularly polarized S modes.27–33 These dispersive modes were initially interpreted as being due to the kinematically allowed excitation of the longitudinal acoustic 共L兲 phonon branch in the sagittal plane. However, in the case of Xe monolayers on Cu共001兲,30 Cu共111兲,31,32 and NaCl共001兲 共Ref. 33兲 substrates this interpretation required a decrease of the values of the intraplanar Xe-Xe force constants by a factor of 4 relative to those obtained from the gas phase potentials. The excitation of the shear horizontal 共SH兲 phonon modes was initially ruled out due to their nearly orthogonal polarization with respect to the sagittal plane in which the beam scattering experiments were carried out.32 At about the same time it was pointed out that the SH-mode dispersion curve calculated from the Xe-Xe gas phase potentials provided a good fit to the new dispersive mode in the system Xe/Cu共001兲.34 This controversy has recently been resolved by a detailed study of the phonons of argon, krypton, and 0163-1829/2001/63共11兲/115411共14兲/$15.00
xenon monolayers on Pt共111兲 where all three phonon branches were found for the first time, so that the assignment of the new mode as being SH is now assured for these three monolayer systems.35 This study showed, further, that the SH mode is only observable for low incident He atom energies of about 8–10 meV. This still leaves open the question as to the actual mechanism by which the SH mode is excited in the sagittal-plane scattering geometry. To shed more light on this problem, new HAS measurements of the phonon dynamics of the 共111兲 surface of a multilayer solid consisting of approximately 160 layers of Xe atoms on Pt共111兲 were undertaken for incident energies in the same low-energy range as for the monolayer solids. Since the Xe-Xe gas phase potential has been well characterized,36 and the Xe bulk phonons extensively studied,37 the Xe surface provides an important benchmark model system. Moreover, because the local environment of the uppermost xenon layer is quite different from that of the monolayer-metal substrate, the results should serve to reduce the number of possible explanations for the anomalous excitation of the SH mode in the monolayer films. Previously, the Xe共111兲 surface had been extensively studied by HAS 共Refs. 3–8兲 but only for higher incident energies, above 18 meV. Those studies provided detailed information on the surface Rayleigh phonon branches but, unfortunately, no signatures of either the shear horizontal or the longitudinal modes were found. The present HAS study presents evidence for both of these additional dispersive modes as well as of additional multiphonon effects which may show up already at low He atom incident energies. These results are interpreted with the aid of lattice dynamical analyses in combination with simulations of the HAS time-of-flight 共TOF兲 inelastic scattering intensities based on complete one-phonon and multiphonon calculations in the exponentiated distortedwave Born approximation, encompassing also the evaluation of the relevant phonon-induced Debye-Waller factors. The good agreement with the experimental results demonstrates that the dispersive phonon branches can be correctly modeled using unperturbed gas-phase potentials, as found previously for the Rayleigh mode.5 In addition, no anomalous intensity behavior is evident, indicating that the earlier ob-
63 115411-1
©2001 The American Physical Society
SˇIBER, GUMHALTER, GRAHAM, AND TOENNIES
PHYSICAL REVIEW B 63 115411
servation of the SH modes in the rare gas monolayers is probably related to the interaction with the metal substrate, possibly through the surface corrugation.35 This paper is organized as follows. In the next section the experimental details will be presented, followed by the HAS results in Sec. III. The Born–von Ka´rma´n analysis of Xe共111兲 phonons is presented in Sec. IV. The theoretical model of inelastic atom-surface scattering is presented in Sec. V and discussed in Sec. VI in comparison with the experimental results. The main conclusions are summarized in Sec. VII. II. EXPERIMENTAL
The high-resolution helium atom surface scattering apparatus38 共HUGO II兲 incorporates a variable temperature (T 0 ⫽20–400 K兲 supersonic helium atom beam source with a typical velocity full width at half maximum of ⌬ v / v ⯝1%. The scattered helium atoms are detected at a fixed total scattering angle of SD⫽95.8° with respect to the incoming beam by a homemade electron bombardment massspectrometer detector mounted 1.4 m from the target. A wide range of parallel momentum transfer is accessed according to ⌬K⫽k f sin共 SD⫺ i 兲 ⫺k i sin共 i 兲 ,
共1兲
where k i and k f are the incident and final momenta of the helium atoms in the sagittal plane, respectively. Time-offlight 共TOF兲 measurements, with an energy transfer resolution of typically ␦ (⌬E)⯝0.2 meV, were made by pulsing the helium beam using a mechanical chopper mounted before the sample, and measuring the flight times of helium atoms to the detector. The xenon crystal was grown in situ by exposing a Pt共111兲 surface to xenon gas from a 60 cm distant differentially pumped effusive source directed normal to the surface. The mechanically polished Pt共111兲 single crystal surface was first aligned to within 0.2° and mechanically polished before being inserted into the vacuum chamber where it was cleaned in situ in vacuum with repeated cycles of argon ion sputtering 共1 A cm⫺2 at 900 eV兲 and annealing at T s ⫽1200 K until no contamination could be detected with Auger spectroscopy and the helium scattering diffraction pattern showed a smooth surface with a low concentration of defects. The target chamber, in which the platinum sample was mounted, was kept at a base pressure of ⬍5⫻10⫺11 mbar to maintain sample cleanliness during the experiments. The surface temperature was controlled using a Ni-CrNi thermocouple clamped to the side of the sample with an absolute accuracy of ⌬T s ⬃⫾5 K. III. RESULTS
Figure 1 shows the variation of the surface reflectivity obtained by measuring the helium specular peak intensity as the Pt共111兲 surface is exposed to xenon at a constant rate. Since the surface temperature of T s ⫽50 K during growth is lower than the multilayer desorption temperature of T s ⬇55 K, a thick Xe layer is expected. The specular reflectivity decreases sharply to a minimum after 50 sec before rising to a small maximum at 60 sec, indicating the formation of an
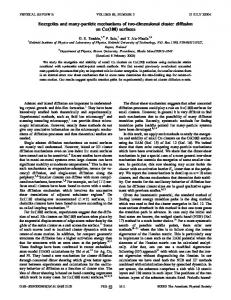
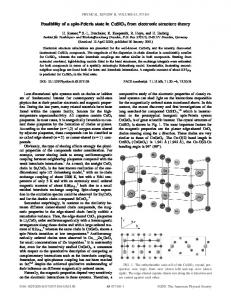
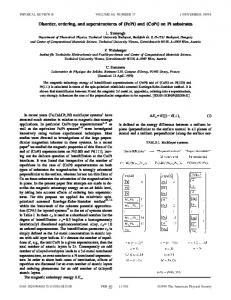
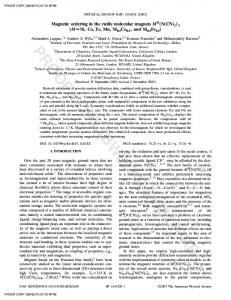
FIG. 1. Dependence of the helium specular signal measured ¯ 兴 azimuth, normalized to the Pt共111兲 clean along the Pt共111兲 关 112 surface, during xenon exposure at T s ⫽50 K and an incident helium atom beam energy E i ⫽5.3 meV. The maximum at 60 sec corresponds to completion of the first monolayer and exposure is continued to about 160 monolayers 共10 000 sec兲. The specular signal prior to exposure was about 1.5⫻108 counts/sec.
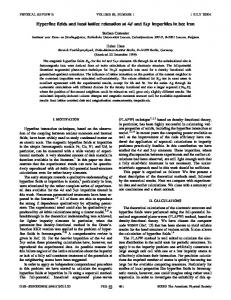
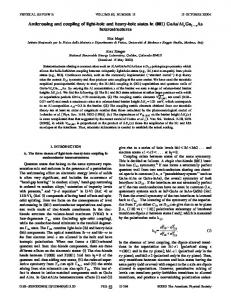
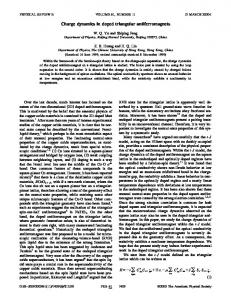
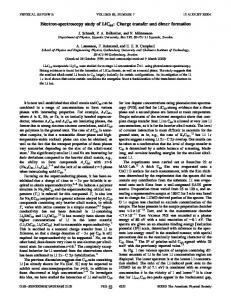
ordered monolayer. Exposure was continued until an estimated 160 monolayers had been adsorbed assuming layerby-layer growth with a constant sticking coefficient. The continuing downward intensity is attributed to the cumulative build up of defects in or on the xenon layers. Figure 2 shows two angular distributions for an incident energy of 10.4 meV and a surface temperature T s ⫽40 K obtained from the freshly grown Xe共111兲 surface along the ¯ 0 兴 and 关 112 ¯ 兴 . The difPt共111兲 high symmetry directions 关 11 fraction spots do not exhibit any splitting which would indicate the presence of domains in the Xe film that are rotated relative to each other and to the substrate high symmetry directions. The absence of the two Novaco-McTague rotated39 Xe adlayer domains observed earlier for monolayers6,35 and multilayers6 is presumably due to a somewhat higher step density on the present Pt共111兲 surface. ¯ 0 兴 and 关 112 ¯ 兴 corHence, the Pt共111兲 surface directions 关 11 ¯ ¯ ¯ ¯ respond to the Xe共111兲 ⌫ -M and ⌫ -K azimuths in the first surface Brillouin zone 共SBZ兲, respectively, indicating that the Xe共111兲 surface is rotated by 30° with respect to the Pt共111兲 surface. Further, the angular distributions show that the surface of 160 monolayers of xenon on Pt共111兲 at T s ⫽40 K is hexagonal with a unit cell size of a⫽4.37 Å . This corresponds to the 共111兲 face of fcc xenon, although the lattice constant is 0.04 Å larger than the value of a⫽4.33 Å previously reported for the surface at T s ⫽25 K.4,5 This difference arises from thermal expansion of the adlayer due to the higher temperature used in the present experiments. As shown in Fig. 2, the first order diffraction peak intensities are a factor of 4–10 smaller than the specular peak, indicating a moderately corrugated He-Xe共111兲 surface potential.40,41 Figure 3 shows a series of TOF measurements in which
115411-2
He ATOM SCATTERING AND THEORETICAL STUDY OF . . .
PHYSICAL REVIEW B 63 115411
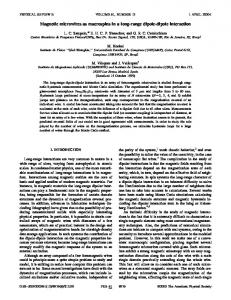
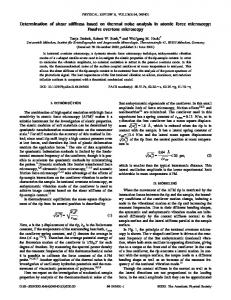
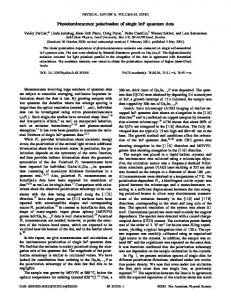
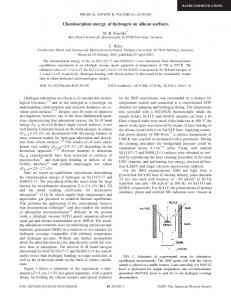
FIG. 3. Several time-of-flight spectra for incident angles greater than specular ( i ⫽47.9°) 共a兲 and less than specular 共b兲 for helium ¯ azimuth. The scattering from the Xe共111兲 surface along the ¯⌫ -M spectra are separated by an angle of 2° and have been converted from flight time to energy transfer scale. The incident energy was E i ⫽5.5 meV and the surface temperature was T s ⫽50 K. In addition to the diffuse elastic peak at ⌬E⫽0, the dispersive Xe共111兲 surface Rayleigh phonon 共RW兲 can be clearly seen for both energy loss and gain. The spectra are vertically offset from each other by 2000 counts/sec/meV for clarity.
¯ -M ¯ and FIG. 2. Helium scattering angular distributions for the ⌫ ¯⌫ -K ¯ azimuths of the Xe共111兲 surface at T s ⫽40 K and an incident ¯ -M ¯ ) has been energy of E i ⫽10.4 meV. The upper distribution (⌫ offset by a factor of 10 for clarity. The specular peak is located at i ⫽47.9°. The intense diffraction peaks at ⌬K⫽⫾1.66 Å⫺1 , ⌬K ¯ -M ¯ -K ¯ ), and ⌬K⫽⫾2.88 Å⫺1 (⌫ ¯ ) indicate a regu⫽⫾3.32 Å⫺1 (⌫ lar hexagonal unit cell with a surface lattice constant of a⫽4.37 Å. The uneven background under the diffraction peaks is attributed to variations in the inelastic intensity which is a significant contribution to the total signal.
the flight time has been converted to energy transfer ⌬E, ¯ azimuth for a low beam energy of along the Xe共111兲 ¯⌫ -M E i ⫽5.5 meV and a surface temperature of T s ⫽50 K. The most dominant peaks are the incoherent elastic peaks at zero energy transfer (⌬E⫽0) which correspond to scattering from defects in the Xe共111兲 surface, such as adatoms, vacancies, and steps. In addition to the incoherent elastic peak other dispersive peaks on both energy gain and loss sides are clearly visible. From a comparison with the results reported previously for 25 monolayers,3–8 the dispersive peaks can be assigned to the Xe共111兲 Rayleigh wave phonons 共RW兲. As can be seen from the TOF spectra in Fig. 3, the Rayleigh phonon intensity does not decrease monotonically with angle from the specular peak at i ⫽47.9°. This is most clearly seen for the energy loss peaks in Fig. 3共b兲 in which the Rayleigh wave and diffuse elastic peak intensities exhibit a different variation with the incident angle i . Previously for the Cu共111兲 共Refs. 42,43兲 and Rh共111兲 共Ref. 44兲 systems the RW inelastic peak intensities were observed to decrease
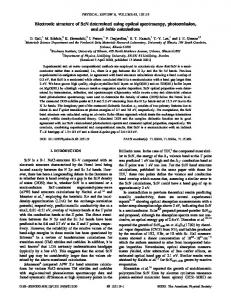
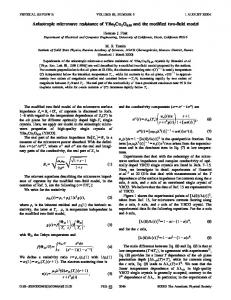
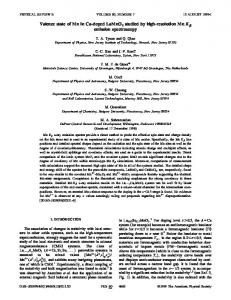
monotonically with increasing angles for incident energies E i ⲏ15 meV. Time-of-flight measurements were also made along the ¯ direction for an incident energy of E i ⫽5.7 Xe共111兲 ¯⌫ -K meV and a surface temperature T s ⫽40 K. Several spectra ¯ azimuth, the Rayleigh are shown in Fig. 4. As for the ¯⌫ -M
FIG. 4. Several time-of-flight spectra separated by ⌬ i ⫽1° for ¯ azimuth. helium scattering from the Xe共111兲 surface along the ¯⌫ -K The incident energy was E i ⫽5.7 meV and the surface temperature was T s ⫽40 K. In addition to the incoherent elastic peak at ⌬E ⫽0, the dispersive Xe共111兲 surface Rayleigh phonon 共RW兲 can be clearly seen for both energy loss and gain. The spectra are vertically offset from each other by 2000 counts/sec/meV for clarity.
115411-3
SˇIBER, GUMHALTER, GRAHAM, AND TOENNIES
PHYSICAL REVIEW B 63 115411
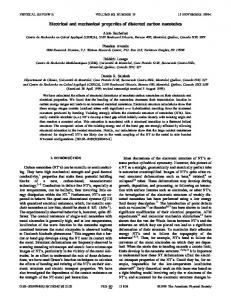
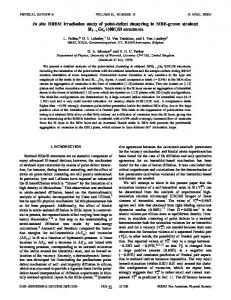
FIG. 5. Experimental Rayleigh phonon peak intensity 共peak area兲 for positive momentum transfer (⌬K⬎0) and energy loss ¯ 共circles兲 and ¯⌫ -K ¯ 共squares兲 azimuths. The (⌬E⬍0) for the ¯⌫ -M incident energy was E i ⫽5.5 meV and the surface temperature was T s ⫽40 K. Inset: theoretical Rayleigh peak excitation probabilities P kRW (⌬K) 共denoted by the same symbols for the same experimeni ,T s tal conditions兲 calculated in the flat surface approximation, as discussed in Sec. VI.
FIG. 6. Several time-of-flight spectra separated by ⌬ i ⫽1° for ¯ azimuth. helium scattering from the Xe共111兲 surface along the ¯⌫ -M The incident energy was E i ⫽10.5 meV and the surface temperature was T s ⫽40 K. In addition to the diffuse elastic peak at ⌬E⫽0, the dispersive Xe共111兲 surface Rayleigh phonon 共RW兲 can be clearly seen for both energy loss and gain, as well as several less intense peaks up to ⌬E⫽⫺4.3 meV 共indicated by an upward directed arrow兲 in some of the spectra. The spectra are vertically offset from each other for clarity.
FIG. 7. Several time-of-flight spectra separated by ⌬ i ⫽1° for ¯ azimuth. helium scattering from the Xe共111兲 surface along the ¯⌫ -K The incident energy was E i ⫽10.2 meV and the surface temperature was T s ⫽40 K. In addition to the diffuse elastic peak at ⌬E⫽0, the dispersive Xe共111兲 surface Rayleigh phonon 共RW兲 peaks at both the energy loss and gain sides, a nondispersive mode at about ⫺4.3 meV 共indicated by an upward directed arrow兲 is clearly discernible. The spectra are vertically offset from each other for clarity.
phonon peaks can be seen for both energy loss and gain. In addition, the Rayleigh phonon peak intensity was observed to increase for angles of incidence close to the specular peak and decrease for larger angles. The Rayleigh phonon intensities 共peak areas兲 for the ¯⌫ -M ¯ and ¯⌫ -K ¯ azimuths for positive momentum and negative energy transfers with an incident energy of E i ⫽5.5 meV are ¯ direction the Rayleigh mode shown in Fig. 5. Along the ¯⌫ -M has a maximum at ⌬K⯝0.2 Å⫺1 whereas the maximum ¯ is somewhat broader and occurs at ⌬K⯝0.4 along the ¯⌫ -K ⫺1 Å . As can be seen from the spectra in Figs. 3 and 4, only the low-frequency Rayleigh phonon modes are excited at the low incident energy of 5.5 meV. In order to excite the SH and L surface phonons which lie at higher frequencies, the incident beam energy was increased to E i ⫽10.5 meV similar to the energies used in the earlier monolayer experiments.35 Figure 6 shows several TOF spectra at a surface temperature ¯ azimuth for incident angles beof T s ⫽40 K along the ¯⌫ -M tween i ⫽33.9° and i ⫽45.9°. As for the measurements at E i ⫽5.5 meV, the relative intensity of the Rayleigh mode 共RW兲 peaks varies significantly with incident angle, particularly on the energy gain side. However, in addition to the Rayleigh mode, additional inelastic peaks can be observed in several of the spectra. In particular for i ⫽39.9°, additional peaks are seen at ⌬E⫽⫺2.7 meV and ⌬E⫽⫺4.3 meV. ¯ Figure 7 shows a similar set of TOF spectra for the ¯⌫ -K
115411-4
He ATOM SCATTERING AND THEORETICAL STUDY OF . . .
PHYSICAL REVIEW B 63 115411
FIG. 8. Experimental Rayleigh phonon peak intensity 共peak area兲 for positive momentum transfer (⌬K⬎0) and energy loss ¯ 共circles兲 and ¯⌫ -K ¯ 共squares兲 azimuths. The (⌬E⬍0) for the ¯⌫ -M incident energy was E i ⫽10.5 meV and the surface temperature was T s ⫽40 K. Inset: theoretical Rayleigh peak excitation probabilities P kRW (⌬K) 共denoted by the same symbols for the same experimeni ,T s tal conditions兲 calculated in the flat surface approximation, as discussed in Sec. VI.
FIG. 9. The Xe共111兲 surface phonon dispersion curves determined from HAS time-of-flight measurements for incident energies of E i ⫽5.5 meV and 10.5 meV 共open circles兲 shown on a reduced zone scheme. The solid curves show the results of calculations for the Rayleigh phonon (R), Longitudinal acoustic (L), and shear horizontal 共SH兲 modes. A further dispersionless mode 共X兲 at ប ⫽4.3 meV is also observed.
azimuth and an incident energy of 10.2 meV. An interesting feature of the displayed TOF spectra is the peak at about ⌬E⫽⫺4.3 meV which is particularly visible at smaller incident angles. At intermediate angles the intensity of the Rayleigh wave exceeds the intensity of the incoherent elastic peak, whereas all the other inelastic features are significantly less intense. ¯ and ¯⌫ -K ¯ The Rayleigh phonon peak areas for the ¯⌫ -M azimuths for a higher incident energy of E i ⫽10.5 meV are ¯ azimuth shown in Fig. 8. At the higher energy the ¯⌫ -K ¯ direction and the shows a greater intensity than the ¯⌫ -M intensity maxima are at about the same momentum transfers ¯ as at the lower energy. The Rayleigh mode along the ¯⌫ -M direction has its maximum at about the same value of ⌬K ¯ direction is ⯝0.2 Å⫺1 whereas the maximum along the ¯⌫ -K shifted slightly to a smaller value of ⌬K⯝0.3 Å⫺1 . The energy losses and gains from the TOF spectra along ¯ and ¯⌫ -K ¯ azimuths for the incident energies E i the ¯⌫ -M ⫽5.5 and 10.5 meV fall together on the same curves as shown in Fig. 9 on a reduced zone scheme. The majority of the inelastic peaks are from the intense Rayleigh wave while the less intense dispersive modes, which are observed along both directions, lie at higher frequencies. In addition, a broad dispersionless feature at about ប ⫽4.3 meV 共denoted by X) is also evident along both azimuths, particularly close to the ¯⌫ points.
Ka´rma´n force constant scheme in which the Xe crystal is modeled by a 80 atom thick fcc slab bounded by 共111兲 surfaces on each side.45 Three-body Xe interactions were neglected and the HFD-B2 pair potential of Aziz et al.36 was used, since this potential provided a good description of the phonons in Xe monolayers on a Pt共111兲 surface.35,46 In the present calculations the nearest neighbor Xe-Xe equilibrium distance is fixed at a⫽4.37 Å, the value determined from He atom diffraction measurements 共see Fig. 2兲 at the same substrate temperature as for the inelastic scattering experiments. Further, in the present dynamical matrix model all the effects due to perpendicular relaxation of the Xe共111兲 surface are neglected because relaxation of the rare gas fcc共111兲 surfaces has been found to be small in this model.45 The radial  and tangential ␣ force constants corresponding to the first and second nearest neighbor atoms are listed in Table I. To introduce the normal modes of the system into the model we define a three-dimensional 共3D兲 unit cell which extends from one surface of the slab to the other.45 The complete slab is generated by applying the two-dimensional 共2D兲 TABLE I. The values of the radial,  , and tangential, ␣ , force constants for the first 共1兲 and second 共2兲 nearest neighbors in the fcc xenon crystal used in the present analysis. The values were obtained from the HFD-B2 potential 共Ref. 36兲 using the experimental interatomic distance of a⫽4.37 Å obtained for substrate temperature T s ⫽40 K.
´ RMA ´ N CALCULATION OF THE IV. THE BORN–VON KA SURFACE PHONON DISPERSION CURVES
The phonon dispersion curves and polarization vectors for the present system were calculated using the Born–von 115411-5
Force constant
Value 共N/m兲
 Xe⫺Xe 1  Xe⫺Xe 2 ␣ Xe⫺Xe 1 ␣ Xe⫺Xe 2
1.636 ⫺0.088 0.002 0.012
SˇIBER, GUMHALTER, GRAHAM, AND TOENNIES
PHYSICAL REVIEW B 63 115411
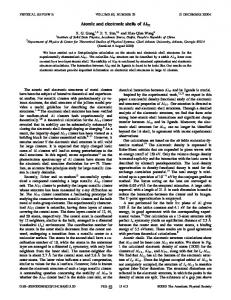
FIG. 10. Calculated phonon dispersion curves as a function of ¯ →K ¯ the two-dimensional wave vector Q along the boundary ⌫ ¯ ¯ →⌫ of the irreducible part of the first surface Brillouin zone →M 共SBZ兲 of an 80 layer fcc Xe slab with 共111兲 surfaces. The zone ¯ ⫽0.958 Å⫺1 , K ¯ -M ¯ ⫽0.83 Å⫺1 , and ¯⌫ boundary vectors are ¯⌫ -K ⫺1 ¯ ⫽0.479 Å . Three surface localized modes detached from the M bulk continuum are clearly discernible; the dominantly perpendicularly or Z-polarized Rayleigh wave below the bulk continuum, the dominantly shear-horizontally polarized or SH mode in the gap ¯ point 共this mode becomes degenerate with the bulk around the K continuum in the remainder of the SBZ兲, and the dominantly lon¯ to M ¯ gitudinally polarized or L mode in the gap extending from K points of the SBZ, and turning into a longitudinal resonance in the remainder of the SBZ.
translation group and the entire slab has a periodic 2D structure in the directions parallel to the surface. The equilibrium position of an atom in the slab is described by rl, ⫽(Rl ⫹R ,z ), where the 2D vector Rl , which is parallel to the (x,y) plane of the surface, is associated with the lth unit cell. (R ,z ) is the basis vector in the unit cell which gives the position of the th atom in the layer fixed by the perpendicular coordinate z , where ⫽1 denotes the topmost layer. ul, ⫽(ul, 储 ,ul, ⬜ ) denotes the displacement of the (l, )th Xe atom from equilibrium position at rl, and the periodicity of the slab in the directions parallel to the surface is exploited in order to represent ul, as a Fourier series in terms of normal modes in the slab. The normal mode vibrational frequencies Q, j and orthonormalized polarization vectors e (Q, j) associated with a th layer, which are functions of 2D phonon wave vector Q and a branch index j, are obtained as solutions of the standard dynamical matrix.45 The phonon dispersion curves calculated for a slab consisting of 80 Xe layers using the force constants listed in Table I are presented in Fig. 10. The dispersion curve of the surface localized phonon which develops from the S mode in monolayer solids45 is detached from the lower edge of the bulk continuum over the entire irreducible part of the hexagonal first surface Brillouin zone 共SBZ兲. This phonon is dominantly vertically or Z polarized and therefore can be identified with the Rayleigh wave. In addition, some surface projected modes are also discernible in the gaps of the bulk continuum whereas others appear as resonances in the continuum. These in-plane surface modes can be assigned either the longitudinal 共L兲 or the shear horizontal 共SH兲 character according to the relative directions of their polarization and
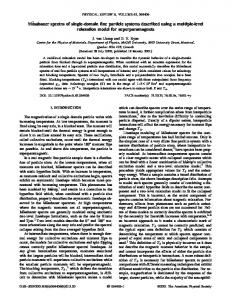
FIG. 11. Top panel: The experimental Xe共111兲 surface dispersion curves 共open circles兲 from Fig. 9 shown on a reduced zone scheme are compared with the maxima of the surface projected phonon densities of states calculated from Eq. 共2兲 for vertical 共Z兲, in-plane longitudinal 共L兲, and in-plane shear horizontal 共SH兲 polarization which are denoted by the solid, long dashed, and short dashed lines, respectively. The lower panels display separately the Z-, L-, and or SH-polarized density of phonon states projected onto the topmost layer of Xe atoms in the slab, as calculated by the dynamical matrix method described in Sec. IV. Comparison with the upper panel reveals the polarization properties of the three experimentally detected surface projected modes in the first SBZ and enables their identification with the Rayleigh wave 共RW兲, longitudinal 共L兲, and shear horizontal 共SH兲 modes. The scale of the DOS maxima 关 ⭐1, see Eq. 共2兲 and thereafter兴 is given on the left ordinate.
wave vectors. This is illustrated by calculating and plotting the Z-, L-, and SH-projected phonon densities of states 共DOS兲 defined by Di 共 ,Q兲 ⫽
兺j 兩 „e ⫽1共 Q, j 兲 …i兩 2 ␦ 共 ⫺ Q, j 兲 ,
共2兲
where i denotes the Z, L, or SH polarization and j ranges over all mode branches in the slab. Figure 11 compares the measured dispersion points with the calculated surface-projected phonon DOS defined in Eq. 共2兲 for the three surface modes. In plotting the calculated results each ␦ function on the RHS of Eq. 共2兲 was replaced
115411-6
He ATOM SCATTERING AND THEORETICAL STUDY OF . . .
PHYSICAL REVIEW B 63 115411
by a Gaussian of width 0.19 meV to consistently model the experimental resolution. In this case the maxima of the thus integrated phonon DOS cannot exceed unity because of the orthonormality of the mode polarization vectors. These DOS plots clearly demonstrate that the most intense phonon branch is the dominantly Z-polarized Rayleigh mode. How¯ direction ever, it should also be observed that along the ¯⌫ -K the surface modes with SH polarization also exhibit a weak Z-polarization component which may make their detection possible for this scattering direction. The comparison also indicates that the mode, which is observed in the bulk con¯ and M ¯ points 共see Fig. 10兲, is tinuum gap between the K dominantly L polarized.
TABLE II. Parameters for the potential U stat(z) in Eqs. 共7兲 and 共8兲.
V. CALCULATION OF THE INELASTIC INTENSITIES
The calculation of the intensities for scattering of He atoms from phonons of the Xe共111兲 surface will be carried out within the appropriately modified theoretical formalism developed in Refs. 32 and 47. The application of this formalism to the present problem requires a careful examination and modeling of the He-surface interaction potential U(r, 兵 ul, 其 ) which depends on the position vector r of the He atom, and on the equilibrium positions rl, and displacements ul, of the atoms in the crystal. In this section we present a generalization of the model outlined in Ref. 32 so as to account for projectile interactions with all the atoms of the Xe van der Waals crystal. Thus, the total He-Xe crystal potential is assumed to be a pairwise addition of two-body gas phase He-Xe potentials v (r⫺rl, ⫺ul, ), whose dependence on the spatial coordinates can be modeled by using expressions from either Ref. 48 or Ref. 49. For the present purposes both potentials yield practically indistinguishable results. The resulting total He-Xe共111兲 potential can be written as U 共 r, 兵 ul, 其 兲 ⫽U stat共 r兲 ⫹V 共 r, 兵 ul, 其 兲 ,
共3兲
where U stat(r) is the static He atom-Xe crystal interaction obtained by setting all displacements ul, equal to zero, viz. U stat共 r兲 ⫽
v共 r⫺rl, 兲 . 兺 l,
共4兲
The dynamic interaction contained in the term V(r, 兵 ul, 其 ) is obtained from the expansion of the total potential in a Taylor series of which only the terms linear in the displacements are retained: V 共 r, 兵 ul, 其 兲 ⫽
关 ⫺“ rv共 r⫺rl, 兲兴 •ul, ⫽ 兺 Fl, 共 r 兲 •ul, . 兺 l, l,
共5兲
The Fl, (r) are the forces exerted by the crystal atom at rl, on the projectile atom at r. As in our earlier studies of inelastic scattering from monolayer Xe surfaces,32 the effect of the corrugation of the static potential, Eq. 共4兲, on inelastic He atom transitions is neglected and only the surface average of the potential of Eq. 共4兲 is accounted for. To obtain the surface averaged static
D 共meV兲
d 共Å兲
z 0 共Å兲
b 共Å兲
5.625
0.641
3.514
3.572
potential for the present system, the He atom interaction with the topmost layer ⫽1 of Xe atoms was first calculated using the potentials from Refs. 48 and 49 to yield U ⫽1 共 z 兲 ⫽
1 Ac
冕
sur
v共 r兲 d 2 R,
共6兲
where A c is the area of the 2D surface unit cell. The contributions from the th layers in the crystal are approximated by assuming the following generalized Morse potential: U fit共 z 兲 ⫽D 关共 1⫺e ⫺2b/d 兲 e ⫺2[z⫹( ⫺1)b⫺z 0 ]/d ⫺2 共 1⫺e ⫺b/d 兲 e ⫺[z⫹( ⫺1)b⫺z 0 ]/d 兴 ,
共7兲
where b is the normal distance between two adjacent equivalent Xe共111兲 planes (b⫽ 冑2/3a⫽3.568 Å兲. The parameters D and d were determined by a best fit to the values of the topmost layer potential U 1 (z) in the interval around the turning point, with the requirement that the fitted potential correctly reproduces the value at the potential minimum obtained from the numerical integration of Eq. 共6兲. The potential in Eq. 共7兲 is then summed over all subsequent underlying layers to finally yield the laterally averaged static He-Xe共111兲 potential in the Morse form ⬁
U stat共 z 兲 ⫽
兺
⫽1
U fit共 z 兲 ⫽D 关 e ⫺2(z⫺z 0 )/d ⫺2e ⫺(z⫺z 0 )/d 兴 . 共8兲
The parameters of the potential U stat(z) obtained using this procedure are listed in Table II. The computation of the matrix elements needed in the calculation of inelastic scattering intensities is now greatly simplified since the Schro¨dinger equation with the potential of Eq. 共8兲 can be solved analytically to yield the distorted waves
具 r兩 k典 ⫽ 具 R,z 兩 K,k z 典 ⫽
1
冑L z L s2
exp共 iKR兲 k z 共 z 兲 ,
共9兲
which describe the elastic projectile motion in the static surface potential U stat(z) 共Refs. 50–54兲 and satisfy the normalization 具 k兩 k⬘典 ⫽ ␦ k,k⬘ . Here L s and L z are the quantization lengths in the directions parallel and perpendicular to the surface, respectively, K is the wave vector describing unperturbed projectile motion parallel to the surface, and k z plays the role of the quantum number describing the motion in the direction perpendicular to the surface so that the perpendicular energy E z →ប 2 k z2 /2M for z→⬁. Equations 共3兲–共9兲 provide the necessary ingredients for defining the inelastic scattering spectrum N(⌬E,⌬K) which gives the probability density that amounts of energy ⌬E
115411-7
SˇIBER, GUMHALTER, GRAHAM, AND TOENNIES
PHYSICAL REVIEW B 63 115411
⫽E f ⫺Ei and parallel momenta ⌬K⫽K f ⫺K i are transferred from the He atom to the substrate phonons.32,47,55 For the current experimental conditions the uncorrelated phonon exchange processes dominate over the correlated ones47 and the latter are neglected altogether. In this regime the angular resolved scattering spectrum, which depends parametrically on the surface temperature T s and initial projectile momentum បki , can then be accurately calculated using the exponentiated Born approximation 共EBA兲 scattering formalism.56–58 This yields the EBA scattering spectrum47 N kEBA ,T 共 ⌬E,⌬K 兲 ⫽ i
s
冕
⬁
d d 2R
⫺⬁ 共 2 ប 兲 3
Here ¯n ( Q, j ) is the Bose-Einstein distribution of phonons of energy ប Q, j at the substrate temperature T s , and the onephonon emission 共⫹兲 and absorption (⫺) scattering ampliK ,Q⫹G, j (⫾) are calculated from the projectiletudes V k i ,k z⬘
z⬘
2
K ,Q⫹G, j
where and R⫽(X,Y ) are the variables of the so-called (R, ), explicitly EBA scattering or driving function 2W kEBA i ,T s given below 关see Eq. 共12兲兴, which contains all the information on uncorrelated phonon exchange processes in the atomsurface scattering event. After carrying out the ( ,R)-Fourier transform on the right-hand side 共RHS兲 of Eq. 共10兲 the values of ⌬K and ⌬E are confined to the scan curve. This yields the theoretical intensities as the function of ⌬E which can be compared with the experimental HAS TOF intensities.59 The value 2W kEBA (R⫽0, ⫽0)⫽2W kEBA gives the EBA i ,T s i ,T s expression for the Debye-Waller exponent 共DWE兲 pertaining to the present inelastic scattering model. It has also been shown57 that this DWE represents the mean number of phonons excited in all inelastic scattering events with projectile initial momentum បki and substrate temperature T s . The corresponding Debye-Waller factor 共DWF兲 given by exp关⫺2WkEBA 兴 represents, according to Eq. 共10兲, a common i ,T s attenuating factor for all the spectral features in (⌬E,⌬K) for particular initial conditions ki and T s . N kEBA i ,T s The spectrum 共10兲 also includes the elastically scattered specular beam intensity which is given by60,61
V k i ,k z⬘
兺
Ki ,Q¿G,j
Q,G, j,k z⬘
关兩V k
z⬘ ,k zi
共 ⫹ 兲兩 2
⫻ 关 ¯n 共 ប Q, j 兲 ⫹1 兴 e ⫺i[ Q, j ⫺„Q⫹G…R] K ,Q⫹G, j
⫹ 兩 V k i ,k z⬘
zi
共 ⫺ 兲 兩 2¯n 共 ប Q, j 兲
⫻e i[ Q, j ⫺„Q⫹G…R] 兴 .
共12兲
兺
⫽1
冋
冉
ប 2NM Xe Q, j
冊冕 册 1/2
dz *f 共 z 兲 e 共 Q, j 兲
where M Xe is the mass of a Xe atom and only the first and second layer corresponding to ⫽1,2 were included in Eq. 共13兲 since they give the dominant contribution. The expression in the square brackets in the integrand on the RHS of Eq. 共13兲 derives from the gradient operator in Eq. 共5兲 and zˆ denotes the unit vector perpendicular to the surface. Here, following the procedure of Bortolani and co-workers62,63 and consistent with expression 共7兲, the Q dependence of v Q(z) leading to expression 共8兲 is, to a good approximation, represented by a Gaussian cutoff arising from the simultaneous interaction of the projectile with several substrate atoms. This yields v Q共 z⫺z 兲 ⫽A c D 关共 1⫺e ⫺2b/d 兲 e ⫺2[z⫹( ⫺1)b⫺z 0 ]/d e ⫺Q
⫺2 共 1⫺e ⫺b/d 兲 e ⫺[z⫹( ⫺1)b⫺z 0 ]/d e ⫺Q
2 /Q 2 c
2/2Q2 c
兴,
共14兲 with Q c ⫽ 冑2/z t d and where z t is the energy dependent classical turning point for the projectile motion in front of the surface. The scalar product on the RHS of Eq. 共13兲, viz.
冋
e 共 Q, j 兲 ⫺i 共 Q⫹G兲 ,z0
共11兲
In the present approach, in which only the linear projectile-phonon coupling, Eq. 共5兲, is retained in Eq. 共3兲, the EBA scattering function in Eq. 共10兲 takes the form47
zi
⫽
⫻ ⫺i 共 Q⫹G兲 ,zˆ v Q⫹G共 z⫺z 兲 i 共 z 兲 , 共13兲 z
EBA
s
zi
are expressed in terms of the two-dimensional Fourier transform v Q¿G(z⫺z ) of the atomic pair potentials
e 共 i/ប 兲 [(⌬E) ⫺ប(⌬K)R]
关 N kEBA 共 ⌬E,⌬K兲兴 specular⫽e ⫺2W ki ,T s ␦ 共 ⌬E 兲 ␦ 共 ⌬K兲 . i ,T s
by confining
zi
them to the energy shell and normalizing the resulting values to the projectile current normal to the surface.32,47 The matrix K ,Q⫹G, j of the inelastic interaction potential 共5兲 elements V k i ,k
共10兲
i
K ,Q⫹G, j z⬘
⫻exp关 2W kEBA 共 R, 兲 ⫺2W kEBA 共 0,0兲兴 , i ,T s i ,T s
2W kEBA ,T 共 R, 兲 ⫽
zi
phonon interaction matrix elements V k i ,k
z
册
共15兲
indicates that the strongest dynamical coupling near the ¯⌫ point will occur with the vertical or the Z component of the polarization vectors of the three surface modes, and that the coupling to the longitudinally polarized modes will be greatest away from the ¯⌫ point 共i.e., for larger Q⫹G). The coupling of He atoms to SH modes for the case of in-sagittal¯ in plane scattering along the high symmetry direction ¯⌫ -M the first SBZ is identically equal to zero because in that scattering geometry the scalar product Eq. 共15兲 vanishes. This selection rule is independent of the surface temperature and hence applies equally well to one-phonon emission and absorption in HAS from defect-free planar surfaces. However,
115411-8
He ATOM SCATTERING AND THEORETICAL STUDY OF . . .
PHYSICAL REVIEW B 63 115411
FIG. 12. The magnitude of the total phonon-induced Debye, as a function of He atom inciWaller exponent 共DWE兲, 2W kEBA i ,T s dent angle calculated for two experimental incident energies E i ⫽10.2 meV 共solid line兲 and E i ⫽5.7 meV 共dashed line兲, for fixed substrate temperature T s ⫽40 K. The magnitudes of the contributions to the Debye-Waller exponents from He atom transitions into the bound states of the atom-surface potential U stat(z) are denoted by filled and empty squares for the quoted two incident energies, respectively.
FIG. 13. The experimental diffuse elastic peak intensities 0 ( i ), obtained by numerical integration of the elastic peak areas I diff ¯ in the experimental TOF spectra for E i ⫽10.5 meV in the ¯⌫ -K direction are plotted as a function of the incident scattering angle. The full, dot-dashed, long dashed, and short dashed curves denote the fits through these points using Eq. 共16兲 with R 0 ⫽1, 3, 4, and 5 R Xe , respectively, where 2R Xe is the distance of the Xe-Xe pair potential well minimum.
the presence of surface defects relaxes the phonon momentum selection rule64 and defect concentration may be temperature dependent. Quite generally, the scattering spectrum calculated from Eq. 共10兲 encompasses three distinct features arising from the ( ,R)-Fourier transform of the various terms in the power (R, ) 兴 . The zeroth order series expansion of exp关2W kEBA i ,T s term 共i.e., unity兲 gives rise to the elastic peak described by Eq. 共11兲, the first order or the distorted-wave Born approximation 共DWBA兲 term gives rise to the single phonon features in the spectrum, and the remaining terms all contribute to the multiphonon background. It should also be noted that all three types of spectral features are multiplied by one and the same phonon-induced Debye-Waller factor exp关⫺2W kEBA 兴 that depends on the incident projectile eni ,T s ergy E i , angle i , and the substrate temperature T s , but not on ⌬E or ⌬K. As the true multiphonon regime in which Ⰷ1 is reached, the weight of the no-loss line and 2W kEBA i ,T s one-phonon features is strongly suppressed by the DebyeWaller factor, while the multiphonon background, which tends to a Gaussian limit,59 takes over the spectral weight. VI. THEORETICAL INTERPRETATION AND DISCUSSION OF EXPERIMENTAL RESULTS
exponent 2W kEBA appearing in Eq. 共10兲 and measuring the i ,T s mean number of phonons exchanged with the heat bath in the course of the collision.57 The Debye-Waller exponents calculated for the present scattering conditions are shown in Fig. 12 关compare with Fig. 12 in Ref. 32 for Xe monolayer on Cu共001兲兴. The points denoted by full and open squares indicate the contributions from inelastic, i.e., phonon assisted He atom transitions into the bound states of the projectilesurface potential. The calculated Debye-Waller exponents are greater than two in the whole range of the experimental incident angles, which means that even the measurements at E i ⫽5.5 meV were carried out in the regime between single and multiphonon scattering. This explains the presence of the relatively large background intensities in the TOF spectra reported in Sec. III. To establish the presence of defects such as adatoms, vacancies, small islands, or clusters on the surface, whose build up would be also consistent with reduction of the He specular signal for higher exposure times in Fig. 1, the diffuse elastic peak areas in the experimental TOF spectra were integrated numerically and plotted as a function of the incident angles i between the zeroth and first order diffraction peaks. 0 ( i ) and shown as full squares These values, denoted as I diff in Fig. 13, were fitted to the following expression: fit I diff 共 i 兲 ⫽AF 共 k i ,R 0 , i , f 兲 ⫹B.
Before discussing the inelastic TOF spectra it is useful to first delineate the scattering regime in which the measurements were carried out and the effect of surface defects on the discussed inelastic scattering data. Since the phonon excitation energies in the heavy Xe system are relatively small, multiphonon excitations can take place even at low He beam incident energies. The scattering regime depends on the magnitude of the exponent of the phonon-induced Debye-Waller
共16兲
Here F(k i ,R 0 , i , f ) is the Fraunhofer intensity for diffuse elastic scattering from a hemispherical defect with an effective radius R 0 on a planar surface as discussed in detail in Sec. IV of Ref. 65. The constants A and B, which depend on the effective defect density, were varied to obtain the fits of the ‘‘experimental’’ diffuse elastic scattering intensities with ¯ direction with E i ⫽10.5 meV and i Eq. 共16兲 for the ¯⌫ -K
115411-9
SˇIBER, GUMHALTER, GRAHAM, AND TOENNIES
PHYSICAL REVIEW B 63 115411
⫹ f ⫽SD . The fits of the ‘‘experimental’’ intensity points in Fig. 13 indicate that the diffuse elastic intensities are consistent with the presence of defects with an effective radius in the range 3R Xe⭐R 0 ⭐5R Xe where 2R Xe⫽4.36 Å is the distance of the minimum of the Xe-Xe pair potential.36 A relevant issue arising in connection with the presence of clusters on the surface is the existence of vibrations localized at such defects. Although it is not possible to carry out a dynamical matrix analysis of the modes associated with the randomly distributed clusters, our additional dynamical matrix analyses have shown that the Xe atoms underneath single adatoms forming a (3⫻3) superstructure exhibit dominantly L-polarized quasilocalized modes whose frequencies in a back-folded first SBZ 共or equivalently the first SBZ of the 3⫻3 superstructure兲 are nearly dispersionless at around 4 meV. Thus, it may be envisaged that modes of similar character may also exist along the circumference of adsorbed Xe islands or clusters and thus be observable in HAS. In turning to the theoretical analyses of the TOF spectra we note that since only the spectra at E i ⫽10.5 meV exhibit, besides the Rayleigh waves, additional inelastic features their interpretation is of special interest. To this end we have first carried out the DWBA calculations of the one-phonon scattering intensities based on the model outlined in Sec. V in order to be able to make assignments for all well resolved peaks in the measured spectra, excluding only the peaks at ⌬E⫽0 which are due to incoherent scattering from surface defects not accounted for by the present EBA formalism. These DWBA calculations enable clear assignments of the RW, L, and SH modes in the measured spectra but are unable to explain the intensity of the dispersionless peak X clearly discernible at ⬃⫺4.3 meV in some of the spectra for ⌬K values close to the center of the first SBZ. Several complementary explanations of such incomplete description in the present DWBA calculations are possible. Thus, the appearance of the peak X can be associated with 共i兲 spurions which have already been detected in the various earlier analyses of the HAS TOF spectra,66–69 共ii兲 excitation of defect modes 共localized phonons兲 since the presence of defects on the surface has been confirmed by the above analyses of the diffuse elastic peak intensities from the TOF spectra, 共iii兲 multiphonon scattering processes whose intensities can be calculated only by going beyond the first order DWBA treatment of the scattering spectrum. Each of these explanations is plausible and we shall discuss them in order. First, careful examinations of the scattering conditions and the scan curves corresponding to the TOF spectra shown in Figs. 6 and 7 enables to rule out spurions connected with the one-phonon processes66–69 as a possible origin of the X peak. Second, single adatom defect modes, which are expected to have vibrational frequencies of less than 3 meV for the most favorable threefold hollow sites, can be also ruled out.70 Hence, only the modes associated with clusters or islands, as was discussed at the beginning of this section, are possible candidates for the explanation of the origin of the X peak in some of the spectra. The examination of the third possibility, i.e., the multiphonon origin of the X peak, can be
FIG. 14. Comparison of experimental 共thin noisy line兲 and calculated EBA 共thick full line兲 phonon excitation intensities as functions of energy transfer for in-sagittal-plane He atom scattering ¯ direction. The four panels from Xe共111兲 surface along the ¯⌫ -M show spectra for the same incident energy E i ⫽10.5 meV and substrate temperature T s ⫽40K and for four different incident angles i . The incoherent elastic peak arising from imperfections in the Xe共111兲 surface, which does not derive from the EBA formalism outlined in Sec. V, is denoted by the shaded peak. The dashed curve denotes the calculated multiphonon background which exhibits maxima at about twice the RW frequency at the zone edge. Note that the experimental peaks denoted by X are not reproduced in the one-phonon calculations utilizing the dynamical matrix of a perfect Xe共111兲 surface.
carried out on a rigorous quantitative level within the theoretical formalism outlined in Sec. V. Assessments of the effects of higher order phonon processes on the scattering spectra necessitate the full EBA calculations to be carried out. This means that also the terms beyond zeroth and first order in the series expansion of exp关2W kEBA (R, ) 兴 should be retained in the integrand on i ,T s the RHS of Eq. 共10兲. On the other hand, once the elastic and one-phonon scattering intensities have been calculated, the true multiphonon background encompassing two, three, and other higher order processes is obtained by taking the ( ,R)-Fourier transform of the expression (R, ) 兴 ⫺1⫺2W kEBA (R, ) 其 and multiplying 兵 exp关2W kEBA i ,T s i ,T s it by the corresponding Debye-Waller factor . Now, the specificity of the multiphonon exp关⫺2W kEBA 兴 ,T i s component of the HAS spectra in the present scattering regime is in the dominance of one- and two-phonon processes, as evidenced by the values of the Debye-Waller exponents shown in Fig. 12. In this situation the probability of two phonon scattering reaches maximum in the cases involving two RW phonons with wavevectors from the opposite edges of the first SBZ where their density of states is largest. This gives rise to maxima in the multiphonon scattering spectra at
115411-10
He ATOM SCATTERING AND THEORETICAL STUDY OF . . .
¯ -K ¯ direction of the FIG. 15. Same as in Fig. 14 but along the ⌫ surface Brillouin zone.
around ⫾4.3 meV, i.e., approximately twice the RW energy at the zone edge. The thus calculated multiphonon background juxtaposed with the earlier calculated one-phonon DWBA scattering intensities will serve as a basis for our theoretical interpretations of the TOF spectra. Figure 14 shows a comparison of four representative HAS-TOF spectra 共‘‘noisy’’ thin full line兲 recorded at E i ¯ direction with the full EBA scat⫽10.5 meV along the ¯⌫ -M tering intensities 共full thick lines兲. Since the absolute experimental inelastic intensities which depend on many factors are unknown, all calculated intensities in a particular spectrum have been scaled by a common factor so as that the largest calculated and measured intensities 共peak areas兲 match each other at the largest inelastic peak. The elastic peaks in the experimental spectra at ⌬E⫽0 due to incoherent scattering from surface defects, which are not present in the EBA calculations for an ideal surface, are indicated by gray shaded peaks. The broad multiphonon background under the single phonon peaks, which has been calculated following the procedure described in the previous paragraph, is shown by the dashed lines to facilitate comparisons of the relative intensities of the measured and calculated single phonon features. It is gratifying that the present EBA calculations accurately reproduce the relative intensities of both the onephonon and multiphonon loss and gain features in the TOF spectra in Fig. 14. In particular, there is a quantitative agreement between the measured and computed relative intensities of the Rayleigh phonon loss and gain peaks. Most of the other single phonon features in the TOF spectra are reproduced and hence can be identified despite the non-negligible background. The L-mode energy loss, which approaches 4.3 ¯ point, is also nicely reproduced in the calcumeV at the M lated spectra 共see upper right panel in Fig. 14兲. The experimental loss peaks denoted by X at ⌬E⫽⫺4.3 meV with ⌬K values close to the zone center can be interpreted as a feature
PHYSICAL REVIEW B 63 115411
arising from the two RW phonon exchange processes that produce ‘‘decepton type’’ of maxima in the calculated mul¯ azimuth similar good tiphonon background. For the ¯⌫ -K agreement between the measured TOF and calculated EBA HAS intensities is found for the same incident energy of 10.5 meV 共Fig. 15兲. The experimental and theoretical results shown in Figs. 11, 14, and 15 present strong evidence for the observation of all three expected dispersive surface phonon modes, namely, the Rayleigh wave 共RW兲, longitudinal 共L兲, and shear horizontal 共SH兲 phonons. The Rayleigh phonon peaks are the most intense along all directions, as expected from their predominant Z polarization 共see second panel in Fig. 11兲. The longitudinal mode is most clearly seen in the experimental ¯ azimuth and weakly along the ¯⌫ -K ¯ results along the ¯⌫ -M direction, which is also reproduced in the calculated spectra in Figs. 14 and 15. As shown in Fig. 11, the shear horizontal ¯ azimuth. Since this is mode was not observed along the ¯⌫ -M a high symmetry direction of the surface and of the semiinfinite Xe共111兲 crystal one has e (Q,SH)⬜Q and the SH contribution to the Z-polarized density of states is zero along this direction, due to which expression 共15兲 vanishes in the first SBZ. However, the SH mode has discernible intensity in the measured spectra along the other surface symmetry di¯ -M ¯ ⬘ , particularly between the K ¯ and M ¯ ⬘ points. rection ¯⌫ -K This is expected because it is not a high symmetry direction of the surface with respect to the underlying Xe layers. Here ¯ segment of the first SBZ the SH-mode acalong the ¯⌫ -K ¯ -M ¯ ⬘ segquires a fractional Z polarization, and along the K ment outside the first SBZ the exchanged parallel momentum ⌬K⫽Q⫹G is nearly parallel to the polarization vector of the SH mode. Both effects give rise to a nonvanishing scalar product in Eq. 共15兲, and thereby to a nonvanishing coupling matrix element in Eq. 共13兲. Another interesting feature is the maximum in the ⌬K dependence of the RW intensities shown in Figs. 5 and 8. In previous investigations of the RW intensity peaks as a function of ⌬K a monotonic, nearly exponential fall-off with ⌬K was observed for flat metal surfaces.42–44 The ⌬K dependence of the RW phonon excitation probabilities, P kRW,T (⌬K), calculated within the present model are shown i s in insets in Figs. 5 and 8 for the experimental projectile incident energies, scattering directions and substrate temperature, but they are not in accord with the experimental trends shown in the main panel of the figures. This again signals that the present theoretical description of inelastic scattering cannot reproduce the absolute scattering intensities from nonideal surfaces for reasons that are briefly discussed below. The variation of P kRW,T (⌬K) with ⌬K, and hence with i , i s arises from a combined effect of the ⌬K dependences from the phonon induced Debye-Waller factor 共see Fig. 12兲, the DWBA scattering matrix elements 共13兲, the Bose-Einstein distribution ¯n (ប ⌬K,RW), and the total energy conservation condition. The thus calculated P kRW,T (⌬K) complies with the i s optical theorem for inelastic scattering from a flat surface
115411-11
SˇIBER, GUMHALTER, GRAHAM, AND TOENNIES
PHYSICAL REVIEW B 63 115411
that manifests itself through the unitarity of the scattering spectrum 共10兲. The attenuation of P kRW,T (⌬K) for larger ⌬K i s is controlled by the phonon-induced Debye-Waller factor and the Gaussian cutoff in the potential 共14兲. Other factors exhibit nonuniform ⌬K variation over the SBZ, particularly the RW polarization vector that is associated with the topmost Xe layer 关see Eq. 共2兲 and Fig. 11兴. However, the experimentally observed dependence of the RW excitation intensity cannot be described only by the ⌬K behavior of P kRW,T (⌬K) because it does not include 共i.e., is not multii s plied by兲 the ‘‘total’’ Debye-Waller factor which describes the loss of the incoming beam flux into all inelastic and off-specular elastic scattering channels open in the experiment.47,71 Namely, in the case of corrugated surfaces and surfaces with defects an additional reduction of the inelastic scattering intensities occurs due to the scattering of initial beam flux into the diffraction and diffuse elastic scattering channels, and these processes are not accounted for within the present model based on the flat static atom-surface potential 共8兲. Thus, a rapid variation of the specular beam intensity with the change of the incident angle has been observed in HAS from monolayers of Xe on graphite,72 and interpreted theoretically73 as due to the diffraction and selective adsorption effects 共see Figs. 3 and 9 in Ref. 73兲. The loss of beam flux into diffraction and diffuse elastic scattering channels will also lead to a rearrangement of the inelastic intensities as i 共and hence ⌬K) is varied, and this can be described in terms of the diffraction- and the diffuse-scattering-induced Debye-Waller factors,71 in analogy to the phonon-induced component. It is important to observe that although all three components of the total or integrated DWF depend on E i , i , and T s , they are constant for a particular TOF spectrum in which these experimental parameters are fixed. However, as the total DWF varies in magnitude from one scattering spectrum to another as the scattering conditions are changed, it acts as a rescaling factor for the TOF intensities. Indeed, our analyses also show that the abrupt variation of the total ¯ angular distribution at i ⫽40° in signal intensity in the ¯⌫ -K Fig. 2 coincides with the change of the number of open offspecular diffraction channels, and the magnitude of the corresponding ⌬K coincides with the value around which the experimental RW intensity is maximum. Therefore, comparisons of the absolute experimental intensities of phonon loss
*Corresponding author. Email:
[email protected] †
Present address: Infineon Technologies, Corporate Research, OttoHahn-Ring 6, D-81739 Mu¨nchen, Germany. 1 L.W. Bruch, M.W. Cole, and E. Zaremba, in Physical Adsorption: Forces and Phenomena, International Series of Monographs on Chemistry Vol. 23 共Clarendon Press, Oxford, 1997兲. 2 H. Taub, K. Carneiro, J.K. Kjems, L. Passell, and J.P. McTague, Phys. Rev. B 16, 4551 共1977兲. 3 K.D. Gibson and S.J. Sibener, Phys. Rev. Lett. 55, 1514 共1985兲. 4 K.D. Gibson and S.J. Sibener, Faraday Discuss. Chem. Soc. 80, 203 共1985兲. 5 K.D. Gibson, S.J. Sibener, B.M. Hall, D.L. Mills, and J.E. Black,
and gain features with those calculated in the EBA for different TOF spectra and shown in the insets of Figs. 5 and 8 require an accurate knowledge of such total DWF, which is not possible at present. In this situation the only meaningful comparisons can be made for the relative experimental and theoretical intensities of the peaks which bear the same total Debye-Waller factor, i.e., for the peaks from the same TOF spectrum, as has been done in Figs. 14 and 15. VII. CONCLUSIONS
New helium atom scattering results and theoretical calculations for the Xe共111兲 surface have been presented. In addition to the Rayleigh phonon mode, which had been measured previously,3–5,7,8 evidence for the longitudinal and shear horizontal modes of the Xe共111兲 surface was found. The excitation of the shear horizontal mode, in particular, ¯ -M ¯ ⬘ for was only observed in the surface direction ¯⌫ -K ¯ ¯ which it is symmetry allowed along the ⌫ -K segment in the ¯ -M ¯ ⬘ segment outside the first SBZ. first SBZ and along the K The theoretical model developed here can explain all of the experimental inelastic scattering intensities, including the experimentally detected dispersionless X feature at ⌬E⫽ ⫺4.3 meV near the zone center, using gas-phase He-Xe and Xe-Xe potentials without any modification. The X feature, which is resolvable in only some of the spectra, can be attributed either to vibrations associated with surface defects which were not included in the theoretical model or, as supported by the present calculations, to multiphonon ‘‘decepton’’ effects involving excitations of two RW phonons with wavevectors from the opposite edges of the first SBZ. Thus, the present work shows that there are no anomalous scattering effects for thick xenon layers, unlike the recent results for xenon monolayers adsorbed on Cu and NaCl substrates.30–33 This calls for ab initio calculations of the interactions of adlayer Xe atoms with the quoted substrates as this could shed more light on the properties of intralayer force constants that represent an essential ingredient in theoretical interpretations of the phonon excitation intensities in HAS from these systems. ACKNOWLEDGMENTS
The work in Zagreb has been supported in part by the Joint National Science Foundation Grant No. JF 133. J. Chem. Phys. 83, 4256 共1985兲. K. Kern, R. David, R.L. Palmer, and G. Comsa, Phys. Rev. Lett. 56, 2823 共1986兲. 7 K. Kern, R. David, R.L. Palmer, and G. Comsa, Surf. Sci. 175, L669 共1986兲. 8 P. Zeppenfeld, U. Becher, K. Kern, and G. Comsa, J. Electron Spectrosc. Relat. Phenom. 54, 265 共1990兲. 9 Th. Seyller, M. Caragiu, R.D. Diehl, P. Kaukasoina, and M. Lindroos, Chem. Phys. Lett. 291, 567 共1998兲. 10 Th. Seyller, M. Caragiu, R.D. Diehl, P. Kaukasoina, and M. Lindroos, Phys. Rev. B 60, 11 084 共1999兲. 11 K. Horn and A.M. Bradshaw, Solid State Commun. 30, 545 6
115411-12
He ATOM SCATTERING AND THEORETICAL STUDY OF . . .
PHYSICAL REVIEW B 63 115411
共1979兲; C. Mariani, K. Horn, and A.M. Bradshaw, Phys. Rev. B 25, 7798 共1982兲. 12 K. Wandelt, J. Hulse, and J. Ku¨ppers, Surf. Sci. 104, 212 共1981兲; K. Wandelt and J. Hulse, J. Chem. Phys. 80, 1340 共1984兲. 13 K. Wandelt and B. Gumhalter, Surf. Sci. 140, 355 共1984兲, and references therein. 14 T. Mandel, G. Kaindl, M. Domke, W. Fischer, and W.D. Schneider, Phys. Rev. Lett. 55, 1638 共1985兲. 15 A. Jablonski, S. Eder, K. Markert, and K. Wandelt, J. Vac. Sci. Technol. A 4, 1510 共1986兲. 16 I.T. Steinberger and K. Wandelt, Phys. Rev. Lett. 23, 2494 共1987兲. 17 T. Schmitz-Hu¨bsch, K. Oster, J. Radnik, and K. Wandelt, Phys. Rev. Lett. 74, 2595 共1995兲. 18 M. Gru¨ne, T. Pelzer, K. Wandelt, and I.T. Steinberger, J. Electron Spectrosc. Relat. Phenom. 98-99, 121 共1999兲. 19 M. Scheffler, K. Horn, A.M. Bradshaw, and K. Kambe, Surf. Sci. 80, 69 共1979兲. 20 M. Weinelt, P. Trischberger, W. Widdra, K. Eberle, P. Zebisch, S. Gokhale, D. Menzel, J. Henk, R. Feder, H. Dro¨ge, and H.-P. Steinru¨ck, Phys. Rev. B 52, R17 048 共1995兲. 21 P. Trischberger, H. Dro¨ge, S. Gokhale, J. Henk, H.-P. Steinru¨ck, W. Widdra, and D. Menzel, Surf. Sci. 377-379, 155 共1997兲. 22 E. Bertel, W. Jacob, and V. Dose, Appl. Phys. A: Solids Surf. 44, 93 共1987兲; E. Bertel, Surf. Sci. 367, L61 共1996兲, and references therein. 23 K. Horn, K.H. Frank, J.A. Wilder, and B. Reihl, Phys. Rev. Lett. 57, 1064 共1986兲; J. Vac. Sci. Technol. A 5, 739 共1987兲; K.H. Frank, K. Horn, J. Wilder, and E.E. Koch, Appl. Phys. A: Solids Surf. 44, 97 共1987兲. 24 W. Widdra, P. Trischberger, W. Frieß, D. Menzel, S.H. Payne, and H.J. Kreuzer, Phys. Rev. B 57, 4111 共1998兲. 25 P. Zeppenfeld, S. Horch, and G. Comsa, Phys. Rev. Lett. 73, 1259 共1994兲. 26 W. Allers, A. Schwarz, V.D. Schwarz, and R. Wiesendanger, Europhys. Lett. 48, 276 共1999兲. 27 B.F. Mason and B.R. Williams, Surf. Sci. 148, L686 共1984兲. 28 P. Zeppenfeld, M. Bu¨chel, R. David, G. Comsa, C. Ramseyer, and C. Girardet, Phys. Rev. B 50, 14 667 共1994兲. 29 C. Ramseyer, V. Pouthier, C. Girardet, P. Zeppenfeld, M. Bu¨chel, V. Diercks, and G. Comsa, Phys. Rev. B 55, 13 203 共1997兲. 30 A.P. Graham, M.F. Bertino, F. Hofmann, J.P. Toennies, and Ch. Wo¨ll, J. Chem. Phys. 106, 6194 共1997兲. 31 J. Braun, D. Fuhrmann, A. Sˇiber, B. Gumhalter, and Ch. Wo¨ll, Phys. Rev. Lett. 80, 125 共1998兲. 32 A. Sˇiber, B. Gumhalter, J. Braun, A.P. Graham, M.F. Bertino, J.P. Toennies, D. Fuhrmann, and Ch. Wo¨ll, Phys. Rev. B 59, 5898 共1999兲. 33 R. Gerlach, A.P. Graham, J.P. Toennies, and H. Weiss, J. Chem. Phys. 109, 5319 共1998兲. 34 L.W. Bruch, J. Chem. Phys. 107, 4443 共1997兲. 35 L.W. Bruch, A.P. Graham, and J.P. Toennies, J. Chem. Phys. 112, 3314 共2000兲. 36 R.A. Aziz and M.J. Slaman, Mol. Phys. 58, 679 共1986兲; A.K. Dham, A.R. Allnatt, W.J. Meath, and R.A. Aziz, ibid. 67, 1291 共1989兲; A.K. Dham, W.J. Meath, A.R. Allnatt, R.A. Aziz, and M.J. Slaman, Chem. Phys. 142, 173 共1990兲. 37 B.J. Palmer, D.H. Saunderson, and D.N. Batchelder, J. Phys. C 6, L313 共1973兲; N.A. Lurie, G. Shirane, and J. Skalyo, Jr., Phys.
Rev. B 9, 5300 共1974兲; N.P. Gupta and P.K. Garg, Solid State Commun. 16, 607 共1975兲. 38 J.P. Toennies, in Surface Phonons, Springer Series in Surface Sciences Vol. 21, edited by W. Kress and F. de Wette 共SpringerVerlag, Berlin, 1988兲, p. 111. 39 A.D. Novaco and J.P. McTague, Phys. Rev. Lett. 38, 1286 共1977兲. 40 T. Engel and K.H. Rieder, in Structural Studies of Surface with Atomic and Molecular Beams, Springer Tracts in Modern Physics No. 91 共Springer, Berlin, 1982兲, p. 55. 41 D. Farias and K.H. Rieder, Rep. Prog. Phys. 61, 1575 共1998兲. 42 D. Eichenauer, U. Harten, J.P. Toennies, and V. Celli, J. Chem. Phys. 86, 3693 共1987兲. 43 F. Hofmann, J.P. Toennies, and J.R. Manson, J. Chem. Phys. 101, 10 155 共1994兲. 44 G. Witte, J.P. Toennies, and Ch. Wo¨ll, Surf. Sci. 323, 228 共1995兲. 45 R. Allen, G.P. Alldredge, and F.W. de Wette, Phys. Rev. B 4, 1648 共1971兲; 4, 1661 共1971兲; 4, 1682 共1971兲. 46 L.W. Bruch, A.P. Graham, and J.P. Toennies, Mol. Phys. 95, 579 共1998兲. 47 A. Bilic´ and B. Gumhalter, Phys. Rev. B 52, 12 307 共1995兲. 48 K.T. Tang and J.P. Toennies, J. Chem. Phys. 66, 1496 共1977兲; Z. Phys. D: At., Mol. Clusters 1, 91 共1986兲. 49 K.M. Smith, A.M. Rulis, G. Scoles, R.A. Aziz, and V. Nain, J. Chem. Phys. 67, 152 共1977兲. 50 A.F. Devonshire, Proc. R. Soc. London, Ser. A 158, 269 共1937兲. 51 V. Bortolani and A.C. Levi, Riv. Nuovo Cimento 9, 1 共1986兲. 52 V. Celli, in Surface Phonons, edited by W. Kress and F.W. de Wette 共Springer, Berlin, 1991兲, p. 167. 53 G. Santoro and V. Bortolani, in Inelastic Energy Transfer in Interactions with Surfaces and Adsorbates, edited by B. Gumhalter, A.C. Levi, and F. Flores 共World Scientific, Singapore, 1993兲, p. 1. 54 E. Kirsten and K.H. Rieder, Surf. Sci. 222, L837 共1989兲; E. Kirsten, G. Parschau, and K.H. Rieder, ibid. 236, L365 共1990兲. 55 B. Gumhalter, A. Sˇiber, and J.P. Toennies, Phys. Rev. Lett. 83, 1375 共1999兲. 56 K. Burke, B. Gumhalter, and D.C. Langreth, Phys. Rev. B 47, 12 852 共1993兲. 57 B. Gumhalter, K. Burke, and D.C. Langreth, Surf. Rev. Lett. 1, 133 共1994兲. 58 W. Brenig, Z. Phys. B 36, 81 共1979兲. 59 B. Gumhalter and A. Bilic´, Surf. Sci. 370, 47 共1997兲. 60 B. Gumhalter, Surf. Sci. 347, 237 共1996兲. 61 A. Sˇiber and B. Gumhalter, Surf. Sci. 385, 270 共1997兲. 62 V. Bortolani, A. Franchini, N. Garcia, F. Nizzoli, and G. Santoro, Phys. Rev. B 28, 7358 共1983兲. 63 V. Celli, G. Benedek, U. Harten, J.P. Toennies, R.B. Doak, and V. Bortolani, Surf. Sci. 143, L376 共1984兲. 64 A. Glebov, J.R. Manson, J.G. Skofronick, and J.P. Toennies, Phys. Rev. Lett. 78, 1508 共1997兲. 65 A.M. Lahee, J.R. Manson, J.P. Toennies, and Ch. Wo¨ll, J. Chem. Phys. 86, 7194 共1987兲. 66 D. Evans, V. Celli, G. Benedek, J.P. Toennies, and R.B. Doak, Phys. Rev. Lett. 50, 1854 共1983兲. 67 G. Benedek, Phys. Rev. Lett. 35, 234 共1975兲. 68 S. Miret-Arte´s, Surf. Sci. Lett. 366, L735 共1996兲; G. Benedek, R. Gerlach, A. Glebov, G. Lange, S. Miret-Artes, J.G. Skofronick, and J.P. Toennies, Phys. Rev. B 53, 11 211 共1996兲.
115411-13
SˇIBER, GUMHALTER, GRAHAM, AND TOENNIES 69
PHYSICAL REVIEW B 63 115411
R.B. Doak, in Atomic and Molecular Beam Methods, Vol. 2, edited by G. Scoles 共Oxford University Press, New York, 1992兲, p. 384. 70 The calculations yield frequencies of 0.95 meV for the parallel, and 1.65 and 2.7 meV for perpendicular vibrations of isolated
¯ ) of the backfolded first SBZ. xenon atoms at the center (⌫ B. Gumhalter and D.C. Langreth, Phys. Rev. B 60, 2789 共1999兲. 72 G. Bracco, MS thesis, University of Genova, 1981. 73 J.M. Hutson and C. Schwartz, J. Chem. Phys. 79, 5179 共1983兲. 71
115411-14