PHYSICAL REVIEW B, VOLUME 64, 045401
Determination of shear stiffness based on thermal noise analysis in atomic force microscopy: Passive overtone microscopy Tanja Drobek, Robert W. Stark,* and Wolfgang M. Heckl† Universita¨t Mu¨nchen, Institut fu¨r Kristallographie und Angewandte Mineralogie, Theresienstraße 41, 80333 Mu¨nchen, Germany 共Received 30 November 2000; published 21 June 2001兲 In torsional overtone microscopy, a dynamic atomic force microscopy technique, antisymmetric vibration modes of a v-shaped cantilever are used to investigate the elastic properties of the tip-sample contact. In order to minimize the vibration amplitude, no external excitation is added in the passive overtone mode. In this mode, the thermomechanical noise of the surface coupled cantilever at room temperature is analyzed. This allows the shear stiffness of the tip-sample contact to be extracted from the analysis of the power spectrum of the photodiode signal. The load dependence of the first torsional vibration on silicon, aluminum, and cadmium telluride surfaces is compared with a theoretical mechanical model. DOI: 10.1103/PhysRevB.64.045401
PACS number共s兲: 68.37.Ps, 62.20.⫺x, 62.25.⫹g, 81.70.⫺q
I. INTRODUCTION
The combination of high spatial resolution with high force sensitivity in atomic force microscopy 共AFM兲1 makes it a suitable instrument for the investigation of elastic properties. The elastic modulus of soft materials can be determined by quasistatic nanoindentation measurements on the nanometer scale.2 For stiff materials the accuracy of this method is limited, since small tip radii imply a high contact pressure even at low forces, and therefore the limit of plastic deformation restricts the applicable forces.3 The rate of data acquisition for quasistatic indentation methods is limited by the fundamental resonant frequency of the cantilever, though it is possible to accelerate the quasistatic methods by miniaturizing the probes.4 Dynamic methods like fourier transformed force microscopy,5,6 ultrasonic force microscopy,7–10 and acoustic friction force microscopy11,12 take advantage of the effects of tip-sample interactions on the cantilever vibration in order to characterize the sample. In torsional overtone microscopy, an antisymmetric vibration mode of the cantilever is used to achieve image contrast based on the shear stiffness of the tip-sample contact.13 In thermodynamic equilibrium the mean-square displacement of the tip from its neutral position is described by
冑具 u 2 典 ⫽
冑
k BT . c cant
共1兲
Here, u is the z-displacement of the tip, k B is the Boltzmann constant, T the temperature of the surrounding heat bath, c cant the cantilever spring constant, and 具典 denotes the average in time 共cf. e.g.14,15兲. Therefore the average potential energy of the Brownian motion of the cantilever is 1/2k BT for each degree of freedom. By measuring the spectral power density and the resonant frequencies of this thermomechanical noise it is possible to calibrate the force constant of the AFM probe.14,16,17 Another application of the thermal noise is the investigation of oscillatory hydration potentials and the measurement of viscoelastic parameters of polymers.18,19 Here we report on the investigation of mechanical sample properties by analysis of the thermomechanical noise of the 0163-1829/2001/64共4兲/045401共5兲/$20.00
first antisymmetric eigenmode of the cantilever. In this small amplitude limit of force microscopy, friction effects20,21 and nonlinearities22 are minimized. The cantilever used in this experiment has a spring constant of c norm⫽0.13 N/m, so in z-direction the free cantilever has a mean square displacement 冑具 u z2 典 ⫽1.8 Å, which is reduced when the tip is in contact with the sample. It has a lateral spring constant of c tor⫽13.4 N/m and the lateral mean square displacement 冑具 u 2y 典 of the tip from the neutral position at room temperature is
冑具 u 2y 典 ⫽
0.64 Å
冑c tor
⬍20 pm,
共2兲
which is smaller than the typical interatomic distance. This lateral oscillation amplitude is the lower experimental limit achievable in room temperature AFM. II. MODELING
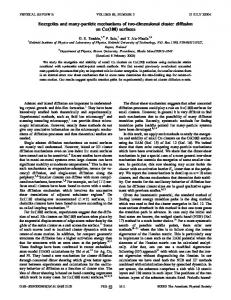
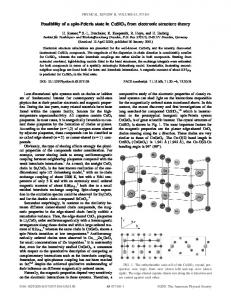
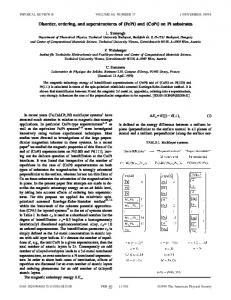
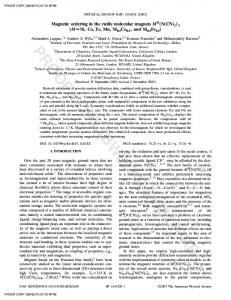
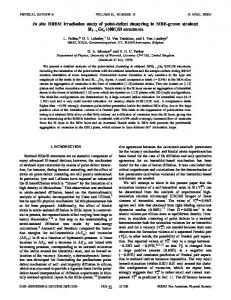
When the movement of the AFM tip is restricted by the interaction forces between the tip and the sample, the boundary conditions of the cantilever motion change, inducing a node in the vibrational motion at the tip and increasing the resonant frequencies. Due to their different bending shapes, the symmetric and antisymmetric vibration modes are influenced differently by the contact stiffness normal to the sample surface and the lateral stiffness parallel to the sample surface. In Fig. 1, the principle of the torsional overtone microscopy is shown. The v-shaped cantilever is driven at the resonant frequency of the first antisymmetric 共torsional兲 vibration, where both arms oscillate in opposing directions, giving rise to a torque at the front end of the cantilever. In the case of a free cantilever, the tip executes a lateral motion. In contact with the sample surface, the torque leads to a different bending shape as well as an increase of the resonant frequency of the torsional vibration mode.13 Though the contact stiffness in the normal as well as in the lateral directions are not proportional to the loading force, in the small amplitude limit they can be approximated
64 045401-1
©2001 The American Physical Society
TANJA DROBEK, ROBERT W. STARK, AND WOLFGANG M. HECKL
PHYSICAL REVIEW B 64 045401
⫽
FIG. 1. Principle of passive overtone microscopy. The tipsample contact is modelled as a tripod of linear springs k lat/x , k lat/y , and k norm attached to the tip. The Brownian motion of the cantilever is detected by an optical-beam setup and investigated with a spectrum analyzer.
as a tripod of linear springs k norm , k lat/x , and k lat/y , which are mounted on the tip apex.The linearized shear stiffness k lat is proportional to the contact radius a,23 k lat⫽8G * a,
共3兲
冉
冊
.
共4兲
冉
1⫺ 21 E1
⫹
1⫺ 22 E2
冊
a⫽
冋
3R 4E *
共 P⫹3 RW⫹ 冑6 RW P⫹ 共 3 RW 兲 2 兲
册
1/3
. 共10兲
Here, P is the normal load pressing the tip into the surface. The work of adhesion W can be determined experimentally by measuring the pull-off force P sep , which is necessary to separate tip and sample,29
⫺1
.
共5兲
For anisotropic materials, the correction factor  (hkl) has to be introduced into the second term24 leading to the indentation modulus M (hkl) ⫽  (hkl)
共9兲
.
⫺1
The effective Young’s modulus E * of the tip sampler contact, with respect to Young’s moduli E i , is given by E *⫽
E * 2 z 30
1/3
Here, z 0 is the equilibrium separation of the Lennard-Jones potential, R is the tip radius, and W the work of adhesion. For stiff materials with small long-range attractive forces, i.e. for ⬍0.1, the contact mechanics is described by Dejarguin, Mu¨ller, and Toporov 共DMT兲,2728 whereas for ⬎5, in the case of compliant materials with large, short-range attractive forces, the Johnson-Kendall-Roberts model 共JKR兲 can be applied.29 Though in between both extremes the adequate description is given by the Maugis-Dugdale model 共MD兲,30 it was shown that for ⬎0.3, the radius of contact is well predicted by the JKR model.26 In the experiment reported here, the values of are in the range of 0.34 to 0.56, thus the JKR model was used for the interpretation of the experimental data. In the framework of the JKR23 theory the contact radius is given by
where G * is the effective shear stiffness of the tip-sample contact, which is calculated from the shear moduli G i and the Poisson’s ratios of the tip and sample materials 2⫺ 1 2⫺ 2 G *⫽ ⫹ G1 G2
冉 冊 RW 2
冉 冊 E ⬍100⬎ 1⫺ 2
.
共6兲
The Young’s modulus E ⬍100⬎ in ⬍100⬎ direction of the crystal is easily derived from the components of the elastic tensor25 ⫺1 E ⬍100⬎ ⫽s 11 .
共8兲
Since different material properties, such as elasticity and adhesion, contribute to the interaction between tip and sample, there is no general description of the contact mechanics. The conditions of the contact can be characterized by the parameter , which represents the ratio of the elastic displacement of the surfaces at the point of separation 共pulloff兲 to the effective range of the surface forces26
共11兲
In order to get a realistic description of the mechanical behavior of the system, the cantilever was modeled by finite element analysis 共FEA兲. The finite element analysis was carried out using the static and modal analysis tools of the commercial software package ANSYS 5.4 running on an IBM-SP2 workstation at the Leibniz Rechenzentrum, Mu¨nchen, Germany. The resonant spectrum of the v-shaped cantilever was calculated solving the eigenvalue problem M u¨⫹C u˙⫹K u⫽0.
共7兲
The effective shear modulus is calculated from the shear moduli G i of tip and sample by Eq. 共4兲. The shear modulus is calculated from the components s i j of the elastic tensor25 G⫽ 关 2 共 s 11⫺ s 12兲兴 ⫺1 .
P sep⫽⫺1.5 WR.
共12兲
M and K are the mass and the stiffness matrix, C is the damping matrix, and u denotes the nodal translation vector. The influence of the tip-sample contact is introduced into the model as a tripod of linear springs connected to the tip. Since the boundary conditions are not time dependent, they are integrated in the stiffness matrix K. In order to avoid an unrealistic deformation of the tip in the FEA model, each spring was divided into 65 separate parallel springs, connected to each node of the tip, which was modeled as a cut off pyramid. The cantilever model was built up as a mesh of 4062 nodes, consisting of a single material component. For the correct section moment, the Young’s modulus of this material was reduced,31 whereas the Poisson’s ratio was in-
045401-2
DETERMINATION OF SHEAR STIFFNESS BASED ON . . .
PHYSICAL REVIEW B 64 045401
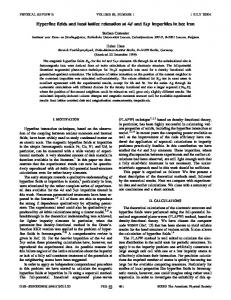
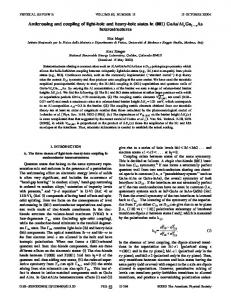
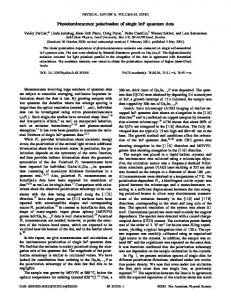
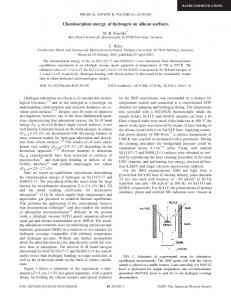
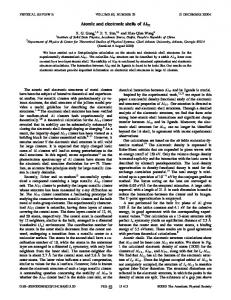
FIG. 2. Calculated resonant frequency 共squares兲 of the first torsional vibration mode versus spring constants of the lateral springs (k lat/x , k lat/y 兲. An empirical Logistic function 共solid line, parameters k 0 ⫽113.0 N/m, f 1 ⫽192.3 kHz, f 2 ⫽248.8 kHz, p⫽1.004) is a good approximation for the FEA data.
creased to reproduce the resonant frequencies of the torsional vibration modes. In this procedure, the different experimentally determined values of the damping were taken into account, which lead to a shift of the resonant frequencies. Mesh refinement was performed in order to verify the mesh independence of the solutions. The result of the modal analysis is shown in Fig. 2. The resonant frequency f tor of the first antisymmetric mode is plotted against the shear stiffness k lat of the tip-sample contact. Since f tor is independent of k norm , a value of 100 N/m was used for the normal springs, which is a typical value for the contact stiffness of an AFM tip on an aluminum surface. The value for f tor versus the lateral spring constant is fitted empirically by the logistic function f tor⫽
f 1⫺ f 2 ⫹f2, k lat p 1⫹ k0
冉 冊
共13兲
with the parameters k 0 ⫽113.0 N/m, the frequency of the free cantilever torsion f 1 ⫽192.3 kHz, the frequency of the cantilever torsion with a clamped tip f 2 ⫽248.8 kHz, as well as an exponent p⫽1.004. This fitting function has a symmetric sigmoidal shape on a logarithmic scale. Using Eq. 共13兲 the lateral stiffness of the tip-sample contact is derived from the shift of the resonant frequency. III. EXPERIMENTAL
The spectral density of the thermomechanical noise of the AFM photodiode signal was measured with the tip in contact to different sample surfaces. Quasistatic cycles of loading and unloading were carried out in order to investigate the dependence of the lateral stiffness from the contact radius. Between the loading and unloading steps, and data acquisition, a time interval of 90 s was added for relaxation. The data were obtained with a modified commercial AFM instrument in ambient conditions 共Topometrix Explorer, dry scanner, 130 m scan range and 10 m z-range兲. The de-
flection of the cantilever was detected by an optical lever system and a quadrant photodiode. The frequency spectra of the thermal noise were measured with a spectrum analyzer 共HP E 4402 B, ESA-E series兲. The respective work of adhesion was determined from a series of quasistatic forcedistance curves on the samples. All experiments were performed with a single cantilever 共Park Scientific Instruments, sharpened Microlever, gold-coated Si3 N4 , v-shaped, nominal spring constant c⫽0.1 N/m, measured spring constant c ⫽0.13 N/m, resonant frequency nominal f 0 ⫽38 kHz, and measured 31.5 kHz兲. The exact geometry of the cantilever used in the experiment was obtained from a detailed SEM analysis.32 The thickness of the gold layer was measured with the AFM on an edge produced by partially removing the coating. In the experiment three different samples were investigated. The surface of a silicon 共100兲 wafer, a piece of polycrystalline aluminum 共Topometrix test sample兲, and the 共100兲 surface of a cubic Cadmium Telluride 共CdTe兲 single crystal. An isotropic approach was used for the calculation of the effective shear stiffness G * . IV. RESULTS AND DISCUSSION
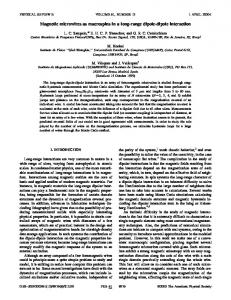
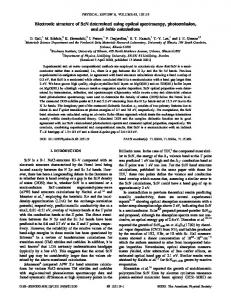
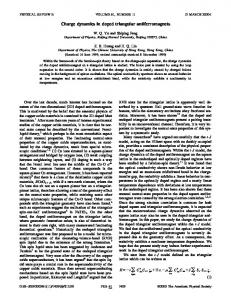
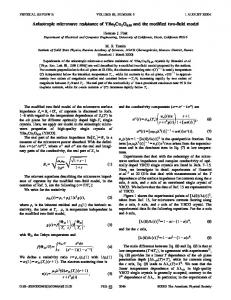
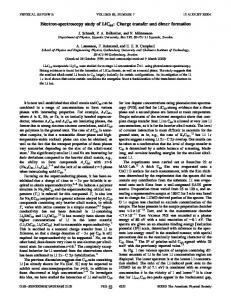
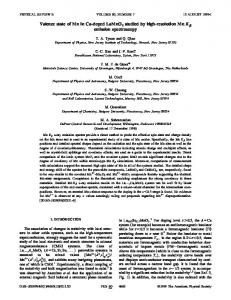
The spectral density of the thermomechanical noise of the cantilever in the frequency range from 180 kHz to 230 kHz for several loading forces on the aluminum sample is shown in Fig. 3. Curve 共1兲 is the torsional resonance of the free cantilever with a resonant frequency of f 1 ⫽192.8 kHz. The contact resonances 关curves 共2兲 to 共7兲兴 were measured increasing the loading force P stepwise. While the peak intensity decreases at higher loading forces, the torsional resonant frequency is shifted towards higher frequencies. Here the higher loading forces cause an expansion of the contact region and therefore an increase of the lateral stiffness k lat , leading to a frequency shift of the torsional resonance as predicted by modal analysis 关cf. Fig. 共2兲兴. For a detailed analysis, the frequency shifts were determined by fitting a resonance peak to the spectral density data. With Eq. 共13兲, the lateral stiffness values were calculated from the measured frequency shifts. The lateral stiffness measured during approach/retract cycles on the Al, Si, and CdTe samples is presented in Fig. 4, plotted versus the loading force P. The data were fitted using Eq. 共10兲 and Eq. 共3兲, achieving experimental values for the reduced shear stiffness G * as a fit parameter. The results of the fitting procedure are listed in Table I. With an effective tip radius of 24 nm and the reduced shear stiffness G * calculated from the literature data,33 the fitting curve of the JKR model reproduces the experimental data very well. For a quantitative deviation of the shear stiffness, the data achieved on the aluminum surface was taken as a calibration standard for the interpretation of the data measured on the other samples. For the silicon data, a fit with the same effective tip radius leads to a reduced shear stiffness value, which is about 10% smaller than the calculated value. Due to the higher rigidity of the silicon material, uncertainties in the elastic constants of the tip material as well as deviations from the ideal spherical geometry show a stronger influence on the real area of
045401-3
TANJA DROBEK, ROBERT W. STARK, AND WOLFGANG M. HECKL
PHYSICAL REVIEW B 64 045401
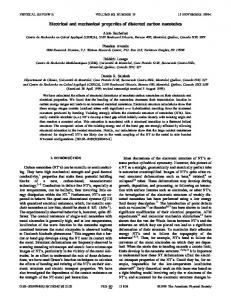
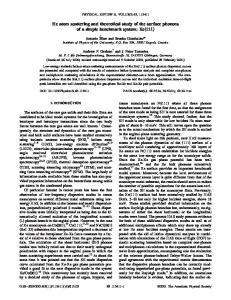
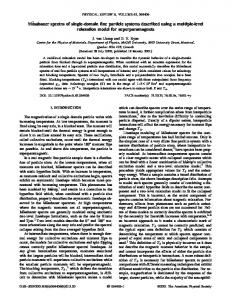
FIG. 4. Lateral stiffness determined from the resonant frequencies of the first torsional vibration as obtained from noise spectra in contact with Si, Al, and CdTe surfaces versus the loading force P. * The data were fitted using the JKR model 共solid lines兲 for G Si * ⫽9.6 GPa, and G CdTe * ⫽4.6 GPa. The dotted line ⫽14.4 GPa, G Al shows an approach retract cycle on CdTe 共curved arrow兲. The onset of the hysteretic behavior is indicated with an arrow. Note the apparent softening due to plastic deformation, as well as the higher stiffness in retraction caused by an enlarged contact area.
FIG. 3. Noise spectra of the first torsional vibration. 共1兲 free cantilever, 共2兲-共7兲 surface coupled cantilever 共aluminum sample兲. The loading force P was increased step-by-step as indicated.
contact than on compliant materials. For the cadmium telluride sample the experimental value is about 3% higher than the literature data. The CdTe sample also shows nonelastic effects: in Fig. 4, the dotted line is connecting the lateral stiffness data measured in an approach retract cycle. The arrow indicates the beginning of a hysteretic behavior, starting at a loading force of P⬎21 nN explained by the transition from elastic to plastic deformation. From JKR theory, the contact radius is a⫽3.8 nm. Therefore, the average pressure is about 470 MPa, while the maximum pressure at the tip apex is 690 MPa.23 This value is comparable to a Mohs’ hardness of 600 MPa reported for cubic CdTe.34 The deviations from values obtained by macroscopic methods are presumably caused by a nonideal tip shape. In the approach direction, contact softens at the occurrence of plastic yielding. In retraction, the area of contact between tip and sample is increased, leading to a stiffened effective contact. Thus, for a determination of elastic parameters, only values in approach direction, before the onset of yield, were used. V. CONCLUSIONS
An alternative approach for the determination of elastic sample properties by atomic-force microscopy has been introduced here. In order to minimize the tip amplitude and thus avoid nonlinearities and friction effects in the tip-
sample contact, only passive thermal excitation was exploited. Analyzing the spectral density of the thermomechanical fluctuations attributed to the first antisymmetric 共torsional兲 vibrational mode of the surface-coupled cantilever, the shear stiffness of the specimen was obtained. The experiment shows that passive torsional overtone microscopy is a quantitative method for the determination of nanomechanical properties with high spatial resolution. Additionally, it can be applied to quasistatic indentation measurements, where it provides complementary information on the mechanical contact properties. It also should be TABLE I. Experimental data of the effective shear modulus for silicon, aluminum, and cadmium telluride G * in comparison with the values calculated from the material parameters reported in literature. The tip was modeled using the elastic constants of amorphous silicon nitride. The pull-off force P sep was determined from force-distance curves.
G* exp共GPa兲 * 共GPa兲 G calc E * 共GPa兲 E ⬍100⬎ 共GPa兲 G calc共GPa兲 s 11 (TPa⫺1 ) b s 12 (TPa⫺1 ) b s 44 (TPa⫺1 ) b c P sep(nN) a
Reference 31. Reference 33. c Reference 24. b
045401-4
Si
Al
CdTe
14.4 15.9 75.6 129 50.5 0.28 7.74 ⫺2.17 12.6 0.92 16.2
9.6 9.6 50.2 63.3 23.1 0.36 15.8 ⫺5.8 35.8 0.95 10.7
4.6 4.5 22.1 23.4 8.3 0.41 42.7 ⫺17.4 49.5 0.89 14.8
Si3 N4 a
170 60 0.27
DETERMINATION OF SHEAR STIFFNESS BASED ON . . .
PHYSICAL REVIEW B 64 045401
possible to make use of the method for single molecule force spectroscopy experiments in order to obtain further information on viscoelastic properties.35 For an extensive analysis of the contact properties, other resonances can also be analyzed.
*Present address: Nanotechnology Group, Swiss Federal Institute of Technology, ETH-Center/CLA, CH-8092 Zu¨rich, Switzerland. † Corresponding author: Tel. Fax: ⫹⫹49-共0兲89-2394-4331, Email address:
[email protected] 1 G. Binnig, C.F. Quate, and C. Gerber, Phys. Rev. Lett. 56, 930 共1986兲. 2 B. Capella and G. Dietler, Surf. Sci. Rep. 34, 1 共1999兲. 3 R.W. Carpick and M. Salmeron, Chem. Rev. 97, 1163 共1997兲. 4 M.B. Viani, T.E. Scha¨ffer, and G.T. Paloczi, Rev. Sci. Instrum. 70, 4300 共1999兲. 5 R.W. Stark and W.M. Heckl, Surf. Sci. 457, 219 共2000兲. 6 M. Stark, R.W. Stark, W.M. Heckl, and R. Guckenberger, Appl. Phys. Lett. 77, 3293 共2000兲. 7 K. Yamanaka, H. Ogiso, and O. Kolosov, Appl. Phys. Lett. 64, 178 共1994兲. 8 K. Yamanaka, A. Noguchi, T. Tsuji, T. Koike, and T. Goto, Surf. Interface Anal. 27, 600 共1999兲. 9 U. Rabe and W. Arnold, Appl. Phys. Lett. 64, 1493 共1994兲. 10 U. Rabe, S. Amelio, E. Kester, V. Scherer, S. Hirsekorn, and W. Arnold, Ultrasonics 38, 430 共2000兲. 11 K.J. Wahl, S.V. Stepnovski, and W.N. Unertl, Tribol. Lett. 5, 103 共1998兲. 12 V. Scherer, W. Arnold, and B. Bhushan, Surf. Interface Anal. 27, 578 共1999兲. 13 T. Drobek, R.W. Stark, M. Gra¨ber, and W.M. Heckl, New J. Phys. 1, 15 共1999兲. 14 J.L. Hutter, J. Bechhoefer, Rev. Sci. Instrum. 64, 1868 共1993兲. 15 P. Saulson, Phys. Rev. D 42, 2437 共1990兲. 16 H.J. Butt and M. Jaschke, Nanotechnology 6, 1 共1995兲. 17 R.W. Stark, T. Drobek, and W.M. Heckl, Ultramicroscopy 86, 207 共2001兲. 18 J.P. Cleveland, T.E. Scha¨ffer, and P.K. Hansma, Phys. Rev. B 52, R8692 共1995兲.
ACKNOWLEDGMENTS
We thank Agilent GmbH Germany for supplying the spectrum analyzer for test purposes. This work was supported by DFG Grant He-1617/7-1 共TD兲 and BMBF 共RWS兲. 19
A. Roters, M. Gelbert, M. Schimmel, J. Ru¨he, and D. Johannsmann, Phys. Rev. E 56, 3256 共1997兲. 20 J.J. Chen, B.D. Yang, and C.H. Menq, J. Sound Vib. 229, 775 共2000兲. 21 H.K. Hong and C.S. Liu, J. Sound Vib. 229, 1171 共2000兲. 22 M. Troyon, Z. Wang, D. Pastre, H.N. Lei, and A. Hazotte, Nanotechnology 8, 163 共1997兲. 23 K.L. Johnson, Contact Mechanics 共Cambridge University Press, Cambridge, 1985兲. 24 J.J. Vlassak and W.D. Nix, J. Mech. Phys. Solids 42, 1223 共1994兲. 25 J.F. Nye, Physical Properties of Crystals 共Oxford Science Publications, Oxford, 1985兲. 26 K.L. Johnson and J.A. Greenwood, J. Colloid Interface Sci. 192, 326 共1997兲. 27 B.V. Derjaguin, V.M. Mu¨ller, and Y.P. Toporov, J. Colloid Interface Sci. 53, 314 共1975兲. 28 V.M. Mu¨ller, B.V. Derjaguin, and Y.P. Toporov, Colloids Surface 7, 251 共1983兲. 29 K.L. Johnson, K. Kendall, and A.D. Roberts, Proc. R. Soc. London, Ser. A 324, 301 共1971兲. 30 D. Maugis, Rev. Metall./Cah. Inf. Tech. 94, 655 共1997兲. 31 J. Hazel and V. Tsukruk, Thin Solid Films 339, 249 共1999兲. 32 Nanotools GmbH, SEM Certificate, Technical report, LMU Munich, 2000 共unpublished兲. 33 Landolt-Bo¨rnstein in Zahlenwerte und Funktionen aus Naturwissenschaften und Technik, edited by K.H. Hellwege and A.M. Hellwege, Vol. 11 共Springer-Verlag, Berlin, 1979兲. 34 CRS, Handbook of Chemistry and Physics, 70th ed. 共CRC, Boca Raton, Florida, 1989兲. 35 M. Rief, F. Oesterhelt, B. Heymann, and H.E. Gaub, Science 275, 1295 共1997兲.
045401-5