Jan 18, 2001 - 95, 129 1995. 4 J.L. Dormann, D. Fiorani, and E. Tronc, in Advances in Chemical. Physics, edited by I. Prigogine and Stuart A. Rice John Wiley.
PHYSICAL REVIEW B, VOLUME 63, 064406
Mo¨ssbauer spectra of single-domain fine particle systems described using a multiple-level relaxation model for superparamagnets J. van Lierop and D. H. Ryan Centre for the Physics of Materials, Department of Physics, McGill University, 3600 University Street, Montreal, Quebec H3A 2T8, Canada 共Received 28 July 2000; published 18 January 2001兲 A multilevel relaxation model has been developed to describe the dynamic behavior of a single-domain particle from blocked through to superparamagnetic. When combined with an accurate expression for the relaxation time and a log-normal particle size distribution, this model successfully describes the Mo¨ssbauer spectra of real fine particle systems at all temperatures of interest, and yields consistent values for anisotropy and blocking temperature. Spectra of two Fe3 O4 ferrofluids and a polysaccharide iron complex have been fitted. Blocking temperatures (T B ) determined with our model agree with those extrapolated from frequency dependent ac data. Anisotropy energies (K) are in the range of 1–3⫻104 J/m3 and superparamagnetic relaxation times are ⬃10⫺8 s. Interparticle interactions are shown to reduce both K and T B . DOI: 10.1103/PhysRevB.63.064406
PACS number共s兲: 75.50.Tt, 76.60.Es, 76.80.⫹y
I. INTRODUCTION
The magnetization of a single domain particle varies with increasing temperature. At low temperatures, the moment is fixed along its easy axis, in a blocked state. The moment will remain blocked until the thermal energy is great enough to allow it to oscillate around its easy axis. These oscillations, called collective excitations, occur until the thermal energy increases in magnitude to the point where 180° moment flips are possible. At and above this temperature, the particle is superparamagnetic. In a real magnetic fine particle sample there is a distribution of particle sizes. At the lowest temperatures, when all moments are blocked, Mo¨ssbauer spectra can be described with static hyperfine fields. With an increase in temperature, as moments unblock and collective excitations begin, spectra exhibit an asymmetric lineshape which becomes more pronounced with increasing temperature. This phenomena has been modeled by Mo” rup,1 and results in a correction to the hyperfine field which, when combined with a particle size distribution, properly describes the asymmetric lineshape observed in the Mo¨ssbauer spectrum. At high temperatures where the magnetic moments are all superparamagnetic, Mo¨ssbauer spectra are generally modeled using stochastic two-level lineshape formalisms, such as the one by Blume and Tjon.2 Two level models describe the 0° and 180° moment orientations along the easy axis and predict the spectral collapse arising from the time averaged hyperfine field. At intermediate temperatures, where there is enough thermal energy for collective excitations and moment flips to occur, the models for collective excitations and spin flipping cannot correctly predict Mo¨ssbauer spectral lineshapes. At any given intermediate temperature, moments associated with the largest particles will be blocked, intermediate sized particle moments will experience collective excitations while the smallest particle moments will be superparamagnetic. The blocking temperature, T B , 3 which defines the transition from collective excitations to superparamagnetism, is difficult to determine with Mo¨ssbauer spectra unless a model 0163-1829/2001/63共6兲/064406共8兲/$15.00
which can describe spectra over the entire range of temperatures is used. A further complication arises from interparticle interactions,4 due to the inevitable difficulty in controlling particle dispersal. Usually of a dipolar nature, interparticle interactions will affect the energy necessary for moment flips and change T B . Lineshape modeling of Mo¨ssbauer spectra for the complete range of temperatures has had limited success. Only in the simplest case of a very dilute fine particle system with a narrow distribution of particle sizes, where interparticle interactions can be considered absent,4 have spectra been properly modeled. At intermediate temperatures spectra consist of a clear magnetic sextet with collapsed components which can be fitted with a linear combination of Mo” rup’s collective excitation model and a two-level relaxation model.5 This procedure yields appropriate values for T B and the anisotropy energy. When a sample contains a broad distribution of particle sizes, the above lineshape description fails. Attempts to model such spectra generally consist of combining a distribution of static hyperfine fields to describe the sextet component and a two-level relaxation model to fit the collapsed component. This is incorrect, as the sextet component of spectra contains information about magnetic relaxation. Furthermore, effects from phenomena such as particle anisotropy and different particle sizes are not accounted for. Failure of these models to correctly describe spectra is exhibited by the necessity for linewidth increases with temperature,6–8 an incorrect approach as it masks a characteristic mark of magnetic relaxation. T B cannot be correctly predicted, and the typical equal area definition for T B which consists of determining the temperature at which spectra appear composed of equal areas of static and collapsed components is used.3 This definition of T B is physically incorrect as it does not describe the magnetic moment behavior in the sample, and cannot incorporate the effects of either the particle size distributions or interparticle interactions. A more robust definition of T B is necessary for Mo¨ssbauer spectra to permit comparisons with different measuring techniques that exhibit different sensitivities to the particle size distribution. For example, magnetization is dominated by the response of the larger, slower particles, while the majority of the susceptibil-
63 064406-1
©2001 The American Physical Society
J. van LIEROP AND D. H. RYAN
PHYSICAL REVIEW B 63 064406
ity comes from particles close to their blocking temperature. We present a solution to the problem when interparticle interactions and a broad particle size distribution are present. The internal magnetic potential energy of a magnetic particle is described by the expression E⫽⫺KV cos2() where K is the anisotropy constant of the particle, V its volume and the angle between the easy axis of the particle and the direction of magnetization. The many level formalism of Jones and Srivastava9 is used as a starting point. This approach has seen little use to date as the computational effort required for the large matrix manipulations is substantial and has made least-squares fitting unattractive. With present generation computer hardware the problem is now tractable. We combine this many level formalism with a log-normal particle size distribution and an approximation to the analytic solution of the relaxation time ( ), valid for the full range of energy barriers encountered here.10 We are able to model the lineshape of spectra at all temperatures across the full range of behavior of single-domain particles. This model has allowed us to calculate relaxation rates and the anisotropy energy as well as unambiguously determine T B . Fits to spectra of two ferrofluids and a polysaccharide iron complex yield results in agreement with those from other techniques.
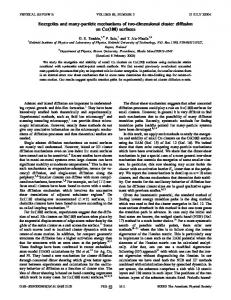
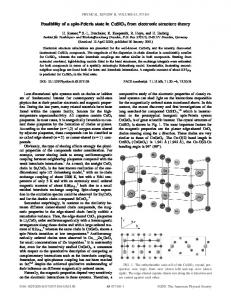
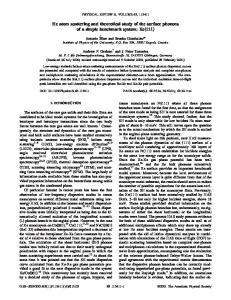
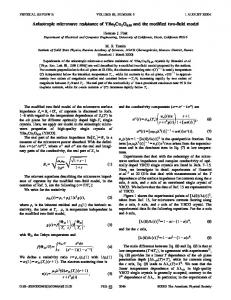
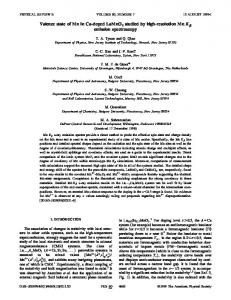
FIG. 1. Fits to the 4.5 nm Fe3 O4 ferrofluid using Mo” rup’s collective excitation description for low-temperature spectra and a two-level relaxation model for the high-temperature spectra. These models clearly fail to predict the lineshape of the intermediate temperature spectra.
II. EXPERIMENTAL METHODS
III. LINESHAPE MODELS
We have studied two commercial Fe3 O4 ferrofluids11 and an akagane´ite based polysaccharide-iron complex 共PIC兲 called Niferex.12 The ferrofluids were supplied with particle size distributions determined by electron microscopy which gave ln( D )⫽0.225 for the 6.0 nm ferrofluid and ln( D ) ⫽0.2 for the 4.5 nm ferrofluid. The PIC is a ferritin biomimic and is reported to have a mean particle size of 6.5 nm.13 ln( D )⫽0.3 was chosen, in agreement with previous studies,13 and allowed for consistent fits to the spectra. AC susceptibility ( ac ) data were collected using a Quantum Design Physical Properties Measurement System at temperatures from 2.5 to 300 K with driving frequencies of 10 and 100 Hz, and 1 and 10 kHz. An exponential dependence of the blocking temperature as a function of driving frequency was demonstrated and used to extrapolate blocking temperatures relevant to the Mo¨ssbauer effect measurement time of 10⫺8 s. Transmission Mo¨ssbauer measurements were done with a constant acceleration spectrometer using a 1 GBq 57CoRh source calibrated using ␣ Fe at room temperature. Spectra of the ferrofluids were collected using a closed cycle refrigeration system from 12 to 180 K. The upper temperature limit being set by the melting point of the carrier liquid. Spectra of the PIC were collected in the same closed cycle refrigeration system except for the 2, 5, 7, and 15 K spectra which were collected in a helium flow cryostat. The ferrofluid samples were left at room temperature for six months to determine if any changes would occur in the contents. The 4.5 nm ferrofluid particles was unaffected, but the 6.0 nm ferrofluid aged in some manner which caused visible clumping. Mo¨ssbauer and ac data were collected for this 6.0 nm aged ferrofluid to examine variations in its magnetic properties.
When describing magnetic fine particle systems, it is usually assumed that the particles are uniaxially anisotropic since even a small departure from sphericity will result in a strong uniaxial shape anisotropy.8 The internal magnetic potential energy of a particle’s average magnetic moment can then be described by the expression E⫽⫺KV cos2(). The moment oscillations during collective excitations can be viewed as the moment rocking in its potential well. Mo” rup1 modeled this behavior by assuming that the fluctuations around the easy axis occur much faster than the Larmor precession of the Mo¨ssbauer atoms. The probability of the moment being at an angle away from the easy axis is calculated, resulting in a correction to the magnetic hyperfine field. For the case of a uniaxially symmetric particle to be, this is:
冉
B obs ⫽B h f 1⫺
冊
kT , 2KV
共1兲
where B obs is the observed magnetic hyperfine field at the temperature T and B h f is the static magnetic hyperfine field. Combining this with a distribution of particle sizes, each with a different V, yields an effective hyperfine field distribution which successfully predicts low-temperature spectra of fine particle systems. The success of Mo” rup’s description of low-temperature fine particle Mo¨ssbauer spectra is shown in Fig. 1. With the log-normal particle size distribution of the 4.5 nm ferrofluid, 12, 20, and 25 K spectral lineshapes calculated with Eq. 共1兲 are in excellent agreement with experiment. Linewidths are constant, 0.42⫾0.02 mm/s, and B h f ⫽50.0⫾0.2 T is consistent with the accepted value for Fe3 O4 .4,14 K⫽3.3⫾0.2 ⫻104 J/m3 is in agreement with K of similar fine particle
064406-2
¨ SSBAUER SPECTRA OF SINGLE-DOMAIN FINE . . . MO
PHYSICAL REVIEW B 63 064406
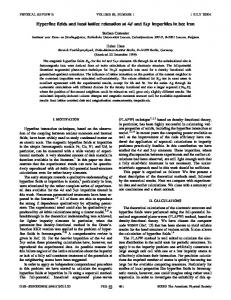
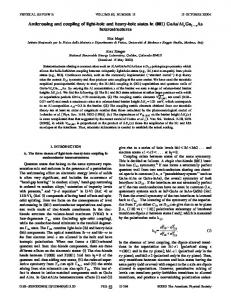
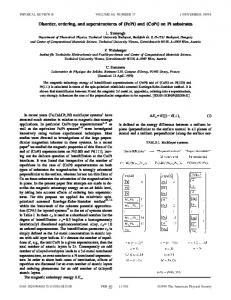
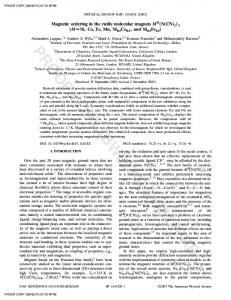
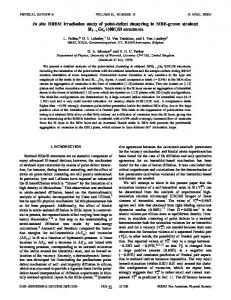
with a single domain particle’s moment not having a preferred orientation along its easy axis 共the potential barrier E is symmetric兲, so P 21⫽ P 21⬅ P and the total relaxation rate is R⫽ 12 P⫹ 21 P. P⫽ ⫽1/ with being the average time between moment flips. The wide range of particle sizes in a real system leads to a large spread in energy barriers. Spectrum modeling hinges upon the accurate calculation of the superparamagnetic relaxation rates through the relaxation time, . A valid expression of for all possible energy barriers is therefore critical. Typically, a relation along the lines of ⫽ 0 exp(␣) is used, where ␣ ⫽KV/kT and 0 essentially depends upon the gyromagnetic ratio and nonrelaxing magnetization.4,18 This approach is valid for ␣ Ⰷ2. However, at high temperatures 共or equivalently, for small particles兲, where the two-state model is appropriate, ␣ is less than 2.4 Using an invalid expression for will result in an incorrect assessment of K and improperly scales the relaxation times for particles at the extremes of the size distribution. Coffey et al.10 have determined an expression for the relaxation time FIG. 2. Results of fits of the 4.5 nm Fe3 O4 ferrofluid using Mo” rup’s collective excitation description (䉮), a two-level relaxation model (䉭), and our multilevel formalism (䊐). Relaxation rates, , were averaged over the log-normal particle size distribution.
systems15–17 and a more complete lineshape model.14 Above 25 K, this simple description fails since collective excitations are no longer the only magnetic fluctuation present. A central, nonmagnetic, component develops that cannot be described by the collective excitation model. Furthermore, there are increases in both the fitted linewidth 共shown in Fig. 2 by the 䉮) and B h f , and a decrease of K. At high temperatures, where KVⰆkT and rapid reversals of the magnetic moment occur, spectra are usually modeled using a stochastic two level lineshape formalism, such as the one by Blume and Tjon.2 The levels represent the two possible orientations that the moment can make with respect to the easy axis 共i.e., 0° and 180°). The transition probabilities per unit time per unit occupation between the two levels are P 12 and P 21 where P 12 denotes the transition from level one to level two and P 21 the transition from level two to level one. ⌫ is the natural linewidth, the energy of the incoming ␥ ray and ⫾ ␦ the energies of the two levels 共determined from B h f ). We can use the well known lineshape expression2
冋
I 共 兲 ⫽2R
ı 共 ⬘ ⫹ ␦ 兲 ⫹2R 共 ␦ ⫺ ⬘ 2 兲 ⫹2R 共 ⬘ ⫺ ␦ 兲 2
册
,
共2兲
where ⬘ ⫽ ⫺ı⌫, ⫽( P 21⫺ P 12)/( P 21⫹ P 12) and 2R ⫽ P 12⫹ P 21 . The real component of the expression is used to predict spectra exhibiting simple moment reversals. There is an equal probability of the moment being oriented in either a 0° or 180° manner with respect to the easy axis, so the superparamagnetic relaxation rate 共i.e., the product of the transition probability per unit time and the occupation probability兲 between level one and two is 21 P 12 , and between level two and one is 21 P 21 . This assumption is consistent
⫽0
1 4␣
␣ ␣ ⫹1
冑
1
␣
关 exp共 ␣ 兲 ⫺1 兴 ,
共3兲
⫹2 ⫺ ␣ ⫺1
with 0 ⬀VM s where M s is the saturation magnetization. This expression is valid to within a few percent of the exact analytic solution,4 for any value of ␣ . It ensures that a correct for each particle size is calculated and a consistent K is determined for each temperature when modeling data. The two-level formalism with a log-normal particle size distribution and given by Eq. 共3兲 with E⫽⫺KV cos2() results in an adequate description of the 180 and 140 K 4.5 nm ferrofluid spectra, shown in Fig. 1. Fitted results in Fig. 2 show that the linewidths 共denoted by 䉭) are reasonably consistent and the expected decrease of relaxation rate with temperature occurs. For the highest-temperature spectra it was necessary to fix the zero-temperature hyperfine field to 50 T to avoid cross-correlations between the least-squares fitted relaxation rate, linewidth, and hyperfine field. K could not be fit reliably and was fixed at 3.0⫻104 J/m3 . The fit quality quickly deteriorates on cooling as a static component develops 共notice the arrows displaying the missed components of the experimental 100 K spectrum in Fig. 1兲 and it was necessary to let B h f and K vary to fit the experimental spectra. Linewidths increase, with K and B h f changing by as much at 50% to fit the spectra. As T B is approached, the fitted relaxation rate increases in stark contrast with the actual slowing of the relaxation rate. This simple two-level model cannot predict the magnetic behavior of a fine particle system at intermediate temperatures. At intermediate temperatures, moments no longer undergo simple 180° flips, but experience a variety of orientation changes. The many-level representation of Jones and Srivastava9 offers the best way to model the complex dynamic behavior of single-domain particles. Computer hardware readily available at the time of their publication was not powerful enough for convenient least-squares fitting using
064406-3
J. van LIEROP AND D. H. RYAN
PHYSICAL REVIEW B 63 064406
with 2 ␦ the magnetic hyperfine splitting between line pairs. The occupation probabilities of the levels W i and transition probabilities per unit time between levels P i j are necessary to solve Eq. 共4兲. The equilibrium populations can be described using a Boltzmann distribution, W k ⫽exp(⫺Ek /kT) so that detailed balance is conserved, and we discretize the potential barrier describing the uniaxial particle with E k ⫽⫺KV cos2(k). M is given by: M kk ⫽ı 共 ⫺ k 兲 ⫹⌫⫺M kk⫺1 ⫹M kk⫹1
共6兲
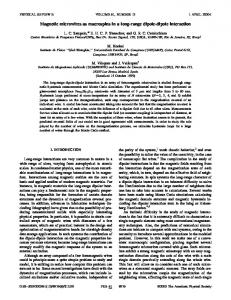
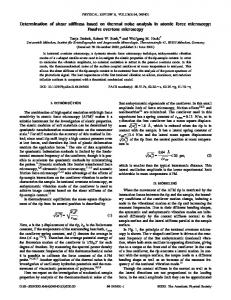
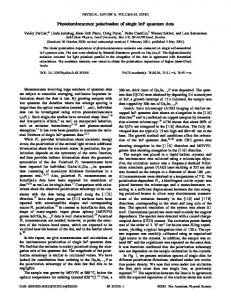
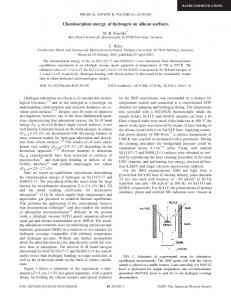
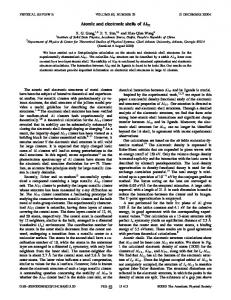
with FIG. 3. Energy level transitions and the corresponding spectra line number associated with them. The line pairs which Sack’s formalism depends upon are 1 and 6, 2 and 5, and 3 and 4.
this approach. Increases in processor power over the last few years allow for reasonable computation times for fitting spectra. This many-level model fully describes the effects of the various tilt angles that the moment can make. Collective excitations, interparticle interactions and superparamagnetism are described within a single formalism.19 Sack’s20 simplification of Anderson’s21 stochastic quantum mechanical model is used as a starting point: I 共 兲 ⫽2R共 WM ⫺1 1ជ 兲 .
共4兲
It is assumed that the nuclear states are constant and the relaxation problem can be solved separately for each line pair, i.e., transitions from 兩 I 1 m 1 典 to 兩 I 0 m 0 典 where I 1 ⫽ 23 and I 0 ⫽ 21 , displayed schematically in Fig. 3. The N components of the row vector W are proportional to the occupation probabilities of the states in equilibrium, 1ជ is a column vector with all its components equal to unity and M⫽(ı ⫹⌫)I ⫺ı⍀⫺⌸ is the matrix which contains the physical description of the system. This description involves the line positions in the absence of relaxation, i , which are components of the diagonal matrix ⍀, and the natural linewidth ⌫. The transition probability per unit time per unit occupation of state i, from state i to state j is given by ⌸ i j ⫽ P i j , ⌸ ii ⫽⫺ 兺 j P i j (i⫽ j). For a two-level system, this gives:
冋冋
共 P 21 , P 12兲 I 共 兲 ⫽2R P 12⫹ P 21
⫻
冋
册
ı 共 ⫺ ␦ 兲 ⫹ P 12⫹⌫
⫺ P 21
⫺ P 21
ı 共 ⫹ ␦ 兲 ⫹ P 21⫹⌫
册 冋 册册 ⫺1
1 1
共5兲 and solving yields Eq. 共2兲. This formalism can be extended to characterize the many orientations that the moment of a single-domain particle may take when it is thermally agitated at intermediate temperatures. Consider a particle to have S possible orientations. The possible angles between 0° and 180° are expressed by k steps from one to (2S⫹1) so k ⫽ 2 (k⫺S⫺1/S) 2 . The magnetic hyperfine field distribution of Mo” rup’s model is emulated by the resulting line positions k ⫽(S⫺k⫹1) ␦ /S
M kk⫹1 ⫽⫺ P kk⫹1 关 exp共 ⫺⌬E/kT 兲兴
k⬍ 共 2S⫹1 兲 /2 共7兲
M kk⫺1 ⫽⫺ P kk⫺1 关 exp共 ⫺⌬E/kT 兲兴
k⭓ 共 2S⫹1 兲 /2, 共8兲
where the Boltzmann factor is used only for a step ‘‘up’’ to a higher-energy level during the random walk of the magnetization vector. Also ⌬E⫽E k ⫺E k⫾1 and P kk⫹1 ⫽R 关 S 共 S⫹1 兲 ⫺ 共 k⫺S⫺1 兲共 k⫹S 兲兴
k⬍ 共 2S⫹1 兲 /2 共9兲
P kk⫺1 ⫽R 关 S 共 S⫹1 兲 ⫺ 共 k⫺S⫺1 兲共 k⫹S⫺2 兲兴 k⭓ 共 2S⫹1 兲 /2,
共10兲
where R is the relaxation rate between levels. Equation 4 is then solved with inversion of M necessary for each in the simulated spectrum. The moment relaxation rate must be carefully defined in contrast to the simple two-level situation. There are multiple angles to which the moment can relax to and from, instead of just 0° and 180°, so the minimum and maximum orientation change of the moment during the relaxation process must be defined. In this case, the relaxation rate is the product of the occupation probability of the particle’s initial level before the orientation change occurs and the transition probability per unit time between the two levels. This rate must be summed for all components of the random walk from initial to final orientation. For example, the average 180° flip rate is given by: 2S
⫽
兺 W i P i j / 共 2S⫹1 兲 .
i⫽1
共11兲
To complete the model, a distribution of particle sizes and an expression for the fluctuation rate between moment orientations, R, is necessary. Our description of a magnetic fine particle system assumed a log-normal particle size distribution. We used Eq. 共3兲 for R. With a least-squares fitting routine the following parameters were used to fit spectra: Baseline, ⌫, intensity, B h f , isomer shift, 0 and K. Figure 2 shows that, at high temperatures, our model generates the same behavior as the two-level formalism, while at low temperatures, collective excitations are correctly described. IV. RESULTS AND DISCUSSION
ac vs T for the Fe3 O4 ferrofluids is shown in Fig. 4 for various measuring frequencies. Similar results were obtained
064406-4
¨ SSBAUER SPECTRA OF SINGLE-DOMAIN FINE . . . MO
PHYSICAL REVIEW B 63 064406
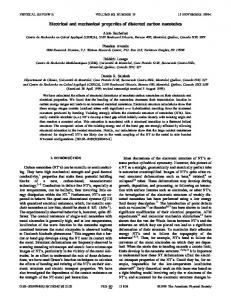
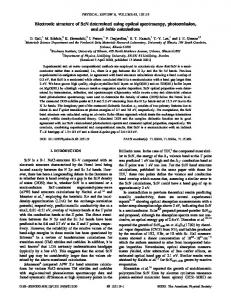
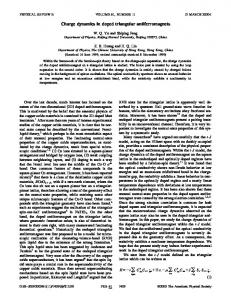
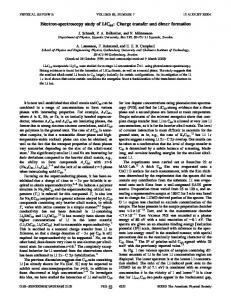
FIG. 4. Thermal variation of ac vs frequency for the Fe3 O4 ferrofluids. This behavior is scaled with the saturation magnetization established for each sample, ensuring that these results exhibit the magnetic behavior of the iron in the particles. Note the substantial reduction in signal caused by aging of the 6 nm sample. Driving frequencies of 10, 100, 1000, and 10 000 Hz were used to track the frequency dependence of the blocking temperature 共summarized in Fig. 5兲.
with the PIC. For a given frequency, ac (T) exhibits a maximum at T B when the superparamagnetic moment flip rate coincides with the driving frequency of the measurement. The broad peak in ac reflects the distribution of particle sizes in the ferrofluids. The ferrofluid with the smaller mean particle sized exhibits a lower T B as the barrier to moment reversal, set by KV, is overcome at a lower temperature. Data for the aged 6.0 nm ferrofluid exhibit a substantial reduction in amplitude and a shift in T B to lower temperatures. Experimental results22 and Monte Carlo simulations23 indicate that increasing interparticle interaction strength causes a lowering of T B and a strong suppression of ac . In addition, the frequency dependence of T B is reduced. Thus the aginginduced changes in the 6.0 nm ferrofluid are fully consistent with increased interparticle interactions associated with the visible clumping that had occurred. The variation of T B with measurement frequency for the ac data is shown in Fig. 5, where the exponential behavior is clear in this log-linear plot. In every case, the commonlyapplied equal-area criterion over estimates T B . This error is most serious for the PIC where T B is high by a factor of 6. The PIC has the widest particle size distribution of those studied here, and therefore exhibits mixed behavior over the widest temperature range. It is the failure to include the full range of relaxation behavior that ultimately makes equal-area definitions invalid. Our model correctly describes the small superparamagnetic component of the particle size distribution at T B for the PIC, ensuring consistent fits through the whole temperature range, and provides excellent agreement with the ac results.
FIG. 5. Plots of T B vs measurement frequency for the ac measurements and Mo¨ssbauer many-level model. Notice the poor agreement of the equal area criteria, especially for the PIC.
Mo¨ssbauer spectra collected for the different samples are in Fig. 6, the 4.5 nm ferrofluid; Fig. 7, the 6.0 nm as-received ferrofluid; Fig. 8, the 6.0 nm aged ferrofluid; and in Fig. 9, the PIC. For the ferrofluids, once the carrier liquid has frozen at around 200 K, the easy axis of each particle is frozen in a random direction. The PIC is a powder sample ensuring a random orientation for the easy axes of the particles at any temperature. For all samples at high temperatures a collapsed lineshape with essentially zero hyperfine field is observed. All of the samples are superparamagnetic and are above T B at this point. On cooling, the flip rates of largest particles slow first and a sextet component develops in the spectra. Next, the moment flip rates of smaller particles slow and a broad sextet becomes more distinct with line asymmetry from collective excitations appearing. Finally, at the lowest temperatures, less line asymmetry from collective excitations
064406-5
FIG. 6. Mo¨ssbauer spectra of the 4.5 nm Fe3 O4 ferrofluid.
J. van LIEROP AND D. H. RYAN
PHYSICAL REVIEW B 63 064406
FIG. 7. Mo¨ssbauer spectra of the 6.0 nm Fe3 O4 ferrofluid.
occurs as moments become fully blocked. The coexistence of sextet and central components in the spectra over a large range of temperatures is unlike the swift collapse within a small temperature range seen in paramagnetic to ferromagnetic phase transitions.4 25 levels were used in our model to fit the ferrofluid spectra and 36 levels for the PIC. Fewer levels would not describe the spectra consistently for all temperatures and more levels simply increased the computation time for leastsquares fits. Table I contains some of the fitted parameters for the spectra. The hyperfine field was a fitted parameter for low-temperature spectra. As relaxation effects became dominant, the field was fixed at 50 T to reduce the effects of correlations between hyperfine field, linewidth and relaxation rate. The validity of our description is clearly visible in Figs. 6, 7, and 8. The model is able to reproduce the lineshape of the
FIG. 8. Mo¨ssbauer spectra of the aged 6.0 nm Fe3 O4 ferrofluid.
FIG. 9. Mo¨ssbauer spectra of the polysaccharide iron complex 共PIC兲. Our present model cannot predict the quadrapole doublet in the PIC and begins to fail around 30 K.
samples at all temperatures with small variations in the linewidth (⌫) and K. A consistent ⌫ when fitting using any magnetic relaxation formalism is crucial. Line broadening in a spectrum should be reflected by an increase in and not incorrectly compensated for by ⌫. The paramagnetic spectrum of the akagane´ite in the PIC exhibits a significant quadrapole splitting which cannot readily be included in our model. As a result, we were unable to fit the PIC spectra above 30 K 共Fig. 9兲. The model correctly tracks the size of the central component with a singlet, and is simply unable to provide a doublet. Our present formalism assumes that the nuclear Hamiltonian which is fluctuating from moment oscillations commutes with itself at different times. To properly predict the lineshape of the PIC, a much more complex formalism needs to be devised which involves Liouville superoperators for solving the combined stochastic-quantum mechanical problem.24 We did not fit PIC spectra above 30 K due to this shortcoming. Fitted values for 0 and K are shown in Fig. 10, and extrapolated 180° moment flip rates in Fig. 11. Values of K are in agreement with similar magnetic fine particle systems15–17 and PIC.13 The lower value for K in the asreceived 6.0 nm ferrofluid with respect to the 4.5 nm ferrofluid indicates stronger interparticle interactions.4,25 In general, stronger interparticle interactions are expected in systems with broader particle size distributions. The variation in K between the 4.5 and 6.0 nm ferrofluid is compatible with this analysis. The further lowering of both K and T B on aging the 6.0 nm ferrofluid is also consistent with increased interparticle interactions, and expected from the visible clumping of the sample. These effects were also deduced above from the ac data. The temperature at which superparamagnetic relaxation begins, i.e., when 0 ⬎0, established T B for the Mo¨ssbauer spectra and is listed in Table I for the various samples. Comparison of these values with our ac data, shown in Fig. 5,
064406-6
¨ SSBAUER SPECTRA OF SINGLE-DOMAIN FINE . . . MO
PHYSICAL REVIEW B 63 064406
TABLE I. Summary of the fitted parameters, ⌫, B h f , and K for the samples examined with our multiplelevel model. T B is established when 0 ⬎0 共see Fig. 10兲. Sample 4.5 nm ferrofluid 6.0 nm as-received ferrofluid 6.0 nm aged ferrofluid PIC
⌫ 共mm/s兲
B h f 共T兲
K(⫻104 J/m3 )
T B 共K兲
0.438⫾0.020 0.403⫾0.024 0.409⫾0.006 0.339⫾0.008
50.02⫾0.06 50.04⫾0.08 50.1⫾0.2 49.99⫾0.06
3.0⫾0.1 2.4⫾0.2 1.9⫾0.2 1.12⫾0.23
30⫾5 55⫾5 50⫾5 10⫾2
clearly demonstrates that T B derived from our model of the Mo¨ssbauer spectra is fully consistent with other probes of magnetic relaxation. Effects of interparticle interactions are again evident with the lowered value of T B of the aged 6.0 nm ferrofluid compared to the as-received 6.0 nm ferrofluid.3 Since 0 ⬀1/VM s , 18 and M s has been shown to exhibit a weak temperature dependence,4,26 the often used assumption of a constant 0 共Ref. 26兲 is not strictly valid. We therefore treated 0 as a fitted parameter. 0 remained reasonably constant for a given sample across the range of temperatures, shown in Fig. 10. A lower 0 for the 4.5 nm ferrofluid compared with the 6.0 nm ferrofluid is consistent with an increased M s for smaller particles.22 The slight reduction in 0 for the 6.0 nm ferrofluid on aging is consistent the an increase in M s due to interparticle interactions.13,22 The average moment flip rates for the spectra are plotted as a function of temperature in Fig. 11. The usual decrease of with temperature is observed, typical of magnetic relaxation. An increase of with stronger interparticle interactions between the 6.0 nm as-received and 6.0 nm aged ferrofluids is consistent with previous magnetization and ac studies.4,25 Confirmation of these moment flip rates from our model was provided by Selective Excitation Double Mo¨ss-
FIG. 10. Plots of the pre-exponential factor of the relaxation time 0 and the anisotropy energy K. T B is the point where 0 ⬎0.
bauer 共SEDM兲 measurements on the 4.5 nm and aged 6.0 nm ferrofluid.27 SEDM allows the effects of static disorder,28 collective excitations and moment reversals to be unambiguously separated, with superparamagnetic relaxation frequencies being determined independently of theoretical expressions for the relaxation time . Moment flip rates from the distribution generated with our model which are within the time scale of the SEDM measurement, accurately model the SEDM data.27 V. CONCLUSIONS
We have developed a complete model of magnetic singledomain fine particle systems which correctly predicts the behavior of Mo¨ssbauer spectra over the complete range of temperatures. Applying this model to two ferrofluids and a polysaccharide iron complex, we were able to extract consistent values for K, lying in the expected range of 104 J/m3 , determine the moment rotation rates from angles in the interval of 0° to 180° 共allowing us to compare our results with those of simpler two-level models and collective excitations兲 and assess the blocking temperature, T B . Our analysis of the Mo¨ssbauer spectra is in agreement with our ac (T B ) and SEDM ( ) results. For temperatures higher than T B , relaxation rates used to described the spectra fall in the typical
FIG. 11. 180° moment flip relaxation rates extrapolated from the many state model 共normalized with respect to the log-normal size distribution兲. The expected gradual increase of flip rate with temperature for a superparamagnetic system is present.
064406-7
J. van LIEROP AND D. H. RYAN
PHYSICAL REVIEW B 63 064406
time region of ⫽10⫺8 –10⫺9 s. The trends exhibited for T B , K, 0 , and due to interparticle interactions and differing particle sizes and surroundings are in agreement with previous experimental and theoretical work. Specifically, we have measured a decreased K, T B , and 0 , as well as an increased 180° moment flip rate ( ), in an aged Fe3O4 ferrofluid due to an increase in interparticle interactions.
S. Mo” rup, J. Magn. Magn. Mater. 37, 39 共1983兲. M. Blume and J.A. Tjon, Phys. Rev. B 33, 7421 共1968兲. 3 E. Tronc, P. Prene´, J.P. Jolivet, F. D’Orazio, F. Lucari, D. Fiorani, M. Godinho, R. Cherkaoui, M. Nogues, and J.L. Dormann, Hyperfine Interact. 95, 129 共1995兲. 4 J.L. Dormann, D. Fiorani, and E. Tronc, in Advances in Chemical Physics, edited by I. Prigogine and Stuart A. Rice 共John Wiley & Sons, Inc., New York, 1997兲, p. 283. 5 F. Bødker, M. Hansen, C.B. Koch, K. Lefmann, and S. Mo” rup, Phys. Rev. B 61, 6826 共2000兲. 6 B. Ganguly, F.E. Huggins, K.R.P.M. Rao, and G.P. Huffman, J. Catal. 142, 552 共1993兲. 7 N.M.K. Reid, D.P.E. Dickson, and D.H. Jones, Hyperfine Interact. 56, 1487 共1990兲. 8 A. Tari, J. Popplewell, S.W. Charles, D. St.P. Bunbruy, and K.M. Alves, J. Appl. Phys. 54, 3351 共1983兲. 9 D.H. Jones and K.K.P. Srivastava, Phys. Rev. B 34, 7542 共1986兲. 10 W.T. Coffey, P.J. Cregg, D.S.F. Crothers, J.T. Waldron, and A.W. Wickstead, J. Magn. Magn. Mater. 131, L301 共1994兲. 11 Ferrofluidics Corporation, 40 Simon Street Nashua, NH, USA, 03061. 12 Schwarz Pharma, Inc., Milwaukee, WI, USA, 53201. 13 M.-E.Y. Mohie-Eldin, R.B. Frankel, L. Gunther, and G.C. Papaefthymiou, Hyperfine Interact. 96, 111 共1995兲. 14 J. van Lierop and D.H. Ryan, J. Appl. Phys. 87, 6277 共2000兲. 1 2
ACKNOWLEDGMENTS
This work was supported by grants from the Natural Sciences and Engineering Research Council of Canada and Fonds pour la formation de chercheurs et l’aide a` la recherche, Que´bec.
15
D.B. Lambrick, S.R. Hoon, N. Mason, and M. Kilner, IEEE Trans. Magn. 24, 1647 共1988兲. 16 N.Y. Ayoub, R.Y. Abdelal, R.W. Chantrell, J. Popplewell, and K. O’Grady, J. Magn. Magn. Mater. 79, 81 共1989兲. 17 C. Johansson, M. Hanson, M.S. Pedersen, and S. Mo” rup, J. Magn. Magn. Mater. 173, 5 共1997兲. 18 W.T. Coffey, D.S.F. Crothers, Yu.P. Kalmykov, E.S. Massawe, and J.T. Waldron, Phys. Rev. E 49, 1869 共1994兲. 19 D.H. Jones and K.K.P. Srivastava, J. Magn. Magn. Mater. 78, 320 共1989兲. 20 R.A. Sack, Mol. Phys. 1, 163 共1958兲. 21 P.W. Anderson, J. Phys. Soc. Jpn. 9, 316 共1954兲. 22 J.L. Dormann, F. D’Orazio, F. Lucari, E. Tronc, P. Prene´, J.P. Jolivet, D. Fiorani, R. Cherkaoui, and M. Nogue´s, Phys. Rev. B 53, 14 291 共1996兲. 23 J.-O. Andersson, C. Djurbert, T. Jonsson, P. Svedlindh, and P. Nordblad, Phys. Rev. B 56, 13 983 共1997兲. 24 M.J. Clauser and M. Blume, Phys. Rev. B 3, 583 共1971兲. 25 M.F. Hansen and S. Mo” rup, J. Magn. Magn. Mater. 184, 262 共1998兲. 26 J.L. Dormann, L. Spinu, E. Tronc, J.P. Jolivet, F. Lucari, F. D’Orazio, and D. Fiorani, J. Magn. Magn. Mater. 183, L255 共1998兲. 27 J. van Lierop and D.H. Ryan, Phys. Rev. Lett. 85, 3021 共2000兲. 28 J. van Lierop and D.H. Ryan, J. Appl. Phys. 85, 4518 共1999兲.
064406-8