R eview For reprint orders, please contact
[email protected]
Validation and verification of measurement methods in clinical chemistry The present overview of validation and verification procedures in clinical chemistry focuses on the use of harmonized concepts and nomenclature, fitness-for-purpose evaluations and procedures for minimizing overall measurement and diagnostic uncertainty. The need for mutually accepted validation procedures in all fields of bioanalysis becomes obvious when they implement international accreditation and certification standards or their equivalents. The guide on bioanalytical method validation published by the US FDA in 2001 represents a sensible compromise between thoroughness and cost–effectiveness. Lacking comprehensive international agreements in the field, this document has also been successfully adapted in other fields of bioanalysis. European and international efforts aiming for consensus in the entire field of bioanalysis are currently being made. Manufacturers of highly automated in vitro diagnostic methods provide the majority of measurement methods used in unmodified in clinical chemistry. Validated by the manufacturers for their intended use and fitness-for-purpose, they need to be verified in the circumstances of the end-users. As yet, there is unfortunately no general agreement on the extent of the verification procedures needed.
Validation and verification of measurement methods are procedures that aim to establish realistic expectations with the analyst and confidence with the end-user that the methods are fit for their intended purposes. Different fields of bioanalysis have historically lacked a common theoretical and practical ground due not only to differences in the tasks at hand, but also to differences in terminology and in calibration, validation and quality control practices. Recent harmonization efforts in these areas [1,101,102] confirm that all fields of bioanalysis can share the same principles and nomenclature catering for extensive harmonization of guidelines, standards and practices. In the early 1990s, the US FDA initiated and supported conferences and harmonization work on bioanalytical method validation [2,3] that, in 2001, resulted in the ‘FDA Guidance for Industry – Bioanalytical Method Validation’ guidelines [4,101] . They have been widely used, being suitable not only for the needs of the pharmaceutical industry but also for bioanalytical methods in general [4] . In fact, lacking similar international guidelines, this FDA document is widely used as standard reference for validation of bioanalytical measurement methods. European efforts in the field of validation (European Medicines Agency’s Guidelines on Validation of Bioanalytical Methods) [5] are currently in progress.
The pharmaceutical industry has been and is still a driving force in the development of validation practices given the regulatory environment they have been subject to early on. Clinical laboratories are increasingly being accredited or certified according to ISO 17025, ISO 15189 or other similar quality systems. These laboratories are therefore in need of generally accepted and costeffective protocols for validation. Theoretically, there are no limits to the extent of validation and verification procedures. However, in practice, there are time and economic constraints. It is therefore crucial that validation and verification efforts are optimized in order to maximize the value gained for the resources spent. This brief overview of validation and verification methodologies in clinical chemistry attempts to adhere to the currently accepted guidelines in terminology and bioanalytical validation methodologies. The probable overemphasis on certain aspects, for example, on verification procedures and fitness-for-purpose investigations, may be explained by the authors’ background in laboratory medicine and basic research. The current already extensive and increasing use of commercially available measurement instruments and methods underscores the need for agreement on reasonable, but sufficient, methods for end-user verification of the manufacturer’s performance claims.
10.4155/BIO.11.311 © Elvar Theodorsson
Bioanalysis (2012) 4(3), 305–320
Elvar Theodorsson Clinical Chemistry, Department of Clinical & Experimental Medicine, Faculty of Health Sciences, Linköping University, County Council of Östergötland, Linköping, Sweden Author for correspondence: Tel.: +46 1328 6720 Fax: +46 1010 33240 E-mail:
[email protected]
ISSN 1757-6180
305
R eview |
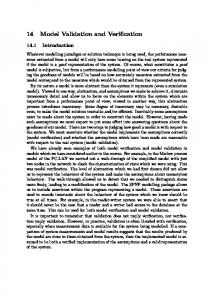
Theodorsson Terminology Bioanalytical method validation procedures are used to test whether methods for measuring concentrations of measurands in biological matrices are accurate and fit for the intended purpose. Bioanalytical verification procedures test whether the performance data obtained by manufacturers during method validation can be reproduced in the environment of an end-user. Validation and verification of measurement methods depend on detailed procedures written using well-defined and generally accepted concepts and terms. The results of the validation and verification efforts also need to be summarised using concepts and terms understood by all in the same way. Lack of harmonization in terminology has hampered development in these fields for a long time [6] , but the results of pain staking international work are slowly but surely gaining wide acceptance [102–104] . Amongst the most important terminology concepts are the ones describing measurement error, uncertainty and their components. Menditto et al. recently published a figure reproduced below (Figure 1) , which summarizes the main concepts used in method validation and verification in an intuitive manner in full harmony with the internationally accepted nomenclature [7,102] . The total error consists both of random and systematic components. These two error components can be described qualitatively as precision and accuracy, respectively, and measured/expressed quantitatively as SD and bias.
Measurement trueness is a qualitative concept, the ‘closeness of agreement between the average of an infinite number of replicate measured quantity values and a reference quantity value’ [102] . Trueness is thus inversely related to the measurement bias and a measure of systematic error. Measurement accuracy is a qualitative concept describing the “closeness of agreement between a measured quantity value and a true quantity value of a measurand” [102]. It encompasses both systematic and random error components. A measurement is more accurate when it offers a smaller measurement error, more true when the bias is small and more precise when the random error is small. Precision is a qualitative concept and can only be expressed quantitatively as its opposite – imprecision. The SD is commonly expressed as relative SD/CV. CV% = c SD m # 100 x Equation 1
Its advantage over the SD is that its size is corrected for the position of the values on the measurement scale. When the measurement uncertainty is the same when measuring on the scale around 100 as on scale around 10, the SD is much higher when measuring around 100. This is compensated for in the coefficient of variation by dividing the SD by the mean ( x ). Measurement uncertainty is a quantitative expression of the measurement quality. Its
Type of errors
Performance characteristics
Quantitative expression of performance characteristics
Systematic error
Trueness
Bias
(Total) error
Accuracy
Measurement uncertainty
Random error
Precision
Standard deviation (repeatability, reproducibility)
Figure 1. Qualitative and quantitative expressions of the type of error and their combination. Since bias should be eliminated whenever possible, a dotted line is drawn between it and measurement uncertainty. Adapted with permission from [7] © Springer Science+Business Media.
306
Bioanalysis (2012) 4(3)
future science group
Validation & verification of measurement methods in clinical chemistry
Temperature Reaction cell
| R eview
Lot-number changes Sample
Calibration
Reagent
Matrix effects Measurement uncertainty
Different meaurement instruments Different measurement principles
Education level Length of employment
Laboratory
Operator
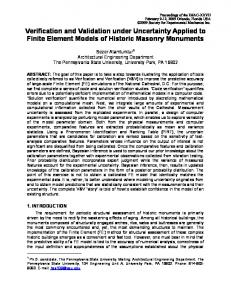
Figure 2. Fishbone/cause and effect/Ischikawa diagram depicting common causes of measurement uncertainty in laboratory medicine. Some of the components can be controlled (e.g., the temperature) whereas, for example, bias due to lot-to-lot variation resulting from production processes of the manufacturer cannot be controlled by the end-user laboratory.
components can be measured and/or estimated and added according to general rules for error calculation [105] . The uncertainty concept published in 1993 as the ‘Guide to the expression of uncertainty in measurement’ (GUM) [105] was the result of many years of dispute and deliberations under the auspices of several international organizations and replaces the former ‘error’ concept. The components of variation are preferably depicted as fishbone/cause and effect/Ischikawa diagrams (Figure 2) . Adding the contributions of individual components of variation are appropriate when the components are well known and when their individual contribution to the overall measurement uncertainty can be measured (bottom-up approach). In laboratory medicine, measurement instruments and reagents are commonly designed by the manufacturers as ‘black boxes’ precluding the end-user controlling or measuring individual components influencing the measurement process. In these cases the end-user cannot measure the individual components of measurement uncertainty independently, and is unable to add them using the bottom-up approach. A top-down approach for estimation of measurement uncertainty can be used in this case and is also endorsed by GUM [105] . It measures the combination of the individual components of variation using a stable control material and can elucidate its individual components using classical principles of experimental design and variance component analysis. The same batch of a stable control material is measured daily or several times daily over long periods of time, commonly in the order of 2 years, and measurement uncertainty estimated using analysis of variance future science group
or variance component analysis of the data. The top-down approach can identify components of variation caused by different laboratories in the same organisation, different measurement instruments, different chemical principles in measurement, different reagent lots, and so forth. Validation or verification? According to International Vocabulary of Metrology 3 (VIM3), verification is ‘provision of objective evidence that a given item fulfils specified requirements’ [102] and validation is ‘verification, where the specified requirements are adequate for the intended use’ [102] . If the method (reagents, procedure and the measurement instrument) is manufactured by a company or other reliable source that has performed proper method validation and who is providing you with the detailed results, a single laboratory method validation is not needed. Method verification as described below is then appropriate. Validation of measurement methods Method validation is a specific kind of validation “the process of defining an analytical requirement, and confirming that the method under consideration has performance capabilities consistent with what the application requires” [106] . Method validation includes procedures that both establish the performance characteristics and limitations of a measurement method (e.g., trueness, precision, recovery, linearity, robustness) and establish whether the performance characteristics of the measurement method being investigated are fit for the intended purpose [8,9,106] . Method validation is performed to a varying extent depending on its intended use. Single laboratory method validation [10] is appropriate www.future-science.com
Key Term Method verification:
Procedures to test to what extent the performance data obtained by manufacturers during method validation can be reproduced in the environments of end-users.
307
R eview |
Theodorsson
Key Term Full method validation:
Consists of both a technical part and fit-for-purpose studies.
where the method is used for a specific purpose in a specific laboratory by personnel with the appropriate training. Full method validation includes, in addition to the procedures employed in single laboratory validation, an interlaboratory study (collaborative study/collaborative trial), which usually includes in the order of ten laboratories with many measurement instruments, several operators and so forth. The performance characteristics of the measurement method over extended periods of time are also studied in full method validation, including the effects of lot-to-lot variation. Several national and international organisations have published general guidelines on method validation [3,4,6,11–37,101,106–114] and specific literature are available in analytical chemistry [18,19,21,38–40] , toxicology [41] , clinical chemistry/pathology [42–50,115,116] , the food industry [10,50,51] and the pharmaceutical industry [52–57] . Results of measurements of biomarkers regulated by ISO 17025, ISO 15189 or by CLIA [117] can and are extensively used in the development of pharmaceuticals. Single
laboratory method validation Single laboratory method validation is appropriate when the method is to be used in a single laboratory for a well-defined group of customers who are using the particular laboratory and measurement method and no other. Single laboratory method validation is appropriate in the pharmaceutical industry where a single laboratory and method is used for measuring all samples in a specified study, or in research laboratories where a single laboratory and method is used for the same study. In healthcare, the samples from a patient are, over time, likely to be measured in different laboratories using different methods as the patient visits primary care and different levels of hospital care. In this case, full validation of all the methods a patient is likely to encounter is crucial, including efforts to minimize measurement uncertainty, in particular the effects of bias, which usually is by far the major component contributing to measurement uncertainty. If this not feasible, samples from the same patient should be measured using the same measurement method and measurement instrument over time using reference intervals established for that particular method. The basic prerequisites for method validation
Before initiating method validation the following prerequisites should be fulfilled: 308
Bioanalysis (2012) 4(3)
The method should be fully developed and optimized;
n
A written standard operating procedure for the method should be available;
n
The measurement instruments to be used should be regularly technically controlled and well maintained;
n
The persons performing the measurements should have sufficient training and experience for the task;
n
Appropriate calibrators should be available and a supply (for at least 1 year) of suitable stable materials (for at least two concentration levels) for internal quality control purposes;
n
The needs of the end user regarding fit-forpurpose of the method should be known.
n
Measurement precision
Measurement precision is the “closeness between indications or measured quantity values obtained by replicate measurements on the same or similar objects under the specified conditions of measurement” [102] . The quantitative expression of precision is the SD or CV/CV%. The SD of the estimate of the SD is: SDs = 0.71 # SD N
Equation 2
and is thus inversely proportional to the square root of the number of replicates. Furthermore, the computed SD (even when using N-1 in the denominator – the Bessel’s correction) underestimates the true population SD, especially when the number of observations in the sample is low [58] . Therefore a ‘c4 correction’ [118] is appropriate when estimating the population SD from small samples. When N = 2 the SD is too low by approximately 20%, when N = 10 it is low by approximately 3%, and only low by approximately 2% when N = 15. Measurement precision falls into one of the following three following types: repeatability, intermediate measurement precision and measurement reproducibility. Repeatability precision
Repeatability measurement precision is estimated when ‘the same measurement procedure, same operators, same measuring system, same operating conditions and same location, and future science group
Validation & verification of measurement methods in clinical chemistry replicate measurements on the same or similar objects over a short period of time’ [102] are used. A short period of time is usually less than a working day of 8 h. Example of repeatability condition is when a stable control material or the same unknown sample is measured repeatedly on the same day. A prudent and cost-effective number of replicate measurements for estimating repeatability precision are in the order of 15, considering the relation of its uncertainty to the inverse of the square root and the c4 correction. Intermediate measurement precision
Intermediate measurement precision is measured when “a set of conditions that includes the same measurement procedure, same location, and replicate measurements on the same or similar objects over an extended period of time, but may include other conditions involving changes” [102] . The concept of between-days, between-series, inter-series imprecision has earlier been used to describe this type of imprecision. Intermediate measurement imprecision includes variation due to new calibrations, new reagent lots, new operators and so forth. Intermediate imprecision is usually measured using stable control materials in two different concentrations that are measured routinely/ daily over extended periods of time for at least 1 year, but preferably during 2–3 years. It is crucial that all sources of variation included in intermediate imprecision, including lot-number changes are included in sufficient/appropriate number of occurrences [59] . Laboratories using homemade or commercially available competitive radio immunoassays have ample evidence that intermediate imprecision may exceed 30% during observation periods of more than 1 year. If the numbers of results obtained in each series/day are the same, common two-way analysis of variance can be used to calculate the total SD and its components of SD within and between series. However, as is commonly the case in clinical laboratories, the number of replicate observations in the series is unequal, more advanced analysis of variance and variance component analysis models catering for unequal number of observations each day/series should be used [60–63] .
| R eview
measuring systems, and replicate measurements on the same or similar objects” [102] . Validating measurement reproducibility is done as part of full method validation and described under that heading below. Measurement bias
Systematic measurement error is the “closeness of agreement between the average of an infinite number of replicate measured quantity values and a reference quantity value” [102] and measurement bias is the quantitative “estimate of a systematic error” [102] . The causes of bias are numerous and their relative importance varies between measurement methods. They may include: Bias in the preparation of the calibrator, including erroneous volume measurements or weighing of calibrators;
n
Using sample matrix for the calibrators, which differs from the matrix in the samples;
n
Interferences/matrix effects in the samples, for example, the colour of bilirubin and hemoglobin in icteric and hemolytic samples in laboratory medicine or the presence of high concentrations of lipids or proteins in the sample (hyperlipidemia or myeloma). Manufacturers commonly use samples from healthy subjects for their validation studies, and the real influence of matrix effects on the methods may be fully evident only when the methods are fully introduced in diagnosing and monitoring seriously ill patients;
n
The presence of molecules in the sample specifically interfering with the reagents used in the measurement process, for example, hetero philic antibodies (e.g., human antibodies against mouse IgG frequently used in immunoassays);
n
Uncorrected loss of measurand at extraction;
n
Instability of the sample during transport or storage.
n
Determining measurement bias
Measurement bias can be determined using one or more of the following approaches: Purchasing certified reference materials from companies or organizations of high metrological competence and comparing the stated concentration with the concentration your own methods shows;
n
Measurement reproducibility
Measurement reproducibility is measured when “condition of measurement, out of a set of conditions that includes different locations, operators, future science group
www.future-science.com
309
R eview |
Theodorsson Comparing the concentrations your method measured in natural samples with the conc entrations a reference method measured in the same sample;
n
Participating in programs for external quality control. Most of these programs are based on consensus concentrations in modified control samples, but some are based on comparison to reference methods. The latter are frequently preferable;
n
Measuring the recovery of the measurand in spiked natural samples;
n
Comparing the serial dilution of a natural sample or that of a spiked natural sample with the serial dilution of the calibrator in the calibration curve;
n
Making studies of possible interferences/selectivity. This is evidently very different amongst different measurement methods and fields of study. In laboratory medicine the studies of interferences by bilirubin, hemoglobin, lipids, proteins and drugs are amongst the most important. VIM 3 defines selectivity as the “property of a measuring system, used with a specified measurement procedure, whereby it provides measured quantity values for one or more measurands such that the values of each measurand are independent of other measurands or other quantities in the phenomenon, body, or substance being investigated” [102] .
n
Treatment of measurement bias
Proper treatment of measurement bias is crucial for comparability of measurement results. GUM makes a case for the elimination of bias [64] whenever feasible. Proponents of the ‘total error concept’ are critical to the GUM – concept and include bias in their calculations [65–70] . Magnusson and Ellison have pointed out that situations are common where bias is known but where specific corrections cannot be justified. They have reviewed methods for treatment of uncorrected bias and for the proper calculation of its uncertainty [71] . The presence of icterus, hemolysis, hyperlipidemia and hyperproteinemia is usually evident and the information about intake of drugs interfering in the measurements can be acquired. The presence of matrix effects resulting in different concentrations using different methods is however harder, but not impossible to deal with. Clinical laboratories handle a large number of patient samples every day that are destroyed after the normal measurement procedure. These samples can be used to estimate bias in case they are sent to a ‘mentor laboratory’. A mentor laboratory is one of the laboratories amongst a conglomerate of laboratories, usually within the same organisation, and connected by the same laboratory information management system. This mentor laboratory has especially well calibrated and controlled methods and well educated and dedicated personnel for the purpose of calibration and
Adept method in an outpatient department Adept method in small hospital laboratory
Natural patient samples
Natural patient samples Adept method in small hospital laboratory
Mentor method e.g., in large hospital laboratory
Adept method in a hospital ward Adept method in an intensive care unit
Natural patient samples Adept method in small hospital laboratory
Natural patient samples
Adept method in primary healthcare Adept method with individual patients
Figure 3. Mentor (split sample) technique used to monitor bias between a mentor laboratory and its adept laboratories. Amongst the characteristics of the mentor laboratory are highly motivated personnel and optimal calibration, traceability, internal quality control and external proficiency testing. A perquisite for a practical system like this is appropriate information technology [119] .
310
Bioanalysis (2012) 4(3)
future science group
Validation & verification of measurement methods in clinical chemistry
| R eview
Figure 4. Broad overview of mentor (split sample) results from several measurands and measuring instruments in a large laboratory organisation.
quality control. After measurement in any of the other laboratories in the conglomerate, the sample is sent to the mentor laboratory (split sample technique) for analysis in order to measure bias (Figures 3 & 4) [119] and to estimate the relative contribution of bias and random error of individual methods and measurement instruments to the measurement uncertainty (Figure 5) . In order to monitor the bias over time using graphs it is an advantage to normalize the results in the following manner: Normalized = c
Adept - Mentor m # 100 Mentor Equation 3
expressing the results of the adepts as percentage deviation from the 100% measured by the mentor. The advantage of this is the ability to monitor changes of the bias over time using Levey–Jenning plot to detect trends and monitor deviation using standard process/quality-control methodologies (Figure 4) . The disadvantage is that the level on the measurement scale is lost. This can be compensated for by complementing future science group
the Levy–Jennings plot by a linear regression and bias plots showing the relation between bias and the measurement level (Figure 6) . Measuring interval
The measuring interval/working interval/working range/measuring range/measurement range is a “set of quantities of the same kind that can be measured by a given measuring instrument or measuring system with specified instrumental uncertainty, under defined conditions” [102] . The measuring interval is therefore dependent on the extent to which the measuring system can produce results that are fit for the intended purpose. The lower limit of the measuring interval coincides with the LOQ (the lowest concentration of the measurand that can be measured with an acceptable uncertainty), which is higher than the LOD. Linearity
There is a linear relationship between the concentration and the signal in most, but not all www.future-science.com
311
R eview |
Theodorsson B, MCHC Mtd M1 M1 M1 M1
Inst 2454 2455 3111 3311
ColD PPI PPI PPI PPI
Mean 336.3 335.1 350.8 332.8
CV total% CV treat% CV error% 2658 2086 1804 3126 07115 3180 4719 2319 4222 3546 2992 1946
CV% 2325 4963 4214 2042
n 7 13 20 24
Figure 5. Mentor (split sample) and multivariate analysis techniques used to estimate bias (CV treat%) and random error (CV error%) components of measurement uncertainty for several hematology measurement instruments measuring mean corpuscular hemoglobin concentration in whole blood samples.
(e.g., competitive immunoassays) measurement methods. Evaluation of linearity is more often done to satisfy regulatory requirements than as an integral part of the quality systems of laboratories. At least five, preferably ten samples spanning the measuring interval are needed – five replicates of each sample. A serial dilution in an appropriate matrix of a sample containing high concentration of the measurand is suitable, or alternatively, commercially available samples are prepared for the purpose. An initial assessment of the linearity should be performed by constructing a scatter plot and a linear regression of the response versus the concentration. Furthermore, a plot of the residuals versus the concentration should be made. Several formalized tests of linearity have been proposed [39,72,73] , which are advantageous to visual estimation. Sensitivity
The sensitivity of a measurement system is the ‘quotient of the change in an indication of a measuring system and the corresponding change in value of a quantity being measured’ [102] . In brief, sensitivity is the slope of the calibration function. 312
Bioanalysis (2012) 4(3)
Selectivity
The selectivity of a measuring system is a “property of a measuring system, used with a specified measurement procedure, whereby it provides measured quantity values for one or more measurands such that the values of each measurand are independent of other measurands or other quantities in the phenomenon, body, or substance being investigated” [102] . Selectivity is a qualitative concept describing absence of interference/confounders in the measurement method in general, including substances that cross-react in the measurement, matrix effects in general and other effects, including the effects of heterophilic antibodies. The analyst should use her/his own experience and data from the literature in order to systematically test for the interferences that are most likely to affect the measurement method in question [74,75] . Basic requirements in clinical chemistry include tests for interference in icteric, lipemic or hemolytic samples. It is also highly valuable to test samples that have previously shown interference in other methods. Such samples are prevalent, for example, in the diagnosis of thyroid diseases due to the presence of heterophilic antibodies. future science group
Validation & verification of measurement methods in clinical chemistry
| R eview
Repeated measurement of aliquots of a sample with concentration near to the LOD: perform all steps of the measurement procedure on ten aliquots of one or more sample(s) with concentrations near to the LOD of the method, each aliquot from each sample on separate days. Report LOD = 3.3 × SD [39] or use the method proposed by Thienpont et al. [15] ;
n
LOD
The LOD is “measured quantity value, obtained by a given measurement procedure, for which the probability of falsely claiming the absence of a measurand in a material is b, given a probability a of falsely claiming its presence” [102] . The LOD in qualitative methods is determined by spiking the blank solution by the order of five different concentrations (e.g., five 1/2 dilutions) expected to have concentrations near to the LOD of the method. To determine LOD, measure ten replicates of each of five different concentrations in randomized order (the tool www.random.org/has been shown to be truly random, and is a personal favorite), and determine the concentration at which the percent positive or negative becomes unreliable. There are several alternative acceptable methods for determining the LOD which are preferred depending on the basic technology being validated: Repeated measurement of blanks: for methods yielding fair signal when measuring blanks, the following method can be used. Perform all steps of the measurement procedure on ten aliquots of a blank sample and report LOD = 5 × SD;
n
Using data from a linear calibration function: calculate the LOD as:
n
a + 3 = SD yx
equation 4
where a is the intercept on the x-axis and SDyx is SD of the residuals around the calibration curve [76] . LOQ
The LOQ is not a concept defined in VIM3, but has been defined as “the lowest concentration of measurand that can be determined with an acceptable level of repeatability precision and trueness” [106] . It is commonly taken to be 10 × SD where SD is the SD of the blank or of a sample containing very low concentrations of the measurand. Perform all steps of the
Figure 6. A mentor (split sample) technique used to estimate bias between a mentor laboratory and one of its adept laboratories regarding measurement of the concentration of hemoglobin in whole blood. (A) A traditional Levy–Jennings internal quality control plot of the mentor results around the optimum of 100%. Each horizontal line represents one SD. (B) A linear regression of the concentrations measured by the mentor in relation to the corresponding concentration measured by the adept. (C) and (D) Bias plots of the absolute and relative deviation of the results in relation to the mentor results.
future science group
www.future-science.com
313
R eview |
Theodorsson measurement procedure on ten aliquots of one or more sample(s) with concentrations near to the LOD of the method, each aliquot from each sample on separate days. Report LOD = 10 × SD [39] or use the method proposed by Thienpont et al. [15] . The diagnostic relevance of “the acceptable level of repeatability precision and trueness” in clinical chemistry is not generally agreed, and establishing the clinical use of diagnostic markers is far from being only a technical matter, but rather is the subject of extensive clinical studies in patients [77] . Robustness
Robustness/ruggedness is “the ability of the measurement method to withstand small changes in its operating conditions” [39] . Robustness regarding crucial measurement parameters particular for the method, for example temperature or pH, should be tested systematically during validation preferably using one of the several available tools for systematic experimental design [74] . Storage stability of the measurand in the sample matrix
Stability of measurands in biological matrix depends on the properties of the measurand, the matrix and the storage conditions, including the sample container, storage temperature and exposure to light. A particular concern regarding measurands in biological matrix is the freeze–thaw cycles. Freeze–thaw stability
The FDA recommends that “at least three aliquots at each of the low and high concentrations should be stored at the intended storage temperature for 24 h and thawed unassisted at room temperature” [101] . Short-term temperature stability
The FDA validation document recommends that “three aliquots of each of the low and high concentrations should be thawed at room temperature and kept at this temperature from 4–24 h (based on the expected duration that samples will be maintained at room temperature in the intended study) and analyzed” [101] .
back-calculated values for the standards at the appropriate concentrations from the first day of long-term stability testing” [101] . Sampling techniques
Patient preparation and preanalytical influences on measurands in biological matrices are beyond the scope of the present presentation. They have been comprehensively dealt with, for example, by Guder et al. [39] . The presence of coagulation proteins may interfere with the measurement method, making serum preferable to plasma. Similarly, anticoagulant additives may interfere in the measurement process and their influence must therefore be tested. Various enzyme inhibitors may be needed to stabilize the measurand, bur their influence on the measurement procedure itself must also be investigated. The wealth of specialized literature should be consulted regarding each measurand and the matrix in which it is to be measured. Measurement uncertainty
Measurement uncertainty is a “non-negative parameter characterizing the dispersion of the quantity values being attributed to a measurand, based on the information used” [102] . It includes both systematic and random components (Figure 1) . The initial estimate of measurement uncertainty sufficient for single laboratory method validation can be obtained from method validation data [78,79] , but highly reliable estimates of measurement uncertainty are only obtained after months and years of measuring single batch of stabilized control materials, including the contribution from all causes of variation (e.g., calibrations or changes of reagent lots) as part of full method validation. This was already emphasised by Walter Shewhart in the 1930s [59] and needs to be rediscovered and applied in practice by all engaged in measuring and monitoring variation. Since measurement methods are prone to matrix effects in stabilized control materials, estimates of measurement reproducibility using these samples overestimate the uncertainty. Splitsample techniques using natural patient samples as described in ‘Measurement reproducibility’ provide uncertainty estimates more close to the real uncertainty experienced in healthcare [119] .
Long-term stability
The FDA document recommends “storing at least three aliquots of each of the low and high concentrations under the same conditions as the study samples. The concentrations of all the stability samples should be compared with the mean of 314
Bioanalysis (2012) 4(3)
Full
method validation Full method validation consists both of a technical part and of fit-for-purpose studies – studies of the methods diagnostic properties in clinical chemistry. future science group
Validation & verification of measurement methods in clinical chemistry Full technical method validation
Full technical method evaluation is performed as described under single laboratory method validation extended to all measurement instruments and methods measuring the same measurand. Basically, it aims at minimizing measurement uncertainty and matrix effects for all methods that a patient sample is likely to encounter. Full diagnostic method validation is seldom done by routine end-user laboratories, and is commonly done as a part of diagnostic research projects. All laboratories need to continuously monitor their measurement uncertainty in order to make sure that the uncertainty established during full method validation is not exceeded. This is especially important since the evaluation of fit-forpurpose/diagnostic evaluation is dependent on the measurement uncertainty. Healthcare laboratories are frequently organised into larger laboratory organizations encompassing several physical laboratories catering for diagnostic services for a defined region/population. This caters for important new opportunities for redefining the concept of a ‘laboratory’ to encompass all laboratories and measurement methods measuring the same measurand for a population of patients. In order to make measurement results comparable, bias should be minimized or eliminated and measurement uncertainty properly evaluated for all methods used for a particular patient population. The measurement as well as diagnostic uncertainty can be evaluated from internal and external quality control results using stabilized control materials or natural patient samples. Measurement reproducibility
Measurement reproducibility is a “condition of measurement, out of a set of conditions that includes different locations, operators, measuring systems, and replicate measurements on the same or similar objects” [102] . In healthcare, a single patient may encounter results obtained over time from several different measurement principles and methods as he visits different hospitals, outpatient departments or when he makes his own measurements. In many cases measurement results from different laboratories suffer from bias making it impossible to draw any conclusions from the differences between measurement results. This is frequently practically and partially remedied by using establishing separate reference intervals for each measurement method, at high cost to the patients and the healthcare system. future science group
It is therefore essential, whenever possible, to eliminate bias between measurement methods [64] in order to avoid separate reference intervals and confusion and errors regarding medical decisions when monitoring disease and treatment effects. This is an especially daunting task when many measurement methods and laboratories are used in clinical diagnosis compared with organisations where fewer centralized laboratories are used. A major contributor to measurement uncertainty is bias caused by difference in calibrations, lot number changes and matrix effects, as described below.
| R eview
Key Term Full diagnostic method validation: Investigates the
diagnostic properties of the method and the added value it brings to the clinical diagnosis and monitoring of treatment effect.
Full diagnostic method validation
Full diagnostic method validation in laboratory medicine means investigating the diagnostic properties of the method and the added value it brings to the clinical diagnosis and monitoring of treatment effects. Galen and Gambino established the statistical and epidemiological principles of full diagnostic method validation and showed that ‘common sense’ interpretation of data prevalent in clinical medicine should be replaced by rational principles [80] . Recent excellent literature in the field includes the books by Pepe [81] and Zhou et al. [82] . The basis of characterizing diagnostic performance is to have a well-accepted gold standard for diagnosis and estimating how well the diagnostic method being validated performs in relation to the gold standard method. Data are depicted in a classical 2 × 2 table (Figure 7) and the parameters/concepts depicted and defined in table 1 are calculated. The first important issue for making measurement results comparable is to eliminate bias between measurement methods. This is an especially daunting task when measurement methods are used in clinical diagnosis compared with fields where fewer centralized Participants With disease Positive test
True positives
Negative test
False negatives (type II error) Total with disease [Sensitivity]
Without disease False positives Total positive (type I error) True negatives
Total negative
[PPV] [NPV]
Total without disease [Specificity]
Figure 7. A 2 × 2 table serving as the basis for calculating sensitivity, specificity, predictive values and likelihood ratios (Table 1). PPV: Positive predictive value; NPV: Negative predictive value.
www.future-science.com
315
R eview |
Theodorsson
Table 1. Definition and calculation of parameters/concepts describing diagnostic properties of measurement methods. Parameter/concept
Formula/explanation
Diagnostic sensitivity is the proportion of those with disease who have positive test results Diagnostic specificity is the proportion of those without disease who have negative test results The positive likelihood ratio is the ratio of the true-positive to the false-positive rate The negative likelihood ratio is the ratio of the false-negative rate to the true-negative rate DOR combines the concepts of sensitivity, specificity and likelihood ratios into a single number, this is particularly useful for combining study results in systematic reviews ROC curves
Number of true positives Total with disease Number of true negatives Specificity = Total without disease Sensitivity LR + = 1 - Specificity 1 - Sensitivity LR - = Specificity LR + DOR = LR Sensitivity =
ROC curves show diagnostic properties of a measurement method used to classify persons with or without disease as the decision limit between health and disease is changed
PPV is the proportion of those with a positive test result who have Number of true positives PPV = Total number of positives the disease; takes into account the prevalence of disease in the target population NPV is the proportion of those with negative test results who do Number of true negatives NPV = Total number of negatives not have the disease; takes into account the prevalence of disease in the target population It should be noted that the prevalence of disease in the intended population is crucial for the predictive values, but not for the other parameters. DOR: Diagnostic odds ratio; NPV: Negative predictive value; PPV: Positive predictive value; ROC: Receiver operating characteristic.
laboratories are used. Bias between results of individually calibrated measurement methods in healthcare systems is a major contributor to diagnostic uncertainty when diagnosing diseases and when monitoring the effects of treatment. The second issue for making measurement results comparable is stating the measurement uncertainty as well as the diagnostic uncertainty. By tradition, a laboratory is taken to be a coherent single physical entity within, for example, a hospital. Laboratories are increasingly joined into larger laboratory organizations encompassing several physical laboratories. This caters for important new opportunities for redefining the concept of a ‘laboratory’ to encompass all laboratories and measurement methods measuring the same measurand, for all levels of healthcare within a geographical area caring for a defined population in the order of 0.5–1 million inhabitants. In order to make measurement results comparable a measurement uncertainty has to be evaluated for measurement results from this ‘laboratory’. A major task in addition to all the routines already implemented would then be the task of minimizing the bias between results for patient samples transported between different locations within the ‘laboratory’. In the clinical area, the bias can be monitored by an 316
Bioanalysis (2012) 4(3)
ongoing quality control using patient samples analyzed at the different locations within the ‘laboratory’ [83] . Verification of measurement methods Measurement methods and instruments used in laboratory medicine in general, and clinical chemistry in particular, are overwhelmingly manufactured by large international companies. These companies are responsible for the validation of these methods for specific diagnostic or monitoring purposes [84,101,120] , but customers are responsible for verifying that the characteristics shown during validation can be reproduced in the practical clinical situation. Local verification practices have commonly been established over time and are frequently influenced by accreditation and certification authorities. Published practices for end-user verification officially endorsed both by the endusers and by the companies have appeared only recently [115,116] . In vitro diagnostic (IVD) medical devices are regulated in Europe by a third Medical Device Directive, the IVD Medical Device Directive 98/79/EC [120] , which has been mandatory since December 2003. Validation of the performance of instruments and reagent kits are performed by the manufacturer. In the case of a measurement method established by a future science group
Validation & verification of measurement methods in clinical chemistry local laboratory, the same requirements apply if the method is meant to be used in healthcare. The validation includes establishing comprehensive specifications for the instrument and/ or the reagent set and method, and should be available to the end-user. The validation needs to include reagent volumes, calibrator choice and performance, reagent composition, control material, interferences and so forth, as appropriate. Last, but not at least, the clinical value of the results, for instance in terms of diagnostic sensitivity and specificity, need to be sufficiently validated. The European IVD directive [84,85,120] stipulates that measurement methods, reagents and instruments should be manufactured in such a way that they will not compromise the clinical condition or safety of the patients, the safety or health of users or, where applicable, other persons, or the safety of property. In addition, the Directive requires that the in vitro diagnostic device in the hands of its end users must achieve the performance stated by the manufacturer, including analytical sensitivity, LOD, diagnostic sensitivity, analytical specificity, diagnostic specificity, accuracy, repeatability, reproducibility and control of known relevant interferences. In practice, verification is usually restricted to comparison of methods experiments to establish inaccuracy or bias, replication experiments to establish imprecision and a linearity check to determine the reportable range and sometimes collecting reference values to verify the reference range. Clinical laboratories commonly measure in the order of 20–200 natural patient samples having as wide concentration range as possible, using both the method being replaced and the new method. At least two pooled patient
| R eview
samples may also be used, and this may actually be an advantage when the medical decision point is close to the LOD of the method. Suitable stable materials for internal quality control are measured at two levels in at least two replicates for at least 5 consecutive days for estimating imprecision and for establishing initial control limits for the internal quality control procedures. Linear regression [86,87] , bias-plot [88,89] and analysis of variance [60] techniques are used to determine bias, imprecision, matrix effects, and so forth (Figures 4 & 5) . Future perspective The need for mutually accepted validation and verification procedures in clinical chemistry as in all fields of bioanalysis are obvious as international accreditation and certification standards or their equivalents are implemented. However, internationally agreed measurement units and nomenclature are fully implemented only painfully slowly, as exemplified by the SI system of units and the VIM. The entire world is already extensively technically and economically integrated and in need of further harmonization in the field of bioanalysis. Hopefully, such extensive harmonization is not more than a generation away. Financial & competing interests disclosure The author received financial support from The County Council of Östergötland, Sweden. The author has no other relevant affiliations or financial involvement with any organization or entity with a financial interest in or financial conflict with the subject matter or materials discussed in the manuscript apart from those disclosed. No writing assistance was utilized in the production of this manuscript.
Executive summary
Despite important developments during recent years, there is as yet no comprehensive agreement on validation and verification procedures amongst the different fields of bioanalysis.
The need for mutually accepted validation procedures becomes obvious when international accreditation and certification standards or their equivalents are implemented.
A giant leap forward could be accomplished if all fields of bioanalysis fully accept and implement the agreements and fundamental documents in metrology – the mother discipline of all branches of bioanalysis.
The principles of metrology can be, and are being, implemented in the field of clinical chemistry, a field of bioanalysis where common validation procedures need to be extended by investigating the diagnostic properties of methods, and the added value they bring to the clinical diagnosis of human disease conditions and to the monitoring of treatment effects.
Measurement methods and instruments used in clinical chemistry are overwhelmingly manufactured by large international companies. Such companies are responsible for the validation of these methods for specific diagnostic or monitoring purposes, but the customers are responsible for verifying that the characteristics shown during validation can be reproduced in the local clinical situation. Proposals for end-user verification officially endorsed both by the end-users and by the companies have appeared only recently.
future science group
www.future-science.com
317
R eview |
Theodorsson acceptable and harmonized guideline on bioanalytical method validation. Bioanalysis 2(11), 1801–1803 (2010).
References Papers of special note have been highlighted as: n of interest nn of considerable interest 1
2
3
4
5
6
7
nn
8
9
10
11
Viswanathan CT, Bansal S, Booth B et al. Workshop/conference report – quantitative bioanalytical methods validation and implementation: best practices for chromatographic and ligand binding assays. AAPS J. 9(1), E30–E42 (2007). Shah VP, Midha KK, Dighe S et al. Analytical methods validation – bioavailability, bioequivalence and pharmacokinetic studies. Pharm. Res. 9(4), 588–592 (1992). Shah VP, Midha KK, Findlay JW et al. Bioanalytical method validation – a revisit with a decade of progress. Pharm. Res. 17(12), 1551–1557 (2000). Viswanathan CT, Bansal S, Booth B et al. Quantitative bioanalytical methods validation and implementation: best practices for chromatographic and ligand binding assays. Pharm. Res. 24(10), 1962–1973 (2007).
Timmerman P, Brudny-Kloeppel M. Towards harmonized regulations for bioanalysis: moving forward! Bioanalysis 2(4), 689–691 (2010).
14
15
16
18
Menditto A, Patriarca M, Magnusson B. Understanding the meaning of accuracy, trueness and precision. Accredit. Qual. Assur. 12, 45–47 (2007).
19
AOAC guidelines for single laboratory validation of chemical methods for dietary supplements and botanicals (2002). Van Amsterdam P, Arnold M, Bansal S et al. Building the global bioanalysis consortium – working towards a functional globally
318
Truchaud A. European Committee for Clinical Laboratory Standards (ECCLS) guidelines for the evaluation of analyzer in clinical chemistry. ECCLS Document 3(2) 7–8, Beuth Verlag GmbH Berlin, Germany (1986).
validation and regulation: evolution of a guidance document on bioanalytical methods validation. AAPS J. 9(1), E43–E47 (2007).
Haeckel R. Verification, validation and evaluation of analytical procedures in laboratory medicine. Clin. Chem. Lab. Med. 42(1), 111–112 (2004).
Lee JW, Hall M. Method validation of protein biomarkers in support of drug development or clinical diagnosis/prognosis. J. Chromatogr. B Analyt. Technol. Biomed. Life Sci. 877(13), 1259–1271 (2009).
26 Haeckel R, Busch EW, Jemmings RD,
13 Shah VP. The history of bioanalytical method
17
Lee JW, Devanarayan V, Barrett YC et al. Fit-for-purpose method development and validation for successful biomarker measurement. Pharm. Res. 23(2), 312–328 (2006).
Naudin C. Recommendations for the multicentre evaluation of analytical systems in clinical chemistry. In: Evaluation Methods in Laboratory Medicine. Haeckel R (Ed.). VCH, Weinheim, Germany, 47–69 (1993).
12 Van Amsterdam P, Lausecker B, Luedtke S,
Blume H, Brendel E, Brudny-Kloppel M et al. Workshop/conference report on European Medicine Agency draft guideline on validation of bioanalytical methods. Eur. J. Pharm. Sci. 42(3), 300–305 (2011).
The crucial concepts of accuracy, trueness and precision still cause controversy and confusion. Menditto and co-workers have created a diagram that brilliantly explains these concepts and the relation between them.
25 Haeckel R, Römer M, Sonntag O, Vassault A,
Shahaigan S, Cohn RD, Gaunt EE, Krolak JM. System to monitor a portion of the total testing process in medical clinics and laboratories: evaluation of a split-specimen design. Clin. Chem. 45(2), 269–280 (1999).
27 Haeckel R. Decision criteria for the selection
of analytical instruments used in clinical chemistry. J. Automatic Chemistry 2, 22–33 (1980).
Thienpont LM, Stockl D, D’hondt H. Method validation across the disciplinesCritical investigation of major validation criteria and associated experimental protocols. J. Chromatogr. B 877(23), 2180–2190 (2009).
28 Haeckel R. Evaluation Methods in Laboratory
Hibbert DB. Method Validation. Elsevier, Oxford (2005).
30 Hibbert RB. Method validation of modern
Rozet E, Marini RD, Ziemons E, Boulanger B, Hubert P. Advances in validation, risk and uncertainty assessment of bioanalytical methods. J. Pharmaceut. Biomed. 55(4), 848–858 (2011). Thompson M, Ellison LR, Wood R. Harmonized guidelines for single-laboratory validation of methods of analysis. Pure Appl. Chem. 74(5), 835–855 (2002). Hartmann C, Smeyers-Verbeke J, Massart DL, Mcdowall RD. Validation of bioanalytical chromatographic methods. J. Pharmaceut. Biomed. 17(2), 193–218 (1998).
Medicine. VCH, Weinheim, Germany (1993). 29 Hibbert DB. Method validation of modern
analytical techniques. Accredit. Qual. Assur. 4(8), 352–356 (1999). analytical techniques. Accredit. Qual. Assur. 4, 352–356 (1999). 31
32 Knottnerus JA, Muris JW. Assessment of the
accuracy of diagnostic tests: the crosssectional study. J. Clin. Epidemiol. 56(11), 1118–1128 (2003). 33 Bossuyt PM, Reitsma JB, Bruns DE et al.
Towards complete and accurate reporting of studies of diagnostic accuracy: the STARD initiative. BMJ 326(7379), 41–44 (2003).
20 Wood R. How to validate analytical methods.
Trends Anal. Chem. 18(9–10), 624–632 (1999). 21
Wieling J, Hendriks G, Tamminga WJ et al. Rational experimental design for bioanalytical methods validation – Illustration using an assay method for total captopril in plasma. J. Chromatogr. A 730(1–2), 381–394 (1996).
22 Rozet E, Ceccato A, Hubert C et al. Analysis
of recent pharmaceutical regulatory documents on analytical method validation. J. Chromatogr. A 1158(1–2), 111–125 (2007). 23 Massart DL, Dijkstra A, Kaufman L.
Evaluation and Optimization of Laboratory Methods and Analytical Procedures. Elsevier Scientific Publishing, Amsterdam, The Netherlands (1978). 24 Clinical and Laboratory Standards Institute
(CLSI). User verification of performance for precision and trueness; approved guideline. 25(17), EP15-A2 (2006).
Bioanalysis (2012) 4(3)
Barwick VJ, Ellison SLR, Raffaerty MJQ, Gill RS. The evaluation of measurement uncertainty from method validation studies. Part 2: the practical application of laboratory protocol. Accredit. Qual. Assur. 5, 104–113 (2000).
34 Williams DR. Minimum criteria for
validation of analytical methods. J. Assoc. Off. Anal. Chem. 69, 432–436 (1986). 35
Permanent Liaison Group between EAL (European co-operation for Accreditation of Laboratories) and EUROLAB. Validation of test methods. General principles and concepts. Accredit. Qual. Assur. 3, 29–32 (1998).
36 Holmgren M. Validation of test methods.
General principles and concepts. Accredit. Qual. Assur. 3, 29–32 (1998). 37 De Bièvre P, Günzler H. Validation in
Chemical Measurement. Springer, Berlin, Germany (2004). 38 Taverniers I, De Loose M, Van Bocksraele E.
Trends in quality in the analytical laboratory. II. Analytical method validation and quality assurance. Trends Anal. Chem. 23(8), 535–552 (2004).
future science group
Validation & verification of measurement methods in clinical chemistry 39 Guder WG. Diagnostic samples: From the
53 Desilva B, Smith W, Weiner R et al.
Patient to the Laboratory: The Impact of Preanalytical Variables on the Quality of Laboratory Results (4th Edition). Wiley-VCH, Weinheim (2009).
Recommendations for the bioanalytical method validation of ligand-binding assays to support pharmacokinetic assessments of macromolecules. Pharm. Res. 20(11), 1885–1900 (2003).
40 Ellison SLR, Farrant TJ, Barwick V. Practical
Statistics for the Analytical Scientist: a Bench Guide (2nd Edition). RSC Publishing, Cambridge, UK (2009). n
A brief and well-written introduction to the science and practice of bioanalytical measurements.
Validation of Analytical Methods (1st Edition). Pergamon, Tarrytown, NY, USA (1996). 55
of assay methodology used in pharmacokinetic studies. J. Pharmacol Methods 17, 337–346 (1987). Encyclopedia of Biopharmaceutical Statistics. Informa Healthcare, London, UK, 63–71 (2003).
45
Peters T, Westgard JO. Evaluation of methods. In: Textbook of Clinical Chemistry. Tietz NW (Ed.). WB Saunders, PA, USA 410–423 (1986).
the population variance and standard deviation. Am. J. Psychol. 63(4), 615–617 (1950). Viewpoint of Quality Control. Dover Publications, NY, USA (1939).
48 Jennings L, Van Deerlin VM, Gulley ML.
Recommended principles and practices for validating clinical molecular pathology tests. Arch. Pathol. Lab. Med. 133(5), 743–755 (2009).
61
52
Chan CC. Analytical Method Validation and Instrument Performance Verification. Wiley, Hoboken, NJ, USA (2004).
future science group
70 Westgard JO, Carey RN, Wold S. Criteria for
judging precision and accuracy in method development and evaluation. Clin. Chem. 20, 825–833 (1974). 71 Magnusson B, Ellison SLR. Treatment of
uncorrected measurement bias in uncertainty estimation for chemical measurements. Anal. Bioanal. Chem. 390(1), 201–213 (2008). 72 Debrus B, Lebrun P, Kindenge JM et al.
Innovative high-performance liquid chromatography method development for the screening of 19 antimalarial drugs based on a generic approach, using design of experiments, independent component analysis and design space. J. Chromatogr. A 1218(31), 5205–5215 (2011).
Rao CR, Kleffe J. Estimation of Variance Components and Applications. Elsevier Science Publications, Amsterdam, The Netherlands, 3 (1988).
73 Marini RD, Chiap P, Boulanger B et al. LC
method for the determination of R-timolol in S-timolol maleate: validation of its ability to quantify and uncertainty assessment. Talanta 68(4), 1166–1175 (2006).
Variance Components. John Wiley & Sons, NJ, USA (1992). 63 Cox DR, Solomon PJ. Components of
Variance. Chapman & Hall/CRC, FL, USA (2003). 64 Dybkaer R. From total allowable error via
metrological traceability to uncertainty of measurement of the unbiased result. Accredit. Qual. Assur. 4(9–10), 401–405 (1999).
50 Rifai N, Gillette MA, Carr SA. Protein
Feinberg M, Laurentie M. A global approach to method validation and measurement uncertainty. Accredit. Qual. Assur. 11(1–2), 3–9 (2006).
uncertainty in the medical laboratory. Clinical chemistry and laboratory medicine. Clin. Chem. Lab. Med. 48(1), 31–40 (2010).
62 Searle SR, Casella G, Mccullogh CE.
and validation. Clin. Chem. 52(9), 1635–1637 (2006).
51
69 Westgard JO. Managing quality vs. measuring
procedures for internal analytical quality control. Theoretical design and practical evaluation. Scand. J. Clin. Lab. Invest. 44, 51–64 (1984).
49 Rifai N, Gerszten RE. Biomarker discovery
biomarker discovery and validation: the long and uncertain path to clinical utility. Nat. Biotechnol. 24(8), 971–983 (2006).
expression of uncertainty in measurement method of estimating and reporting uncertainty in diagnostic assays. Clin. Chem. 49(11), 1818–1821 (2003).
60 Aronsson T, Groth T. Nested control
improved instrument and kit evaluation. Am. J. Clin. Pathol 86, 391–393 (1986). automated equipment. In: Clinical Biochemistry Principles, Methods, Applications. Lawson AM, Curtis HC, Roth M. (Eds). Walter de Gruyter, Berlin, Germany, 549–563 (1991).
68 Krouwer JS. Critique of the guide to the
59 Shewhart WA. Statistical Method From the
46 Hackney J, Cembrowski G. Need for
47 Haeckel R, Weber C. Evaluation of
evaluating total analytical error for diagnostic assays. Clin. Chem. 48(6 Pt 1), 919–927 (2002).
58 Holtzman WH. The unbiased estimate of
44 Koch DD, Peters T. Selection and evaluation
of methods. In: Tietz Textbook of Clinical Chemistry. Burtis CA, Ashwood ER (Eds). WB Saunders Company, PA, USA (1994).
67 Krouwer JS. Setting performance goals and
57 Schofield TL. Assay validation. In:
43 Carey RNG, Koch DD. Concepts and Practices
in the Evaluation of Laboratory Methods. Workshop, LA, USA (1994).
modeling by accounting for error sources beyond imprecision and bias. Clin. Chem. 47(7), 1329–1331 (2001).
56 Aarons L, Toon S, Rowland M. Validation
42 Carey RN, Garber CC. Evaluation of
methods. In: Clinical Chemistry Theory, Analyses, and Correlation. Kaplan LA, Pesce AJ (Eds). The CV Mosby Company, MO, USA, 338–359 (1984).
Chan CC, Lam H, Zhang X-M. Practical Approaches to Method Validation and Essential Instrument Performance Verification. Wiley, NJ, USA (2010).
nn
Unified concepts and nomenclature is a fundamental prerequisite for optimal communication in metrology and in bioanalysis. VIM 3 is the condensed official expression of the internationally established nomenclature in metrology and in bioanalysis. In order to understand the philosophy and theory behind VIM 3 the doctoral thesis of René Dybkaer is a highly recommended read.
www.future-science.com
Rozet E, Marini RD, Ziemons E et al. Total error and uncertainty: friends or foes? Trends Anal. Chem. 30(5), 797–806 (2011).
66 Krouwer JS. How to improve total error
54 Riley CM, Rosanske TW. Development and
41 Peters FT, Drummer OH, Musshoff F.
Validation of new methods. Forensic Sci. Int. 165(2–3), 216–224 (2007).
65
| R eview
74
Meyer JS, Quenzer LF. Psychopharmacology: Drugs, the Brain, and Behavior. Sinauer Associates, MA, USA (2005).
75 Wu SL, Li W, Wells A, Dasgupta A.
Digoxin-like and digitoxin-like immunoreactive substances in elderly people. Impact on therapeutic drug monitoring of digoxin and digitoxin concentrations. Am. J. Clin. Path. 115(4), 600–604 (2001). 76 Waxman SG. From Neuroscience to Neurology:
Neuroscience, Molecular Medicine and the Therapeutic Transformation of Neurology. Elsevier Academic Press, Amsterdam, The Netherlands (2005). 77 Reichlin T, Hochholzer W, Bassetti S et al.
Early diagnosis of myocardial infarction with sensitive cardiac troponin assays. N. Engl. J Med. 361(9), 858–867 (2009).
319
R eview |
Theodorsson
78 Feinberg M, Boulanger B, Dewe W, Hubert P.
102 JCGM. International vocabulary of
New advances in method validation and measurement uncertainty aimed at improving the quality of chemical data. Anal. Bioanal. Chem. 380(3), 502–514 (2004). 79 Patriarca M, Castelli M, Corsetti F, Menditto
metrology – basic and general concepts and associated terms (VIM 3). www.bipm.org/en/publications/guides/vim. html 103 Terminology in analytical
A. Estimate of uncertainty of measurement from a single-laboratory validation study: application to the determination of lead in blood. Clin. Chem. 50(8), 1396–1405 (2004). 80 Galen RS, Gambino SR. Beyond Normality:
The Predictive Value and Efficiency of Medical Diagnoses. John Wiley & Sons, NJ, USA (1975). 81
measurement – introduction to VIM 3 (2011). www.eurachem.org/guides/pdf/ TAM_2011_Final_web.pdf 104 An ontology on property for physical,
chemical and biological systems (2004). http://ontology.iupac.org/ontology.pdf 105 JCGM. Evaluation of measurement data –
Pepe MS. The Statistical Evaluation of Medical Tests for Classification and Prediction. Oxford University Press, Oxford, UK (2003).
Guide to the expression of uncertainty in measurement. www.bipm.org/en/publications/guides/ gum.html
82 Zhou X-H, Obuchowski NA, Mcclish DK.
Statistical Methods in Diagnostic Medicine. Wiley-Interscience, NY, USA (2002). 83 Dybkaer R. From total allowable error via
metrological traceability to uncertainty of measurement of the unbiased result. Accredit. Qual. Assur. 4, 401–405 (1999). 84 Dati F. The new European directive on in vitro
diagnostics. Clin. Chem. Lab. Med. 41(10), 1289–1298 (2003). 85 Stankovic AK, Romeo P. The role of in vitro
diagnostic companies in reducing laboratory error. Clin. Chem. Lab. Med. 45(6), 781–788 (2007). 86 Passing H, Bablock W. Comparison of several
regression procedures for method comparison studies and determination of sample sizes. Application of linear regression procedures for method comparison studies in clinical chemistry. Part II. J. Clin. Chem. Clin. Biochem.22, 431–445 (1984). 87 Deming WE. Statistical Adjustment of Data.
John Wiley & Sons, Inc, Oxford, UK (1943). 88 Bland JM, Altman DG. Statistical methods for
assessing agreement between two methods of clinical measurement. Lancet 327, 307–310 (1986). 89 Altman DG, Bland JM. Measurement in
medicine: the analysis of method comparison studies. Statistician 32, 307–317 (1983). Websites 101 FDA Guidance for Industry. Bioanalytical
Method Validation (2001). www.fda.gov/downloads/Drugs/ GuidanceComplianceRegulatoryInformation/ Guidances/ucm070107.pdf
320
n
All measurements are frought with uncertainties. Understanding them and handling them properly is crucial both in metrology and in all fields of bioanalysis.
106 De Biévre P, Böttger D, Eastwood C et al.
The fitness for purpose of analytical methods. a laboratory guide to method validation and related topics (1998). www.eurachem.org/guides/pdf/valid.pdf 107 Measurement uncertainty arising from
sampling: a guide to methods and approaches (2007). www.eurachem.org/index.php/publications/ guides/musamp 108 European Medicines Agency concept paper/
recommendations on the need for a guideline on the validation of bioanalytical methods (2008). www.ema.europa.eu/pdfs/human/ ewp/53130508en.pdf 109 European Medicines Agency draft guideline
on validation of bioanalytical methods (2009). www.ema.europa.eu/pdfs/human/ ewp/19221709en.pdf 110 CDC. CLIA 88, Certification of laboratories
(1988). wwwn.cdc.gov/clia/pdf/PHSA_353.pdf 111 Eurachem: traceability in chemical
measurement. A guide to achieving comparable results in chemical measurements (2003). www.eurachem.org/index.php/publications/ guides/trc
Bioanalysis (2012) 4(3)
112 Eurachem: the fitness for purpose of
analytical methods. A laboratory guide to method validation and related topics (1998). www.eurachem.org/guides/pdf/valid.pdf 113 Harmonised guidelines for the use of
recovery information in analytical measurement (1998). www.eurachem.org/guides/pdf/recovery.pdf 114 Eurpean Medicines Agency. Guideline on
Bioanalytical Method Validation (2011). www.ema.europa.eu/docs/en_GB/ document_library/Scientific_ guideline/2011/08/WC500109686.pdf 115 Khatami Z, Hill R, Sturgeon C, Kearney E,
Breadon P, Kallner A. Measurement verification in the clinical laboratory: a guide to assessing analytical performance during the acceptance testing of methods (quantitative examination procedures) and/ or analysers. The Scientific Committee of the Association for Clinical Biochemistry (2010). www.acb.org.uk/An%20Ver/ Measurement%20verification_ final_090608.pdf 116 Burnett D. Measurement verification in the
clinical laboratory: A guide to assessing analytical performance during the acceptance testing of methods (quantitative examination procedures) and/or analysers. (2010). www.acb.org.uk/An%20Ver/David%20 Burnett%20Editorial.pdf 117 Clinical laboratory improvement
amendments (1988). www.fda.gov/MedicalDevices/ DeviceRegulationandGuidance/ IVDRegulatoryAssistance/ucm124105.htm 118 NIST/Sematech: e-handbook of statistical
methods (2008). www.itl.nist.gov/div898/handbook/ 119 Norheim S. Computer support simplifying
uncertainty estimation using patient samples (2008). http://liu.diva-portal.org/smash/ record.jsf?pid=diva2:417298 120 EU Directive 98/79/EC of the European
Parliament and of the Council of 27 October 1998 on in vitro diagnostic medical devices (1998). www.europa.eu/legislation_summaries/ internal_market/single_market_for_goods/ technical_harmonisation/l21010c_en.htm
future science group