Journal of Sensor Technology, 2016, 6, 81-100 http://www.scirp.org/journal/jst ISSN Online: 2161-1238 ISSN Print: 2161-122X
Validation of Autonomous Microbe Sensor Prototype for Monitoring of Microorganisms in Injection Seawater Systems Mohammed A. Al-Moniee1*, Xiangyang Zhu1, Lone Tang2, Fuad I. Nuwaiser1, Niels V. Voigt2, Peter F. Sanders1, Fahad N. Al-Abeedi1, Hanaa H. Al-Habboubi1 1 2
Saudi Arabian Oil Company (Saudi Aramco), Dhahran, KSA Danish Technological Institute (DTI), Aarhus, Denmark
How to cite this paper: Al-Moniee, M.A., Zhu, X.Y., Tang, L., Nuwaiser, F.I., Voigt, N.V., Sanders, P.F., Al-Abeedi, F.N. and AlHabboubi, H.H. (2016) Validation of Autonomous Microbe Sensor Prototype for Monitoring of Microorganisms in Injection Seawater Systems. Journal of Sensor Technology, 6, 81-100. http://dx.doi.org/10.4236/jst.2016.64007 Received: September 22, 2016 Accepted: October 21, 2016 Published: October 24, 2016 Copyright © 2016 by authors and Scientific Research Publishing Inc. This work is licensed under the Creative Commons Attribution International License (CC BY 4.0). http://creativecommons.org/licenses/by/4.0/
Open Access
Abstract Microbial growth in the water injection system is a well-known problem with severe operational and financial consequences for the petroleum industry, including microbiologically influenced corrosion (MIC), reduced injectivity, reservoir plugging, production downtime, and extensive repair costs. Monitoring of system microbiology is required in any mitigation strategy, enabling operators to apply and adjust countermeasures properly and in due time. In previous studies [1] [2], DNA staining technology with SYBR Green dye was evaluated to have a sufficient detection limit and automation potential for real-time detection of microbial activity in the Saudi Aramco injection seawater. In this study, technical requirements and design solutions were defined, and an autonomous microbe sensor (AMS) prototype was constructed, tested and optimized in the laboratory, and validated in the field for automated detection of microorganisms in the harsh Saudi Arabia desert environment and injection seawater. The AMS prototype was able to monitor and follow the general microbial status in the system, including detection of periods with increased microbial growth or decreased microbial numbers following biocide injection. The infield AMS detection limit was 105 cells/mL. The long-term field testing also identified the areas for technical improvement and optimization for further development of a more robust and better performing commercial microbial sensing device.
Keywords DNA Staining, Automated Monitoring, Autonomous Microbe Sensor, Microbial Sensor Prototype, Injection Seawater
DOI: 10.4236/jst.2016.64007 October 24, 2016
M. A. Al-Moniee et al.
1. Introduction Microbial growth in oil and gas production systems is a well-recognized problem with severe operational and financial consequences to the global oil industry. For water injection systems, the growth of microorganisms and the formation of biofilm on the pipeline’s inner surfaces and process equipment led to an array of challenges, including biofouling, injectivity loss, reservoir plugging, and microbiologically influenced corrosion (MIC) [3] [4]. A critical cornerstone in any effective mitigation strategy is the routine surveillance of the system microbiology, enabling operators to apply and adjust countermeasures accordingly. Saudi Arabian Oil Company (Saudi Aramco) has the largest water injection system in the world. The overall objective of the study is to develop an online and real-time microbial monitoring technology for the company’s injection seawater system and remotely located injection wells. In the proof of concept study [1], five single-analyte methods were evaluated in the laboratory setup for the suitability of automation for detection of microbial activity in the Saudi Aramco injection seawater. Staining of cells with DNA binding fluorescent dyes (PicoGreen and SYBR Green) [5]-[8] followed by quantification of fluorescence signals was identified as a reliable and promising single-analyte method for automated, online determination of microbial cell abundance in the injection seawater system. DNA staining technology for bacterial quantification was then evaluated for detection limit, automation potential, and temperature stability for the construction of automated sensor prototype [2]. DNA staining with SYBR Green dye was determined to be better suited for online and real-time monitoring of microbial activity [8] [9], with a detection limit of 2 × 10³ cells/mL under the optimized laboratory conditions [2]. The objective of the current study is to define the technical requirements and design solutions, construct an autonomous microbe sensor (AMS) prototype, test and validate AMS in the laboratory and field for automated detection of microorganisms in Saudi Aramco’s injection seawater, and identify the areas for technical improvement and optimization for further adaption to a commercial microbial sensing device.
2. Experimental Approaches The AMS prototype was designed to autonomously detect microorganisms in injection seawater. The prototype was controlled by an automated timer, which turns on an industrial panel computer with customized LabVIEW software [10]. The software controls the sensor operation and equipment shut down following measurements.
2.1. Technical Requirements and Design Solutions of AMS Prototype The schematic drawing of the AMS prototype is illustrated in Figure 1. The prototype strives to be automated for approximately 30 days after which the containers with the reagents, SYBR Green I, cleaning agent, and rinsing water, will need replacement. The sensor prototype design, technical requirements and solution, and automated measurement processes are described in detail next. 82
M. A. Al-Moniee et al.
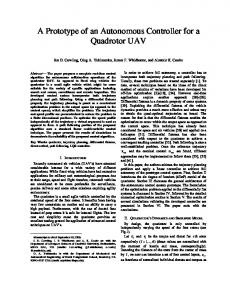
Figure 1. Schematic overview of the AMS prototype.
Sampling interphase and flow The sensor prototype is connected to the Saudi Aramco seawater injection system by a push-in connector (Figure 1(a)), which allows easy connection and replacement of the tube that transfers seawater from the pipelines to the prototype. The pressure of Saudi Aramco injection seawater sidestream entering the prototype is reduced to below 10 bar. A pressure regulator (Figure 1(b)), downstream of the push-in connecter further reduces the pressure to 0.5 bar, ensuring a stable flow into the sampling chamber (Figure 1(d)). Air entrance into the sampling chamber is minimized by a restrictor (Figure 1(c)), with a reduced diameter compared to the entrance tubing. A relatively high flow rate through the sampling chamber is maintained to ensure that fresh samples are available at all times. A 5-mL motor driven syringe (Figure 1(e)), draws a precise volume of injection seawater from the sampling chamber at selected time points for analysis.
Automated mixing of reagents In addition to sampling, the automated 5-mL syringe also controls liquid transportation and mixing of reagents in the sensor prototype. An accurate volume of SYBR Green dye (Figure 1(g)) is drawn by a high accuracy injection valve (Figure 1(f)) directly into sample stream. The sample and the dye are then mixed with the automated syringe in a mixing chamber (Figure 1(h)), and incubated before the mixture is pumped into a flow cell (Figure 1(i)), with a Z-shaped light path specifically designed for fluorescence detection and reducing background interference. 83
M. A. Al-Moniee et al.
Fluorescence reading and output A light-emitting diode lamp (Figure 1(j)), with an excitation wavelength of 490 nm was applied as a light source because of its low warm-up time and energy demand. The light entering and emitted from the flow cell was controlled by optical filters to ensure high quality fluorescence readings without background interference. Fluorescence emitted at 520 nm was detected with a robust spectrometer (Figure 1(j)). The fluorescence detector has a permanent alignment of the optical design and no need for grating adjustment so that the detector can be automatically operated without supervision. The measured fluorescence signal is automatically converted to a readable digital output, and stored in an lmv file. The file can be accessed from a computer connected to the sensor prototype, and imported or copied into Excel for analysis. The computer also has a user interphase for hardware control and monitoring of the signal output.
Flushing of system following analysis After each sample analysis, the system is applied with chemical cleaning agent (Figure 1(k)) to prevent biofouling of sensor equipment, then rinsed with sterile distilled water (Figure 1(l)) to thoroughly flush out traces of chemical reagents prior to the next sample analysis. The system cleaning and rinsing are accomplished by the 8-port valve (Figure 1(V2)) and automated syringe.
2.2. Construction of the AMS Prototype The AMS prototype was constructed with robust components for equipment functionality and durability in the challenging Saudi Arabia dessert environment and operation conditions of seawater injection system (salinity, pH, temperatures, biocides and particles) [2].
Equipment and tubing material The sensor prototype is cased in a protective dust-free box to protect components from wind, rain and dust (Figure 1(m)). The box size and doors are designed to allow manual operation, inspections and replacement of reagents. Polytetrafluoroethylene polymer tubing is selected because it has good resistance toward most organic and inorganic compounds, can be easily and efficiently cleaned by flushing, and preserves the form and diameter over long-time repetitive usage. The selection of diameter is a balance between minimizing consumption of cleaning and rinsing agent and tear on the motor in the motor-driven syringe.
Hardware and software The implemented hardware has been selected carefully to ensure reliability, stability and robustness of the sensor prototype. The software LabVIEW [10] is used to programming the user interphase and control of hardware. No temperature control is incorporated in the sensor prototype for proof-of-concept testing due to high energy demand from air-conditioning. Therefore, the prototype is programmed to shut down automatically when temperature outside the sensor is above 40˚C.
Power supply 84
M. A. Al-Moniee et al.
The sensor prototype is connected to a 230 V AC power supply. The power demands during standby are limited as only a fan and a timer are turned on. During sensor operation, the power consumption of the prototype components is 280 W in total, including syringe pump, valves, computer, and spectrometer. The components will only be turned on when needed to economize the power demand.
2.3. Laboratory and Field Validation of the AMS Prototype The constructed AMS prototype underwent thorough laboratory testing, with a focus on the detection limit and automated measurements. Following the laboratory validation, the AMS prototype was installed and operated in Saudi Aramco’s injection seawater system for short-term calibration and validation (9 days) and long-term field testing (4 months). The field testing provides information about the equipment durability, technology performance under field conditions, and future design improvement for commercialization. The flow diagram summarizes the experimental approaches in laboratory and field validation of the AMS prototype (Figure 2).
3. Results and Discussion 3.1. Laboratory Optimization and Validation of the AMS Prototype 3.1.1. Optimization for the AMS Prototype Detection Limit The initial tests with the AMS prototype showed that optimizations of the sensitivity were needed to reach the desired detection limits. The sample and SYBR Green dye in-
Figure 2. Flow diagram of experimental approaches in laboratory and field validation of the AMS prototype. 85
M. A. Al-Moniee et al.
cubation time, fluorescence detection time, and dye concentration and dosing volume were optimized. 1) Sample and Dye Incubation Time The fluorescence signal is triggered when the SYBR Green binds to DNA. The detection limit may therefore be improved by allowing more time for the dye to penetrate the microbial cells and bind to the less readily accessible intracellular DNA [5] [11] [12]. Replicas of a sample were stained for 10 - 60 minutes before the fluorescence signal was measured (Figure 3). The detected fluorescence signal illustrated that the detection limit can be improved by increasing the dye incubation time. A very long incubation time is, however, not desirable for a fast-track method. The gain was evaluated to be the highest when the sample was incubated for 40 minutes. Therefore, the optimized sample and dye incubation time is 40 minutes. 2) Fluorescence Detection Time A counter inside the detector detects all the fluorescence emitted at a specified wavelength in a given time period. The sensitivity may therefore be improved by increasing the time period over which the detector is counting (the integration time). The fluorescence signal intensity significantly increased when the fluorescence detection time was increased (Figure 4). Approximately 106 bacteria yielded a fluorescence signal intensity of 3700 and 46,000 with a detection time of 10 and 240 seconds, respectively. Therefore, the detection time of 240 seconds was applied to increase the fluorescence signal intensity, and thereby the sensitivity. 3) SYBR Green Dye Concentration and Dosing Volume Lower cell numbers could be detected when the amount of SYBR Green dye was increased [7] [9], however, the increased dye concentration also resulted in an increased fluorescence background. The best AMS prototype performance was achieved with 0.4 µL dye per 4 mL of seawater sample. The optimized dye concentration, incubation time and fluorescence signal detection time were all incorporated in the AMS software, and the new settings were tested by
Fluorescence signal intensity (a.u.)
3500 3000 2500 2000 1500 1000 500 0 10
20
30 40 Stain incubation time (minutes)
50
60
Figure 3. The fluorescence signal intensity (arbitrary units) increases when SYBR Green is allowed more time to penetrate the microbial cells. 86
Fluorescence signal intensity (a.u.)
M. A. Al-Moniee et al. 50000 45000 40000 35000 30000 25000 20000 15000 10000 5000 0 10
60 120 240 Fluorescence detection time (seconds)
240
Figure 4. The fluorescence signal intensity (arbitrary units) can be increased by increasing the fluorescence detection time. Two samples were measured for 240 seconds and the higher fluorescence signal is reproducible.
automated test runs. The results from the automated test runs were less consistent than the results from test runs where the samples were added manually. By thorough troubleshooting it was determined that the fluctuating automated results were caused by incomplete staining due to inconsistent dye dosing. Consistent fluorescence readings during automated test runs was achieved by increasing the dye volume applied for filling the dosage loop on the valve from 1 μL to 10 μL. 3.1.2. AMS Detection Limit of Microorganisms The detection limit of the AMS prototype was determined by measuring fluorescence from sterile filtered seawater (salinity 5.5%) spiked with sulfate-reducing bacteria (SRB). During the automated operation, the fluorescence signal intensity from 8 × 10⁴ cell/mL was well above the background signal intensity (Figure 5). Extrapolation of the detected fluorescence values suggests that the AMS prototype can detect down to 2 × 10⁴ cell/mL under controlled laboratory conditions. 3.1.3. Validation of Automated Measurements of Microorganisms The AMS prototype was validated by automated measurements of the fluorescence signal intensity (Figure 6, red squares) combined with 4,6-diamindino-2-phenylindole (DAPI) counting [13]-[15] at selected time points (Figure 6, green triangles). The AMS prototype was detecting the fluorescence signal of microorganisms in tap water for 24 hours, before nutrients, salts and a bacterial inoculum were added (black line). The microbial density increased rapidly following the spiking, and the maximum capacity of the detector was reached after 39 and 42 hours (data not shown). To lower the microbial numbers, the supply bottle containing the high microbial density was replaced with sterile water (blue line), and the microbial numbers in the sampling chamber decreased correspondingly. A good correlation between AMS fluorescence signal intensity and cell numbers determined by direct DAPI counting was established. 87
M. A. Al-Moniee et al.
Figure 5. Automated detection of fluorescence signal intensity (arbitrary units) in the AMS prototype correlated linearly with DAPI counts of SRB spiked in sterile filtered seawater (salinity 5.5%). Fluoresence signal
Nutrients, Bac added
Nutrients, Bac removed
Cell numbers
1.0E+06
35000 30000 25000 20000
1.0E+05
Cells mL-1
Fluorescence signal intensity (a.u.)
40000
15000 10000 5000 0
1.0E+04 0
10
20
30 Time (hours)
40
50
60
Figure 6. Automated detection of fluorescence signal intensity (arbitrary units) from microorganisms with the AMS prototype (red squares) before and following manipulations in cell numbers (green triangle). 88
M. A. Al-Moniee et al.
3.2. Short-Term Calibration and Validation of the AMS Prototype in Seawater System 3.2.1. Installation of the AMS Prototype and Field Conditions The AMS prototype was connected to a sidestream of the internally coated seawater shipping line in a water supply plant for short-term calibration and validation. The pressure of injection seawater was adjusted with two valves, one upstream the AMS and one inside the AMS. These valves ensured continuous flow through the AMS sampling chamber. The AMS was programmed to automatically turn on and collect a sample from the sampling chamber every three hour for sample measurement. The AMS prototype was also programmed to automatically shut down to protect the electrical equipment, if the humidity is below 5% or above 95%, or if the temperature is above 40˚C. Temperatures above 35˚C also have negative effect on SYBR Green staining reaction [2] [6] [8]. During the short-term field testing, the temperature and humidity were 13˚C to 34˚C and 5% to 70%, respectively, both within the acceptable range for both electrical equipment and the DNA staining technology. 3.2.2. Fluorescence Signal Measurements Three different intensity values of fluorescence signals are detected by the AMS prototype: Intensity Value Sample Water: Background signals without stain. The signal of the non stained water sample is measured to detect whether auto-fluorescent chemical components are present in the injection water. Intensity Value Zero Point: Electrical background signal from stained sample without excitation light turned on. Average Intensity Value: Signal from the stained sample with excitation light turned on. The signal depends on the amount of DNA in the sample. The fluorescence signals detected from all the samples during the short-term field trial are shown in Figure 7. The electrical background signal (red diamonds) was very stable throughout the period, with the exception of three nights during which the temperature was very low. The electric background signal of the AMS detector decreased when temperatures were below 17˚C. The temperature dependent background readings illustrated that it is important to subtract the zero-point background reading from the sample fluorescence reading to compare the biomass in different samples. The signal from the stained water samples (blue diamonds) was the highest in value detected. The fluorescence from non stained samples (green diamonds) were higher than the electrical background signal and generally increased when microorganisms was present in the sample water, corresponding to increased light scattering [16]-[18] and auto-fluorescence from proteins produced by the microorganisms [17]-[20]. 3.2.3. Validation of the AMS Prototype Measurements under Field Conditions The fluorescence intensity emitted from a stained sample in the AMS depends on the amount of DNA present in the sample, which in turn, depends on the cell size and the 89
M. A. Al-Moniee et al.
Figure 7. Measurements of the fluorescence signal intensity (arbitrary units) of Saudi Aramco’s injection seawater during the 9-day field calibration and validation by the AMS prototype. Background signals and signals from stained seawater samples were measured.
metabolic status of the cell, as an actively dividing cell contains more DNA than a dying cell [21]-[23]. Therefore, the fluorescence intensity from the AMS prototype was calibrated with microorganisms from Saudi Aramco’s injection seawater to get the most accurate conversion of the AMS fluorescence signal to the more commonly applied unit cells/mL. The conversion was achieved through the correlation of AMS fluorescence signal with actual cell numbers determined by direct DAPI staining and microscopy counting. The AMS prototype was calibrated with a serial dilution of microorganisms in Saudi Aramco’s injection seawater. A good linear correlation was achieved when the microbial numbers were plotted against the AMS fluorescence signal intensity (Figure 8). Based on the calibration curve, the fluorescence signal detected by the AMS prototype can be converted to cell numbers per mL seawater. The formula for the conversion of the AMS fluorescence signal to cells per mL is as follows: Number of cells mL−1 =
AMS Fluorescense Signal − 520 0.0007
(1)
where,
AMS = Fluorescence Signal Average Intensity Value − Intensity Value Zero Point (2) If the AMS fluorescence signal value is below 520, then the output from Equation (1) will be negative, and the AMS signal is below the detection limit, which is approximately 105 cells/mL, determined by DAPI staining. The detection limit of the AMS depends on the amount of fluorescence emitted from a cell, which in turn depends on cell size [21]-[23]. The cells from the Saudi Aramco injection seawater were very small (Figure 9(a)), compared to the cells applied for determination of the detection limit in the laboratories (Figure 9(b) and Figure 9(c)). 90
M. A. Al-Moniee et al.
Figure 8. Correlation between the AMS fluorescence signal intensity (arbitrary units) and cell numbers in the analyzed injection seawater samples determined by DAPI staining and microscopy counting.
(a)
(b)
(c)
Figure 9. Image of microbial cells stained with DAPI from (a) Saudi Aramco injection seawater, (b) Danish seawater amended with SRB and salinity, and (c) Danish tap water. The cells present in Saudi Aramco injection seawater were generally much smaller than the microorganisms applied for calibration of the AMS in Denmark. 91
M. A. Al-Moniee et al.
Therefore, the detection limit (105 cells/mL) was slightly higher than the detection limit observed in the laboratory validation (2 × 10⁴ cells/mL). Overall, a good correlation was established between the cell numbers detected by the AMS and DAPI counting (Figure 10). The cell numbers obtained were above 105 cells/mL, and the lowest value was detected the day following a biocide batch treatment (SA seawater QUU#4-1), where the AMS signal was below the detection limit. In conclusion, the AMS is evaluated to give a good measure of the microbial cell numbers present in Saudi Aramco injection seawater. The detection limit of 105 cell/mL does, however, mean that the AMS signal is expected to be below the detection limit in periods with good microbial control. 3.2.4. Evaluation of the AMS Applicability for Saudi Aramco’s Injection Seawater The cell numbers detected in the Saudi Aramco injection seawater varied from below the detection limit (BDL) to approximately 2 × 10⁶/mL (Figure 11). The data points were slightly scattered, but generally they deviated with less than a factor of 10 during the field testing. On February 17 (marked by blue line), the sidestream line was shortened with the goal to reduce the amount of iron particles entering the AMS, resulting in much less scattered data points from the AMS. This observation showed that the original scattering of the signal was most likely caused by iron particles in the system.
1.0E+07 1.0E+06
Cells mL-1
1.0E+05
AMS
1.0E+04
DAPI
1.0E+03 1.0E+02 1.0E+01 1.0E+00 Centrifuged seawater 2
Centrifuged seawater 1
SA pond seawater
SA seawater QUU#4 4
SA seawater QUU#4 3
SA seawater QUU#4 2
SA seawater QUU#4 1
Figure 10. The microbial numbers were quantified by the AMS prototype and DAPI staining. The samples analyzed were obtained from the AMS sampling chamber (SA seawater QUU#4, 1-4), SA pond seawater, and seawater concentrated by centrifugation (centrifuged seawater 1-2). 92
M. A. Al-Moniee et al.
Figure 11. The fluorescence signal intensity (arbitrary units) detected in Saudi Aramco’s injection seawater by the AMS prototype was converted to cell/mL and plotted against the sampling time.
After the scattering was reduced, a gradual increase in the amount of biomass in the seawater injection could be detected over time, reaching a cell density of ~106/mL. Furthermore, in the beginning of the field validation period, the AMS signal was frequently below the detection limit (red diamonds), which indicated that cell numbers were lower during this period and close to 105 cells/mL. The overall pattern thereby suggested an increase in the cell numbers throughout the 9-day field validation period, from ~105 cells/mL to 106 cells/mL, which corresponded extremely well with the biocide dosage regime, as the system received biocide on February 12 and 20 in the evening. Based on these observations, the DNA staining technology is applicable for detection of critical levels of microorganisms and microbial growth under Saudi Aramco’s injection seawater system.
3.3. Long-Term Field Testing of the AMS Prototype Following the initial field validation, the AMS prototype was programmed to automatically sample each day at 6 a.m., 3 p.m. and 10 p.m. and analyze the injection water for 4 months (February 21 to June 24, 2013) under regular inspection and maintenance. The AMS was also programmed to automatically turn off to protect the electronics if external temperatures are above 40˚C. Throughout the test period, the signal output from the AMS prototype could be viewed in real time on the instrument screen. Furthermore, the compiled data could subsequently be exported from the system to provide an overview of the microbial growth in the system throughout the entire monitoring period (Figure 12). Good microbial control was achieved following the biocide treatment on February 20, as the 93
M. A. Al-Moniee et al.
Figure 12. Overview of microbial cell numbers detected by the AMS prototype in Saudi Aramco’s seawater from February 12 to June 24, 2013.
high microbial numbers deceased to below the detection limit (red diamonds) within 30 hours following biocide injection. The microbial numbers reached high levels again on March 17 to 21 followed by a long period until mid-May with good microbial control. The detection of high microbial numbers followed by periods with good microbial control illustrates that the AMS prototype can be applied to survey when the microbial numbers reaches above 105 cells/mL, and evaluate microbial treatment strategies. From mid-May and until June 24, the number of microorganisms was more frequently above the detection limit of 105 cells/mL, suggesting that the elevated temperatures during the summer season increased the microbial activity and growth. In addition, the cell numbers detected during this period showed a diurnal pattern with high levels being detected in the morning and lower values in the evening. The higher morning reading was probably caused by a fast temperature increase in Saudi Arabia after sunrise at around 6a.m. If the temperature reaches 37˚C and continues to increase while the fluorescence measurements are being conducted (7 to 7:30 a.m.), the background fluorescence intensity increases (Figure 13), resulting in an overestimation of the microbial numbers in the 6 a.m. measurements (Figure 12, blue diamonds with a red perimeter) [2]. It should be noted that the AMS measurements are reliable at high temperatures if the temperature is constant. A temperature correction factor could most likely have been developed if the temperature had been measured simultaneously with the fluorescence detections. The fluorescence signal intensity in samples with a low microbial load decreased to fluorescence signal intensities lower than the background fluorescence measurements detected during the field validation period. The low fluorescence intensity was suspected to be caused by iron precipitation in the flow cell, which interfered with fluorescence readings [16] [17]. The microbial numbers detected in the seawater shipping lane by the AMS may therefore have been somewhat underestimated from the end February and onwards. These field testing experiences emphasizes the need for incorporation of an internal standard control, and the need for developing an improved cleaning procedure, to minimize the interference of iron precipitation on fluorescence measurement. The long-term field test proved that the AMS was able to operate autonomously for detecting the microbial status in Saudi Aramco’s injection seawater. Good correlation 94
AMS background fluorescence signal intensity (a.u.)
M. A. Al-Moniee et al.
8000 7000 6000 5000 4000 3000 2000 1000 0 10.0
15.0
20.0
25.0 30.0 Temperature (˚C)
35.0
40.0
45.0
Figure 13. Temperature inside the AMS plotted as a function of the background fluorescence intensity in arbitrary units (zero-point intensity values) detected by the AMS. The scattered values above 4,550 are all 6 a.m. measurements.
between the AMS prototype fluorescence signal and cell numbers in Saudi Aramco’s seawater has been established, which enabled the conversion of the AMS fluorescence signal output to cell numbers (cells/mL). The AMS detected changes in the microbial numbers, caused by increasing microbial growth (e.g., following system shutdown or during the warmer summer season) or immediate biomass decrease following biocide injection in the system. Overall, the AMS showed the system to be under good microbial control, with cell levels ranging from less than 105 to 106/mL.
3.4. Identified Challenges under Field Conditions The field testing of the AMS prototype identified areas where improvements can be made for the next generation of AMS. Below, observed challenges for the AMS operation under field conditions are described and suggestions for AMS design improvements and/or actions to overcome the challenges are proposed. 3.4.1. High Levels of Particles Saudi Aramco’s injection seawater from the coated line contained surprisingly high amounts of iron particles (ochre) for being a coated pipeline (Figure 14). This was unexpected as low particle counts previously had been reported from the seawater injection system [2]. It was suspected that the sidestream line was contributing to the high ochre load into the AMS sampling chamber, and the main interference from iron particles was alleviated by simply shortening the sidestream line. The iron particles pose a severe threat to the AMS prototype functionality as precipitations inside the flow cell may interfere with fluorescence detection by impairing exci95
M. A. Al-Moniee et al.
Figure 14. Iron particles were observed in the sampling chamber.
tation and emission light paths. No signs of fluorescence signal fading were observed during the 9-day field validation. During the long-term field testing period the fluorescence counts were, however, up to 200 to 300 counts lower than the background counts detected during the AMS lab validation. These lower counts were likely caused by iron precipitations on the glass surfaces inside the flow cell, and the microbial cell numbers detected by the AMS prototype during the long-term field testing period may have been somewhat underestimated. The iron particles also challenge the AMS sampling system as it can precipitate and cause blockage of the tubing and valves. Likewise, the larger biofilm aggregates may cause blockage. No blockage was observed during the 9-day field validation although iron particles and large biofilm fragment were observed. Tube blockage was, however, observed two times during the long-term AMS prototype testing; in one case the dye dosage system had been blocked, and in another case the supply line to the sampling chamber had been blocked. The precipitation of iron and accumulation of larger biofilm aggregates can challenge equipment durability. Preventive measures (e.g., dimensions of equipment and automated cleaning procedures) and a more thorough surveillance of equipment functionality (e.g., automated internal calibration) should therefore be considered when the next generation AMS device is constructed. Suggested actions for the next generation AMS: 96
M. A. Al-Moniee et al.
1) Optimization of cleaning procedures: The internal AMS cleaning procedure should be optimized to minimize the risk of fouling from both biofilm and iron precipitation. For instance, the formation of iron precipitations may be minimized by including acid rinsing in the AMS cleaning program. 2) Incorporation of an internal control: By incorporating an internal standard control, the operator will be able to identify whether the AMS is operating reliably. The internal control could furthermore contribute to assessing whether cleaning of the AMS flow cell is functioning as intended. 3) Optimization of fluorescence detection procedure and software: The AMS prototype data points were slightly scattered, and this could partially have been caused by the presence of biofilm fragments, as this will lead to a nonuniform distribution of cells within the water sample. The sampling procedure and software should be optimized in the next generation AMS device to minimize the scattering of data points caused by uneven cell distribution. 3.4.2. Sensitivity and Detection Limit The DNA staining technology and procedure in the AMS prototype can successfully detect when the microbial load in Saudi Aramco’s injection seawater reaches a critical level, and it can be applied to determine whether microbial control measures effectively lowers the microbial numbers. The current AMS version successfully detected periods with increasing cell numbers in seawater system (Figure 12), with a detection limit of 105cells/mL. Though this is a very low detection limit, it is higher than the detection limit observed under laboratory conditions. Furthermore, the increase in the AMS signal intensity when cell numbers increased were lower than the corresponding values observed during the laboratory validation. While the AMS sensitivity is generally high, these observations suggest that the instrument sensitivity may be even further improved. Suggested actions for the next generation AMS: 1) Optimization of cleaning procedures and incorporation of an internal control: During the long-term field testing, the sensitivity of the AMS prototype may have been decreased by precipitation of iron particles inside the AMS flow cell. The AMS operation should therefore be optimized by improved cleaning and inclusion of an internal standard control. 2) Optimization of hardware and software settings: The sensitivity of the AMS may, to a limited extent, be improved by decreasing the bleaching during fluorescence detections and by optimizing the AMS hardware such as flow cell. 3.4.3. Temperature High temperatures were expected in the desert environment, and to avoid damaging electrical components, the AMS prototype was programmed not to initiate measurements if external temperatures were above 40˚C. During the winter season, no temperature-related challenges were noticed, however, in May and June, 48% and 92% of the 3 p.m. measurements were cancelled, respectively, due to high ambient temperatures. 97
M. A. Al-Moniee et al.
During the summer months in Saudi Arabia, AMS readings in the daytime are therefore an obstacle. Another identified issue relates to temperature fluctuations taking place during the AMS signal readings. The background fluorescence intensity is decreased by temperatures below 17˚C and increased by temperatures above 37˚C, resulting in an underestimation or an overestimation of the microbial numbers, respectively. Suggested actions for the next generation AMS: 1) Incorporation of temperature correction factor: The ambient temperature should be measured simultaneously with the fluorescence measurements so that a temperature correction factor could be developed to correct for the temperature influence on the background fluorescence intensity. 2) Optimization of sampling time: It is recommended to consider preventive measures to avoid large temperature fluctuations during measurements, e.g., by optimizing the sampling time according to sunrise and shading.
4. Conclusions An AMS prototype for automatic online monitoring of microbial biomass in Saudi Aramco’s seawater injection systems was successfully developed, constructed and experimentally validated. 1) The DNA staining technology was successfully optimized and simplified to facilitate robust and reliable automation. 2) Robust technical solutions and hardware components allowed AMS prototype operation in the harsh Saudi Arabian desert environment. 3) The AMS prototype was experimentally tested and validated at laboratories with automatic sampling, DNA staining, and analysis of microbial biomass in high salinity seawater samples. 4) The AMS prototype was also successfully installed, tested, and validated at a seawater supply plant. The linear relationship of fluorescence signal and microbial numbers in the injection water was determined by parallel DAPI analysis, which enables the conversion of AMS fluorescence signal output to cell numbers (cells/mL). The infield AMS prototype detection limit was 105 cells/mL. 5) The AMS prototype was operated for four consecutive months under Saudi Aramco field conditions, with automated daily monitoring of microbial cell levels in the sidestream of seawater shipping line. The AMS prototype was able to monitor and follow the general microbial status in the system, including detection of periods with increased microbial growth or decreased microbial numbers following biocide injection.
5. Further Improvement and Way Forward The field testing of the AMS prototype has identified the areas for technical improvement and optimization for the further development of a more robust and better performing commercial AMS. Some of the improvement areas are: 98
M. A. Al-Moniee et al.
Improve cleaning procedures to minimize biofouling and iron precipitations. Incorporate an internal standard control for calibration of the fluorescence signal and validation AMS functionality. Improve detection sensitivity through application of other detector hardware and/or software modifications. Redesign the AMS software interphase, layout and data output for easy data interpretation by field personnel. Incorporate a solar power system for operating the equipment at remote locations. Investigate equipment temperature tolerance, and develop a temperature correction factor to correct for variation in detector background measurements at temperatures below 17˚C and above 37˚C.
Acknowledgements The authors would like to acknowledge the Saudi Arabian Oil Company (Saudi Aramco) for granting permission to publish this paper.
References [1]
Moniee, M.A., Juhler, S., Sørensen, K., Zhu, X.Y., Lundgaard, T., Abeedi, F.N. and Sanders, P.F. (2016) Laboratory-Scale Evaluation of Single Analyte Bacterial Monitoring Strategies in Water Injection Systems. Journal of Sensor Technology, 6, 11-26. http://dx.doi.org/10.4236/jst.2016.62002
[2]
Moniee, M.A., Zhu, X.Y., Tang, L., Juhler, S., Nuwaiser, F.I., Sanders, P.F. and Abeedi, F.N. (2016) Optimization of DNA Staining Technology for Development of Autonomous Microbe Sensor for Injection Seawater Systems. Journal of Sensor Technology, 6, 27-45. http://dx.doi.org/10.4236/jst.2016.63003
[3]
Ren, H., Wang, W., Liu, Y., Liu, S., Lou, L., Cheng, D., He, X., Zhou, X., Qiu, S., Fu, L., Liu, J. and Hu, B. (2015) Pyrosequencing Analysis of Bacterial Communities in Biofilms from Different Pipe Materials in a City Drinking Water Distribution System of East China. Applied Microbiology and Biotechnology, 99, 10713-10724. http://dx.doi.org/10.1007/s00253-015-6885-6
[4]
Moniee, M.A., Juhler, S., Sørensen, K., Abeedi, F.N., Lundgaard, T. and Sanders, P.F. (2014) A Review of Saudi Aramco’s Water Flooding System and Methods for Monitoring Microbial Activity. Proceedings of 15th Middle East Corrosion Conference, Bahrain, 2-5 February 2014, 1-19.
[5]
Dragan, A.I., Pavlovic, R., McGivney, J.B., Casas-Finet, J.R., Bishop, E.S., Strouse, R.J., Schenerman, M.A. and Geddes, C.D. (2012) SYBR Green I: Fluorescence Properties and Interaction with DNA. Journal of Fluorescence, 22, 1189-1199. http://dx.doi.org/10.1007/s10895-012-1059-8
[6]
Dragan, A.I., Casas-Finet, J.R., Bishop, E.S., Strouse, R.J., Schenerman, M.A. and Geddes, C.D. (2010) Characterization of PicoGreen Interaction with dsDNA and the Origin of Its Fluorescence Enhancement upon Binding. Biophysical Journal, 99, 3010-3019. http://dx.doi.org/10.1016/j.bpj.2010.09.012
[7]
Noble, R.T. and Fuhrman, J.A. (1998) Use of SYBR Green I for Rapid Epifluorescence Counts of Marine Viruses and Bacteria. Aquatic Microbial Ecology, 14, 113-118. http://dx.doi.org/10.3354/ame014113 99
M. A. Al-Moniee et al. [8]
Singer, V.L., Jones, L.J., Yue. S.T. and Haugland, R.P. (1997) Characterization of PicoGreen Reagent and Development of a Fluorescence-Based Solution Assay for Double-Stranded DNA Quantitation. Analytical Biochemistry, 249, 228-238. http://dx.doi.org/10.1006/abio.1997.2177
[9]
Shibata, A., Goto, Y., Saito, H., Kikuchi, T., Toda, T. and Taguchi, S. (2006) Comparison of SYBR Green I and SYBR Gold Stains for Enumerating Bacteria and Viruses by Epifluorescence Microscopy. Aquatic Microbial Ecology, 43, 223-231. http://dx.doi.org/10.3354/ame043223
[10] LabVIEW (2015) Version 15.0f2 (64-Bit). National Instruments Corporation, Austin. http://www.ni.com/labview/ [11] Marie, D., Partensky, F., Jacquet, S. and Vaulot, D. (1997) Enumeration and Cell Cycle Analysis of Natural Populations of Marine Picoplankton by Flow Cytometry Using the Nucleic Acid Stain SYBR Green I. Applied Environmental Microbiology, 63, 186-193. [12] Tranvik, L.J. (1997) Rapid Fluorometric Assay of Bacterial Density in Lake Water and Seawater. Limnology and Oceanography, 42, 1629-1634. http://dx.doi.org/10.4319/lo.1997.42.7.1629 [13] Maruyama, A. and Sunamura, M. (2000) Simultaneous Direct Counting of Total and Specific Microbial Cells in Seawater, Using a Deep-Sea Microbe as Target. Applied Environmental Microbiology, 66, 2211-2215. http://dx.doi.org/10.1128/AEM.66.5.2211-2215.2000 [14] Kapuscinski, J. (1995) DAPI: A DNA-Specific Fluorescent Probe. Biotechnic & Histochemistry, 70, 220-233. http://dx.doi.org/10.3109/10520299509108199 [15] Tarnowski, B.I., Spinale, F.G. and Nicholson, J.H. (1991) DAPI as a Useful Stain for Nuclear Quantitation. Biotechnic & Histochemistry, 66, 296-302. http://dx.doi.org/10.3109/10520299109109990 [16] Lakowicz, J.R. (2006) Instrumentation for Fluorescence Spectroscopy. In: Lakowicz, J.R., Ed., Principles of Fluorescence Spectroscopy, 3rd Edition, Springer, Berlin, 27-61. http://dx.doi.org/10.1007/978-0-387-46312-4_2 [17] Price, P.B. and Bay, R.C. (2012) Marine Bacteria in Deep Arctic and Antarctic Ice Cores: A Proxy for Evolution in Oceans over 300 Million Generations. Biogeosciences, 9, 3799-3815. http://dx.doi.org/10.5194/bg-9-3799-2012 [18] Worden, A.Z., Nolan, J.K. and Palenik, B. (2004) Assessing the Dynamics and Ecology of Marine Picophytoplankton: The Importance of the Eukaryotic Component. Limnology and Oceanography, 49, 168-179. http://dx.doi.org/10.4319/lo.2004.49.1.0168 [19] Rohde, R.A. (2009) The Development and Use of the Berkeley Fluorescence Spectrometer to Characterize Microbial Content and Detect Volcanic Ash in Glacial Ice. PhD Thesis, University of California, Berkeley. [20] Davey, H.M. and Kell, D.B. (1996) Flow Cytometry and Cell Sorting of Heterogeneous Microbial Populations: The Importance of Single-Cell Analyses. Microbiology and Molecular Biology Reviews, 60, 641-696. [21] Gasol, J.M., Zweifel, U.L., Peters, F., Fuhrman, J.A. and Hagstro, A. (1999) Significance of Size and Nucleic Acid Content Heterogeneity as Measured by Flow Cytometry in Natural Planktonic Bacteria. Applied Environmental Microbiology, 65, 4475-4483. [22] Sgorbati, S., Barbesti, S., Citterio, S., Bestetti, G. and de Vecchi, R. (1996) Characterization of Number, DNA Content, Viability and Cell Size of Bacteria from Natural Environments Using DAPI PI Dual Staining and Flow Cytometry. Minerva Biotecnologica, 8, 9-15. [23] Gasol, J.M., del Giorgio, P.A., Massana, R. and Duarte, C.M. (1995) Active versus Inactive Bacteria: Size-Dependence in a Coastal Marine Plankton Community. Marine Ecology Progress Series, 128, 91-97. http://dx.doi.org/10.3354/meps128091 100
Submit or recommend next manuscript to SCIRP and we will provide best service for you: Accepting pre-submission inquiries through Email, Facebook, LinkedIn, Twitter, etc. A wide selection of journals (inclusive of 9 subjects, more than 200 journals) Providing 24-hour high-quality service User-friendly online submission system Fair and swift peer-review system Efficient typesetting and proofreading procedure Display of the result of downloads and visits, as well as the number of cited articles Maximum dissemination of your research work
Submit your manuscript at: http://papersubmission.scirp.org/ Or contact
[email protected]