VARIABLE SELECTION THROUGH GENETIC ALGORITHMS FOR CLASSIFICATION PURPOSES Silvia Cateni, Valentina Colla, Marco Vannucci PERCRO-CEIICP, Scuola Superiore S.Anna, Pisa, Italy email:
[email protected],
[email protected],
[email protected] ABSTRACT In many real world applications, when coping with classification tasks, the problem of the selection of the variables to be used for the development of any kind of classifier has to be faced. This necessity is normally due to the high number of variables which could be potentially included in the input set combined with the lack of a priori knowledge to support the selection process. In this paper variable selection is achieved by means of the use of GAs through a selection process based on the evaluation of the performance of the possible variable combinations used to train a decision tree. Furthermore the proposed method optimizes some parameters of the employed classifier. Within the proposed method several different approaches have been tested on a real industrial problem. The proposed approaches, which are characterized by different initialization and fitness functions of the GAs, obtain very satisfactory results. KEY WORDS variable selection, classification, genetic algorithms
1
Introduction
Variable selection is an important step when a multivariate analysis is treated for modeling purposes. In facts a suitable selection of informative variables improves the efficiency of the employed method [1]. Nowadays variable selection is particularly important within the industrial context as databases often contain many potential input variables for the development of the model. Classification tasks are affected by the problem of variables selection as, in the learning phase, it is fundamental to fed the classifier with a subset of all possible input variables in order to maximize its performance, which is often measured in terms of number of correctly classified patterns. An excess or lack of input variables as well as a not suitable choice of the input variables combination can be highly detrimental for the classification performance. In this paper a new method based on genetic algorithm (GAs) is described, which improves the variable selection process in a classification task and has been tested on an industrial problem. The paper is organized as follows: Sec. 2 is devoted to a review of commonly adopted methods for selecting the set of input variables for a classifier in order to maximise the classification performance.
Sec. 3 and Sec. 4 describe in detail the proposed approach. The industrial problem which has been chosen as a case–study for illustrating the performance of the proposed method is described in Sec. 5 while the obtained results are reported in Sec. 6. Finally Sec. 7 provides some concluding remarks and perspectives for the future work.
2
Variable selection for classification tasks
In many real world problems it is useful to reduce the number of involved variables especially when their number is considerable with respect to the available number of data patterns [2]. The study of variables selection is deeply investigated in literature in order to improve several classical methods, for instance for prediction and function approximation applications [3] [4], classification [5] [6] and clustering methods [7]. The variables selection methods can be divided into three fundamental categories: filter, wrapper and embedded approaches [8]. Filter methods are pre-processing approaches which do not depend on the considered learning algorithm. The variables subsets are selected by considering the relation between input and output of the system. Each input is classified on the basis on his individual pertinence with the target classes using statistical tests [9] [10]. Hall and Smith [11] illustrate a feature selection filter method which exploits a correlation based model in order to extract the suitability of the selected subset. Filter methods are relatively robust as far as the overfitting problem is concerned, but are not always capable to select the most suitable variables. The wrappers, presented by Kohavi and John [12] use the learning machine as a black box in order to select a subset of inputs according to their predictive power. This method requires more computation time than the filter method. Huang et al. [13] propose a hybrid genetic algorithm based on mutual information. The hybrid genetic algorithm is exploited as search strategy, while the mutual information between the selected variable and the previously defined classes is used as a measure of variable ranking. This method considers not only the relevance of the single selected variable but also the redundancy between it and the already selected variables. In this manner this approach merges the advantage of filter method into the wrapper framework. Another wrapper method has been developed by Marono et al. [14], where the variables are selected through a technique based on ANOVA decomposi-
tion. As wrappers use the learning machine such as a black box, they are universal and simple, but when the database includes many potential input variables, the computational time can considerably increase [15]. Embedded methods exploit the variable selection as part of training process, thus they are very efficient [16]. In fact this methods are similar to wrappers but are less computationally expensive and less prone to overfitting. The variable selection phase is not separated from the learning machine [17]. In [18] a novel method called ESFCS is proposed, which is inspired by the wrapped method SFS (Sequential Forward Selection) [19] and incrementally adds the most relevant features through suitably defined mass functions. This approach has been applied for the classification of audio signals.
3
GAs for variable selection for classification purposes
The focus of the present work is the classification through decision trees: therefore GAs have been used both for the selection of variables to be fed as inputs to a decision tree [20] and for the choice of the pruning level [21] of the decision tree itself. Pruning is an operation performed on decision trees which cuts unnecessary branches: this operation usually improves the generalization capabilities of the decision tree. The evolution of the GAs is driven by the need to maximise a fitness function (or, in an equivalent way, to minimise a “badness” index), which awards the correct classification of the patterns: some fitness function with this characteristic have been tested. Each individual of the GA population has been designed as a string which is depicted in Fig.1: the first elements (called genes within the GAs framework) are devoted to the codification of the group of selected variables while the final ones refer to the setting of the pruning level. The first part of the chromosome is formed by binary elements, where value 1 denotes the selection of the corresponding variable, while the second part of the chromosome is a real number.
which future individuals (possible solutions) will be formed. The number of individuals in the population strongly affects the computational burden related to GAs: the lower this number, the faster the procedure but with lower accuracy in the search space exploration. Within the tests carried out in the development of the proposed method, the dimension of the population varied from 30 to 50. Another parameter of the initialization function is the initial number of selected variables. In the performed tests, different rates varying from 25% to 50% have been essayed. The initial population is also filtered in order to avoid duplication of selected input variables sets: if two identical sets are pointed out, one of them is substituted. Crossover the crossover operator generates new individuals from the combination of existing (and promising) ones. The crossover operator used within this work creates the new individual by picking single genes at random from each of the two parents. Mutation Mutation creates new individuals by slightly changing some of the existing ones. The mutation operator that has been adopted in the present work randomly changes some of the genes of the chromosome devoted to the variable selection. The maximum rate of genes which can be changed is varied between 10% and 25%. Furthermore the mutation operator changes the gene corresponding to the pruning level by randomly increasing or decreasing the individual current pruning level. Stop The stop-condition indicates the condition which leads the GAs to stop. In this case a maximum number of generations is specified. At each generation, the GA evaluate the performance in terms of the fitness function of each individual and the most promising ones are selected, according to the scheme which is depicted in Fig.2.
Figure 1. The trend for ANNs of rare samples detected and false alarms with respect to the frequency of minority class in undersampled datasets.
The key features of the GAs, which, besides the fitness function, determine their behavior and efficiency, have been defined as follows: Initialization the initialization phase sets the initial population of GAs which will be evaluated and from
Figure 2. Block diagram depicting how GAs are used to select the input variables of a decision tree–based classifier.
4
Different approaches DB
Different approaches have been evaluated in order to obtain the best results: the main differences among them are related to the fitness function and the population initialization. In particular, the following configurations have been investigated and tested:
TR
1. The performance of the individuals is evaluated as the percentage of uncorrectly classified patterns ²%. Initialization is performed by including an average of 50% of the whole potential input variables as actual inputs of the decision trees. The average pruning level of the generated individuals is set to 1.5 with a minimum of 0 and a maximum of 3. The GAs performs a number of generations between 30 and 50, which result to be sufficient for the algorithm convergence. 2. A lower initial rate of input variables for the decision tree is adopted with respect to approach #1: In particular, the rate was reduced to 25% and 33%. This choice results in an average lower number of active variables in the individuals awarded by the GA evolution. Thus a simpler classifier is finally generated with potentially improved generalization capabilities. 3. In order to obtain a small set of input variables, in alternative to approach #2 the fitness function can be suitably modified. A different formulation of such function is proposed, which discourages the addition of variables to the input set if they do not significantly decrease the classification error, as follows: f itness = ²% × µ × #V ars
(1)
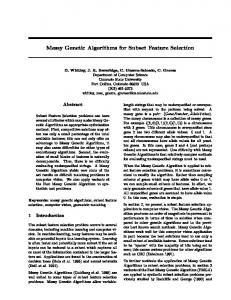
where f itness is the value of the fitness function, #V ars is the number of employed input variables and µ is a normalizing factor. 4. In order to grant stable performances of the classifier in terms of generalization capabilities, the performances of the decision tree is evaluated by also taking into account the performance achieved when classifying data that have not been used by the GA-based procedure for its construction. To this aim, the training dataset was divided into two parts: the first one was used for the building of the decision tree while the other one (the so–called evaluation set) was fed to the decision tree once it has been formed for performance evaluation, as depicted in Fig.3. The fitness is evaluated by averaging the percentage of misclassified patterns on the two above-described datasets, i.e. f itness = (²%BU ILD + ²%EV AL )/2. 5. The final approach combines approaches #3 and #4. In particular, the fitness function of eq.(1) is adopted together with the combined performance evaluation on the standard training set and on the evaluation set.
VD
GA
Tree training set
Tree evaluation set
Evaluator
Fitness Selected Variables
Figure 3. Block diagram of the classifier automatic design and training procedure which exploits two independent datasets
5
Application of the method to an industrial problem
A real world industrial application was used to test the efficiency of the described method. This application comes from the metal industry and concerns the classification of a particular kind of metal products on the basis of their quality. These products are normally divided into 5 classes on the basis of the results of some tests. The resulting classification describes the quality of the metal product and determines its suitability to the market (quality class 1 or 2) or the need for supplementary post-processing in order to eliminate defects (quality class 3 or 4) or, finally, the rejection of the product and its destination to recycling (quality class 5). Product quality is affected by a number of factors which include the metal chemical composition, the working conditions and some other properties of the product such as its dimensions. The fulfillment of the tests that are necessary for the assessment of the product quality are costly and time consuming, thus an automatic method for the classification of the products according to the same quality classes would allow considerable savings. The above-described method have been applied in order to classify the product into the 5 pre-defined classes on the basis of a series of variables that are normally recorded for each product and refer to process parameters as well as some main features of the product, such as the geometrical dimensions. For the development of such classifier a database pro-
vided by a metal company was exploited. The database contains both the quality classes and the variables affecting the classification. More in detail, the database is formed by about 600 observation and 30 potential input variables. Among these variables 23 are devoted to the characterization of product features including its dimension, shape and chemical composition while the remaining 7 refer to process parameters, i.e. values of important variables characterizing the manufacture of the product. As far as the distribution of variable classifying the final product quality is concerned, 12% of the examined products belongs to class 1, 43% to class 2, 27% to class 3, 10% to class 4 and 8% to class 5. The first attempts of building a classifier including all the possible variables did not lead to satisfactory results due to the disproportion between free model parameters and the available training patterns. The indications of expert technical personnel can be useful for a pre-selection of variables which are relavant in order to determine the final product quality, but they cannot be the unique drivers for the selection, as some mechanisms affecting the final product quality are not yet perfectly understood and the production can vary through time. Actually one of the main objectives of the overall research work consists in the development of a classifier with self-adaptation capability, that can evolve through time by coping with production changes and whose adaptation can be managed by the technical personnel without specific competencies on machine learning techniques. Therefore a method for the automatic identification of the variables which mainly affect the product quality classification was a necessary component of such system, as it allows the development of efficient classifiers even if new variables are collected and/or new products are manufactured without the need of experts enquiries for the selection of the variables to be used by the model. On the other hand, a method which points out the variables affecting product quality can contribute to increase the knowledge of the process and to provide indications for improving the manufacturing process. The approach described in section 4 was applied in order to perform this selection but some preliminary preprocessing tasks have been carried out in order to make the classifier design easier and the estimation of its effectiveness more reliable. In particular, data normalization was performed as some of the potential input variables have different order of magnitude and this aspect can affect the training procedure of the developed classifier. Moreover, the available data were divided into a training set containing 70% of all observations and a validation set containing the remaining ones. During this operation, the distribution of the quality classes in the two groups has been considered and has been made homogeneous in order to obtain the same conditions in the training and validation phases.
6
Numerical results
The results obtained by means of the above described approaches are summarized in table 1, which reports the performance of the decision trees that are trained by means of the variables selected by the GAs architecture in terms of percentage of misclassifications on the validation dataset. In the table, the number of selected inputs, the pruning level and the particular GAs configuration according to the previous list are shown as well. Method 1 2 (25%) 2 (33%) 3 4 5
# Input vars 10 7 9 8 10 7
Pruning level 2 1 2 1 2 1
²% 5.3 6 4.8 4.7 4.4 3.9
Table 1. Summary of the tests performed on the described problem: the table reports the employed method according to the desciptions provided in this section, the number of input variables and the selected pruning level.
In general the results obtained by the proposed method, in all its variants, are satisfactory, as the average misclassification error varies in the range [4%, 6%] and the number of variables selected as inputs of the classifier (from 7 to 10) is reasonable: this fact indicates that the method correctly works in the direction of a suitable selection of the available input variables. The classifier parameter selected by the GAs and representing the pruning level of the obtained decision tree is for all the performed tests 1 or 2, which is in line with the expectations and seems to be a suitable choice on the basis of the obtained results. The standard approach described at the point #1 of the list reported in the Sec.4 misclassifies the 5.3% of the tested products. Approach #2, which employs an initialization procedure aiming at the minimization of the number of selected variables according to the performed tests by selecting as inputs for the classifier one quarter of the variables in each individual of the initial population the error rises up to 6% while if one third of the variables are active in each initial individual the error reduces to 4.8%. The approach #3, which tries to limit the number of employed variables by using such number to amplify the error, improves the classifier performance with respect to the standard approach, as the error rate decreases up to 4.7%. A further improvement of the performance (i.e. a misclassification rate of 4.4%) is obtained through the approach #4, namely by means of the introduction of the evaluation set. Approach #5 reaches the best results, as the misclassification percentage decreases up to 3.9%; such value is obtained by selecting a relatively small number of input variables, i.e. 7. The proposed GA–based approach has been com-
pared to other variables selection techniques. To this aim, the attributes selection module of the WEKA (Waikato Environment for Knowledge Analysis [22]) software has been exploited. In particular, the following three different classical algorithms have been chosen: • the information gain criterion for feature selection (InfoGainAttributeEval) [23], that, for each potential input variable, computes and index of the expected reduction of information entropy that is achieved if the variable is selected. The higher the value of such index, the more relevant the input variable. • The correlation-based feature selection method [24] (CfsSubsetEval), which selects the variables that show a high correlation with the target classes and a low intercorrelation. • The Wrappers-based method (WrapperSubsetEval) [12], a method quite similar to the approach proposed here but not exploiting GAs, which bases the selection of the input variables on a learning scheme, in the present case a decision tree [20]. The first two above-described methods actually provide only a ranking of all the potential input variables according to their importance in the classification task, thus the actual selection need a further step. For the present purposes, such selection has been based on the classification performance ²% of the decision tree. Subsets of increasing number of input variables are formed by following the ranking order and once the addition of an input variable does not significantly improve the classification error, such variable is discarded together with all the variables having lower ranking. Table 6 compares the best results obtained through the proposed approach and through the above-described three methods. Method Proposed method InfoGainAttrEval CfsSubsetEval WrappSubsetEval
# Input vars 7 7 9 11
Pruning level 1 1 1 1
²% 3.9 9 5.5 5.3
Table 2. Comparison of the best classification results that were obtained through the proposed approach and other literature methods The proposed GA-based approach outperforms the other methods in terms not only of achieved misclassification error but also of reduced number of selected input variables. The information gain criterion selects as many input variables as the proposed approach, but it does not selects the same variables and it actually reaches a percentage of misclassification errors higher with respect to the GA-based approach. On the other hand, the Wrapper– based and the correlation-based feature selection methods
obtain almost the same percentage of misclassification errors (which are both higher with respect to the GA-based method), but the former one selects a reduced number of potential input variables at the price of a slightly decreasing classification performance.
7
Conclusions and future work
In this paper, the problem of the selection of the variables to be fed as inputs a decision tree for classification purposes has been faced by means of Genetic Algorithms. In many real world problems related to industry it is frequent in facts to cope with a large amount of collected variables which are potential inputs for a classification task. The proposed method simultaneously selects the input variables by means of a fitness function which favors those input sets which minimizes the error rate and sets the pruning level to be adopted within the generated decision tree. In order to maximize the efficiency of the resulting classifier, several approaches within the GAs framework have been attempted. Such approaches exploit different initializations and fitness functions with the aim of detecting a variable subset and classifier parameters which minimize the number of misclassification errors and improve the generalization capabilities of the adopted decision tree. These approaches attempt to reach this goal whether by directly penalizing the use of a high number of variables or by including unforeseen data for the evaluation of candidate solution within th GAs fitness function. The various approaches of the proposed method have been tested on an industrial problem concerning the classification of metal products quality on the basis of product features and process parameters. The obtained results are satisfactory, as the rate of misclassified products is kept in the range 4%-6%. The best performing method among the tested ones resulted to be the one which combines the approach based on the evaluation set within the GAs fitness function and the direct penalization of large sets of input variables: this methods reaches a misclassification error rate of 3.9%. The proposed method has been compared to some widely adopted variable selection methods that are suitable for classifiers based on decision trees and proved to be efficient not only because it achieves the lowest misclassification error but also because it selects the lowest number of input variables. In the future, the method will be tested on several other industrial and literature problems and the use of different types of classifiers (such as SVM and neural networks) will be evaluated. Furthermore, within these approaches, further fitness functions will be developed and tested in order to maximize the classification performance, by also considering situations where the missclassification has not the same weight from the application point of view, i.e. when the erroneous classification of patterns belonging to a particular class has more severe practical consequences with respect to the misclassifications of data belonging to the other classes.
Acknowledgments The authors wish to thank Dr. Nicola Matarese for the fruitful discussion which led to the present analysis.
References [1] R. Leardi, M. B. Seasholtz, R. J. Pell: Variable selection for multivariate calibration using a genetic algorithm: prediction of additive concentrations in polymer films from Fourier transform infrared spectral data, Analytica Chimica Acta ,N 461, Elsevier, pp.189–200, 2002. [2] A. Guilln, D. Sovilj and A. Lendasse: Minimising the delta test for variable selection in regression problems, International Journal High Performance Systems Architecture, Vol.1, N 4 , 2008. [3] D. A. Sofge and D.L. Elliot: Improved Neural Modeling of Real-World Systems using Genetic Algorithm based Variable Selection, Proocedings Conference on Neural Networks and Brain, Oct 1998. [4] D.A. Sofge: Using Genetic Algorithm Based Variable Selection to Improve Neural Network Models for Real-World Systems, Proocedings of the 2002 International Conference on Machine Learning and Applications, 2002 [5] N. Kwak, C.H. Choi: Input feature selection for classification problems, IEEE Trans. On Neural Networks, Vol. 13, pp. 143-159, 2002. [6] J.Y. Lin, H.R Ke, B.C. Chien, W.P. Yang: Classifier design with feature selection and feature extraction using layered genetic programming, Expert System with Applications, N. 34, pp. 1384-1393, 2008. [7] S. Wang and J. Zhu: Variable selection for modelbased high dimensional clustering and its application to microarray data, Biometrics N.64, pp.440-448, June 2008. [8] S. Dudoit, J. Fridlyand, T.P. Speed: Comparison of discrimination methods for the classification of tumors using gene expression data, J. Am. Statist. Assoc. 97 (2002) 77–87. [9] Z. Zhu, Y. S. Ong and M. Dash: Markov blanketembedded genetic algorithm for gene selection, Pattern Recognition, N 40, pp. 3236-3248, 2007. [10] R. N. Khushaba, A. Al-Ani and A. A Al-Jumaily: Differential Evolution based Feature Subset Selection, 19th International Conference on Pattern Recognition, ICPR 2008, December 8-11, 2008, Tampa, Florida USA.
[11] M. A. Hall and L. A. Smith: Feature Subset Selection : A Correlation Based Filter Approach, Springer, 1997. [12] R. Kohavi, G.H. John: Wrappers for feature subset selection, Artificial Intelligence N 97, pp. 273-324, 1997. [13] J. Huang, Y. Cai and X. Xu: A Wrapper for Feature Selection based on Mutual Information, 18th International Conference on Pattern recognition, 20 - 24 August 2006, Hong Kong. [14] N.S. Marono, A.A. Betanzos and E. Castillo: A new wrapper method for feature subset selection, European Symposium on Artificial Neural Network, Bruges, 27-29 April 2005. [15] A. Blum and P.Langley: Selection of relevant features and examples in machine learning, Artificial Intelligence, pp.245-271, 1997. [16] I. Guyon and A. Elisseeff: An introduction to variable and feature selection, Journal of Machine Learning Research, N3, pp. 1157-1182, 2003. [17] Holland, J.H.: Adaptation in Natural and Artificial Systems, University of Michigan press, Ann Arbor, MI, 1975. [18] Z.Xiao, E. Dellandrea, W. Dou and L. Chen: ESFS: A new embedded feature selection method based on SFS, Rapports de recherch, September 2008. [19] L.Daza and E.Acuna: Feature Selection Based On a Data Quality Measure, Proceedings of the World Congress on Engineering 2008, Vol 2,WCE 2008, July 2-4, 2008, London, U.K.. [20] J.R. Quinlan: C4.5 Programs for Machine Learning, Morgan Kauffmann Publishers, 1993. [21] Kearns, M. J. Mansour, Y. : A Fast, Bottom-up Decision Tree Pruning algorithm with Near-Optimal generalization , In Proceedings of the 15 th International Conference on Machine Learning, 1998. [22] M. Hall, E. Frank, G. Holmes, B. Pfahringer, P Reutemann, Ian H. Witten: The WEKA Data Mining Software: An Update. SIGKDD Explorations, Volume 11, Issue 1. [23] C. S. Dhirl, N. Iqball, and Soo-Young Lee: Efficient feature selection based on information gain criterion for face recognition. Proceedings of the 2007 International Conference on Information Acquisition, July 9-11, 2007, Jeju City, Korea. [24] M. A. Hall: Correlation-based Feature Subset Selection for Machine Learning. Hamilton, New Zealand. (1998).