[Downloaded from www.aece.ro on Saturday, September 12, 2015 at 06:54:12 (UTC) by 195.49.254.25. Redistribution subject to AECE license or copyright.]
Advances in Electrical and Computer Engineering
Volume 15, Number 1, 2015
Anomaly Detection Using Power Signature of Consumer Electrical Devices Cosmin CERNAZANU-GLAVAN, Marius MARCU Politehnica University of Timisoara, Timisoara, 300006, Romania
[email protected],
[email protected] 1
Abstract—The use of the smart grid for developing intelligent applications is a current trend of great importance. One advantage lies in the possibility of direct monitoring of all devices connected to the electrical network in order to prevent possible malfunctions. Therefore, this paper proposes a method for an automatic detection of the malfunctioning of lowintelligence consumer electrical devices. Malfunctioning means any deviation of a household device from its normal operating schedule. The method is based on a comparison technique, consisting in the correlation between the current power signature of a device and an ideal signature (the standard signature provided by the manufacturer). The first step of this method is to achieve a simplified form of power signature which keeps all the original features. Further, the signal is segmented based on the data provided by an event detection algorithm (values of the first derivatives) and each resulting component is approximated using a regression function. The final step consists of an analysis based on the correlation between the computed regression coefficients and the coefficients of the standard signal. Following this analysis all the differences are classified as a malfunctioning of the analyzed device. Index Terms—Feature extraction, Pattern matching, Signal analysis, Signal processing.
I. INTRODUCTION The increasing of the electrical network over time and the fact that it is broadly interconnected were the main reasons for the occurrence of what it is called now a smart grid. The difference between a power network and a smart grid is that the latter uses digital technology to gather information used to improve the services. [1] For this reason, we can say that one of the priorities of the new type of network is to create a link between the users and the providers of electric power. This new infrastructure allows both utility providers and third party companies to develop various applications which provide specific services to their customers [2]. These applications offer numerous possibilities of analysis of the operating mode of the power network and permit better control of energy consumption costs. Future consumer devices may be smart enough to communicate with the grid infrastructure and metering devices, describe their energy needs and select the optimum usage pattern based on the best available tariff and technical assistance and diagnosis (for this article). The goal of our work is to enable customers to receive information on the operation mode of personal electrical devices [3]. We want to extend the smart grid to the customer location and build a network of smart meters that This work has been supported by the project CHISTERA/1/01.10.2012 – ”GEMSCLAIM: GreenEr Mobile Systems by Cross LAyer Integrated energy Management”.
monitor all appliances. Today, smart meters can analyze power consumption variations of consumer devices and may send this information to the utility company. The companies use data received from their customers to generate their energy bill and predict and optimize the energy distribution load patterns. Instead, we propose collecting, storing and processing data from smart meters locally and use their power signatures for intelligent application development. The variation in time of the power consumed by an electrical device when executing a task is defined as the power signature of that device. It can be seen that, in this way, a power signature is specific to a certain device when executing a particular task. The method proposed in this paper is the automatic detection of malfunctioning for low-intelligence consumer electrical devices. Anomaly detection is made by comparing the current power signature with an ideal signature (standard signature) supplied by the manufacturer. Sections of the signal that are not identical are considered malfunctioning for the device. Given the oscillatory nature of the signal (Fig. 2) it is difficult to implement an automated method of comparison based on the original signal. For this reason it is necessary to achieve a simplified form of signal, which should retain all the essential characteristics of the original signature (values of the amplitude, variations of the frequency, changes of the first derivative, etc.). For each component, the coefficient of correlation between it and the standard components is calculated. The automated analysis is based on these values which form a correlation matrix. In the next chapter we present the main achievements in this domain, highlighting the advantages and disadvantages for each achievement. In Chapter 3, we will make a brief summary of the process for obtaining a simplified shape for the power signature. This process has been already validated and published in [4]. Chapter 4 presents the anomaly detection algorithm using the shape signal from section 3, together with the results of the experiments. The last section presents the conclusions obtained in this study. II. RELATED WORK One of the first uses of the power signature occurred in the PCB (printed circuits boards) industry. In order to differentiate whether a PCB operates normally or exhibits abnormalities, the voltage and current values were recorded during a continuous operating mode. [5] After that, these values (power signatures) were compared with a standard shape, representing the normal operating mode for the
Digital Object Identifier 10.4316/AECE.2015.01013
89 1582-7445 © 2015 AECE
[Downloaded from www.aece.ro on Saturday, September 12, 2015 at 06:54:12 (UTC) by 195.49.254.25. Redistribution subject to AECE license or copyright.]
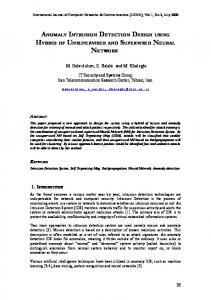
Advances in Electrical and Computer Engineering boards. The resulted differences constituted a starting point in the decision process that specifies whether there can be operated problems with the board. The monitoring process of the running mode can be done with many devices on the market [6]. Of these, the most common are Kill a Watt or Watts Up Pro (used by us to collect the data needed). Current researches are performed with the aid of complex devices. Most of them are focused on the need of low consumption of domestic users. A recent study [7] provides an interesting solution for disaggregated consumption of each electrical device used. The authors manage to extract information that ultimately leads to a solution to calculate the power consumption for each device. It should be noted that much of the research is focused on how to obtain the power signature, because the authors do not aim to make an analysis process. Starting from this, we must mention that there are numerous solutions to obtain the power signature. One of them is even suggested by the authors [8] and consists in an intelligent framework based on wireless technology for a continuous monitoring. Thus, by using a network of sensors, it is provided a remote monitoring for any type of building: from buildings to offices and private homes (Fig.1) A new solution is proposed in [9] and uses the new concept of Internet of Things (IoT) in order to speed up the process of data acquisition. In this way, the authors ensure us that it can prevent certain natural disasters and also, the transmission of information is done with a low cost. Subsequent to the monitoring and acquisition of the power signature processes there is another process which tries to analyze it. Thus, it ensures the extraction and processing of important information available in the power signature.
Volume 15, Number 1, 2015 problem of how to predict the power consumption especially for residential housing. For this purpose, it determines several categories of consumer and tries to classify every device in a certain category. A positive outcome of this approach lies in a better understanding of the power consumption by the residents. This article seeks to determine how a power signature is changed when there appears some malfunctioning of the electrical device. This is done by comparing the current power signature with an ideal signature (obtained by the manufacturer in the normal operation mode). Similar goals had as well the projects described in [11] and [12]. The research in [11] focused on two main directions: (1) the identification of a method capable to determine the load characteristics of a device and (2) several ways of signal processing needed to determine various types of workload for the analyzed device. The authors of [11] used the AC voltage and current signals and their detailed variations. In our work we used the high level digitized measured values of active power, voltage and current consumption. The authors of [12] explain the method by which there was implemented a solution used for monitoring the AC (air conditioning) devices. Using a sensor network, it is controlling several AC devices in different types of buildings. The paper is focused on the monitoring solution presentation that is mainly used for energy usage reporting and analysis. However, some power signatures of daily usage patterns for several office and consumer devices are presented and discussed. But no automatic power signature analysis is presented in [12]. An interesting analysis [13], based on power signature is made in order to detect the type of fault which can appear into an induction motor drive. The analysis attempts to separate the electrical faults cases from mechanical faults. Detecting faults in an electrical device, using different signatures (e.g. load signatures or frequency response analysis signatures) was also the goal for the authors from [14] and [15]. A practical approach of using power signature and power factor was already done by the authors in [16]. However, in this paper we want to improve the results and to extend the existing methodology. III. SIMPLIFIED FORM OF SIGNAL
Figure 1. Overall smart monitoring infrastructure
This process takes place in two parts. In the first part it is obtained a simplified form of signal that contains all the parameters of the original one. In the second part, the obtained signature form is analyzed and processed, and the results are provided. The method of obtaining the simplified form of the power signature is well presented in [4] and it will be summarized in the next chapter. There are many methods for analyzing the power signature and extracting the important information from it. We start by presenting a method for classifying domestic devices using two features: the power signature and the harmonic features. [10] This study attempts to solve the
90
In this chapter we will briefly present how to obtain a clear form of a power signature. A more detailed description of the process has already been published and validated by the authors and can be found in [4].
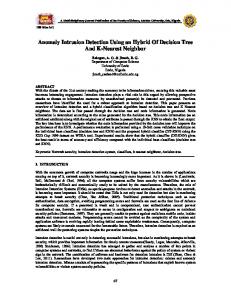
Figure 2. The power signature of a washing machine running a normal program
[Downloaded from www.aece.ro on Saturday, September 12, 2015 at 06:54:12 (UTC) by 195.49.254.25. Redistribution subject to AECE license or copyright.]
Advances in Electrical and Computer Engineering A. Filtering the signal with a low-pass filter Original signal (Fig. 2) has many oscillations due to how the power device turns on / off various electrical modules. In our case, for a washing machine, the electric motor is turned on / off every few seconds. To eliminate these oscillations, the first method of signal processing is to filter it by using a low-pass filter. The signal obtained after filtering has a clearer shape and can be more easily used, for further processing, than the original one. His form remained the same and the amplitude of oscillations was much reduced. For further reduction of oscillations in the next step we will apply the Fast Fourier Transform (FFT) to this signal. B. Applying a Fast Fourier Transform The FFT method transforms the signal from the time domain into the frequency domain. This method aims at selecting a fixed number of frequencies that are part of the signal and tries rebuilding it using only these frequencies. To reconstruct the signal, the most important frequencies must be selected together with their amplitude. The manual selection of these has led to poor results and that is why we created an automatic method to select N number of these frequencies (in descending order of their amplitude values). After this transformation, the disappearance of some oscillations that do not contain relevant information for the signal can be observed. The FFT method simplifies the signal shape but keeps constant all the values for the main components of the signal. C. Smoothing functions Into a last attempt, the following processing method tries to reduce more some of the remaining oscillations. This was achieved by using a smoothing function for the oscillations which presented large amplitudes. In our case, there are several smoothing functions that can be applied. The best results were obtained by applying a Gaussian smoothing function and these can be seen in Fig. 3 After applying this method the signal has the best shape obtained so far. This shape will be used extensively in the next chapter to make a comparison between signals. D. Extraction of other parameters From the current signal shape there must be extracted more parameters that will help later in the analysis stage. These parameters will be extracted using two methods: power spectral density (PSD) and event detection algorithm.
Volume 15, Number 1, 2015 An event detection algorithm is necessary when we search certain pieces of a signal or when we try to segment the signal in multiple parts (our case). Detection algorithm was built by calculating the first derivative for our signal. This algorithm finds all the behavioural changes that occur in signal evolution. Thus, in our case, we can see that the algorithm clearly showed the beginning / end of each event (Fig. 3). In the next chapter we will analyze the signal shape together with the rest of the parameters and we determine the signal dynamics and detect its anomalies. IV. DYNAMIC ANALYSIS OF THE SIGNAL An analysis of the entire shape of signal obtained in the previous chapter is difficult for an anomaly detection algorithm using correlation. Because of that, we decided to split the obtained shape into pieces (components) that can be analyzed more easily. Furthermore, such segmentation provides us a better localization of anomalies. A. Signal segmentation Signal segmentation is done based on the signal obtained from the event detection algorithm. A simplistic approach in this case could be: any non-zero value of the signal could be seen as a change in the behaviour of the device. The higher the value, the greater change has occurred in signal evolution in that moment. This approach cannot be done in our case because the signal shows continuous oscillations and that is why most of the values are non-zero. Analyzing the values obtained from event detection algorithm, we chose a cutting threshold that separates a neutral area (values between [-2, 2]) for an area of interest for us. Using this threshold, the important components of the signal can be seen in Fig. 4.
Figure 4. Detection of signal components using an algorithm based on values from event detection method after applying a threshold cut
Figure 5. Detection of short time intervals where signal has a transient behaviour (anomalies) Figure 3. Event detection algorithm applied to our signal
These components succeed segmentation for a power signature signal into constituent parts. Also, the algorithm
91
[Downloaded from www.aece.ro on Saturday, September 12, 2015 at 06:54:12 (UTC) by 195.49.254.25. Redistribution subject to AECE license or copyright.]
Advances in Electrical and Computer Engineering manages to detect other short time intervals too, in which signal has a transient behaviour (Fig. 5). It can be observed the presence of these intervals in the beginning/end of the whole program and when rinsing cycle starts. Because these intervals have a short period of time, an automated analysis of them could not be done, so they were analyzed in a separate mode. The other proposed segmentation method is based on normalization of a signal according to another signal. For this method we need a previous processed signal (standard signal - considered to be a normal behaviour of the device). This signal must have segmentation intervals defined in advance by the user. Further, the normalization operation is performed in the time domain for our signal and after that, the segmentation operation is applied to time intervals obtained from the standard signal.
Volume 15, Number 1, 2015 totally wrong. The results vary from signal to signal and that is why we propose this method to be used only as a secondary one. B. Regression function for signal components Defining a regression function for each signal component is an important part of our approach because an analysis of the signal is much easier to be done in this case. Thus, a function is characterized by a reduced set of values (parameters) than a relatively large number of sample signals. For our signal, we try finding regression functions from three classes: polynomial, exponential and a combination of sinuses.
Figure 6. Segmentation using a standard signal for other two different signals Figure 8. Signal component reconstruction using exponential regression
Figure 7. Signal component reconstruction using polynomial regression
In Fig. 6 we can see the segmentation result for two signals using a standard signal. Some components have failed to be detected and for others the beginning / end are 92
Figure 9. Signal component reconstruction using combination of sinuses
For a polynomial regression variant we chose a
[Downloaded from www.aece.ro on Saturday, September 12, 2015 at 06:54:12 (UTC) by 195.49.254.25. Redistribution subject to AECE license or copyright.]
Advances in Electrical and Computer Engineering
Volume 15, Number 1, 2015
polynomial of nine degree. Using a polynomial of degree greater than nine is difficult and leads to obtaining coefficients with values less than 10-5. Fig. 7 presents the reconstruction of some of the signal components where polynomial regression functions are used. It can be seen that some signal components cannot be exactly reconstructed using polynomial functions. For the second method we used multiple regression exponential functions. The obtained results for the same components of the signal are shown in Fig. 8. In this case, the components of the signal were reconstructed even worse (component 3 could not be reconstructed). The last regression method uses a combination of sinuses (Figure 9). It can be seen from Table I that using the combination of sinuses we obtain the best results (e.g. the smallest error). Further we used this method to find the regression coefficients for each component of the signal. TABLE I. SUM OF SQUARES DUE TO ERROR FOR EACH REGRESSION METHOD Regression C1 C2 C3 method Polynomial 0.1726 564.01 4.6*106 Exponential 358.61 776.72 1.5*105 Combination of 6.7*107 268.33 3.63*105 sinuses
Figure 10. Signals used in correlation analysis. From top to bottom: Signal 1, Signal 2 and Signal 3
C. Calculation of correlation indices between two components Correlation is a statistical measure that determines the dependencies between two data sets and from our point of view; it has an important role as it highlights the relations of two signals. The correlation method is based on Pearson product-moment correlation coefficient and it is named "Pearson's Correlation". If we define two sets X and Y, the correlation coefficient ρX,Y is given by (1).
X ,Y
cov( X , Y )
XY
E X X Y Y
XY
(1)
To calculate the correlation coefficients we need two data sets of equal length. In order to do that we should determine the signal component that has the largest length (the total number of contained points). For all the remaining components will be added(at the end) multiple zero values until we get a vector of length equal to the determined maximum length. Thus, each component will be composed of a number of samples equal to the maximum length. Further, we present a correlation analysis based on three signals (see Signal 1, Signal 2 and Signal 3 from Fig. 10) Each of these three signals will be compared with the signal presented throughout this paper named the standard signal. Each component of a signal will be compared with each of the components of the standard signal. A correlation index between the two components will be calculated for each comparison. For example when we compared the Signal 1 with the Standard signal, actually we compared the 7 components found in Signal 1 with the 6 existing components in Standard signal (Figure 11). The correlation matrix resulted after comparison operation can be seen in Table II. We noted by SC i , the i component of standard signal and C j the j component of the Signal 1.
Figure 11. Top: Standard signal contains SC 1 - SC 6 components. Bottom: Signal 1 and C 1 - C 7 components
C1 C2 C3 C4 C5 C6 C7
SC 1 0.983 0.324 0.925 0.479 0.489 0.441 0.829
TABLE II CORRELATION MATRIX SC 2 SC 3 SC 4 0.315 0.685 0.330 1.000 0.159 0.468 0.315 0.811 0.349 0.600 0.469 0.548 0.741 0.611 0.483 0.871 0.592 0.397 0.487 0.881 0.412
SC 5 0.030 0.169 0.064 0.697 0.526 0.279 0.117
SC 6 -0.235 -0.088 -0.259 -0.490 -0.528 -0.410 -0.269
The last part of this chapter deals with the analysis of the values from correlation matrix and explains how an anomaly or a malfunctioning is detected. D. Correlation analysis. Determining similarity and anomaly detection It can be seen from Fig. 11 that Signal 1 is very similar to the Standard signal. This is also revealed by the matrix of correlation coefficients. Thus:
93
[Downloaded from www.aece.ro on Saturday, September 12, 2015 at 06:54:12 (UTC) by 195.49.254.25. Redistribution subject to AECE license or copyright.]
Advances in Electrical and Computer Engineering Component C 1 and C 2 from Signal 1 are very similar with the SC 1 and SC 2 components from Standard signal (0.983 respectively 1.000). That means that the washing machine works fine in the first part of the program and does not show any anomalies. Component C 3 from Signal 1 is very similar to the component SC 1 from Standard signal (0.952 similarity) but also with component SC 3 from Standard signal (0.811 similarity). This is due to the fact that the C 3 from Signal 1 has a double length (in time) than the similar component from the Standard signal. Again, we can conclude that there are no anomalies present. Component C 4 from Signal 1 has similarity with the component SC 5 from Standard signal (0.697 similarity). This means that a slightly wear of the machine is present in this part of the program. Component C 5 from Signal 1 has much similarity with the component SC 5 from Standard signal (0.741 similarity). Again, we can mention a slightly wear of the machine for this part of the program. Component C 6 from Signal 1 is very similar to the component SC 4 from Standard signal (0.871 similarity). Because all the SC 4 , SC 5 and SC 6 are part of the rinse cycles, there is not a big issue, that this component is most similar to a component other than SC 6 . Component C 7 from Signal 1 is very similar to the component SC 3 from Standard signal (0.881 similarity). This is an anomaly because the two components are part of different washing cycles. The first is from the rinse cycle and the last is from the wash cycles. Without C 7 we have a similarity value of 0.85 between Signal 1 and the Standard signal. That means a strong correlation between the two signals. An analysis for the Signal 2 showed a correlation of 0.823 between the two signals. It also revealed the existence of another component (similar with C 3 ) in this signal. This is also an anomaly and can be observed in Figure 10. The correlation for Signal 3 is only 0.793, so there are many similarities between the two signals (there is a good correlation). Also the analysis detected that the C 3 for the Standard signal does not have a counterpart component in Signal 3. The absence of a standard component represents also an anomaly.
Volume 15, Number 1, 2015 compute the degree of wear. During the correlation analysis we showed how an anomaly can be captured and analyzed based on the two existing signals. We want to further improve this method by refining the analysis part of the correlation matrix and by taking other parameters into consideration. REFERENCES [1] [2] [3] [4]
[5] [6]
[7]
[8]
[9]
[10]
[11] [12]
[13]
V. CONCLUSIONS The paper presents a method for an automatic detection of malfunctioning for low-intelligence consumer electrical devices. The method is fully automated and it is based on the analysis of the correlation matrix between the components of the signal. It managed to analyze and to determine the degree of similarity and, to find differences between two signals. The method was tested on different power signatures obtained from 10 washing machines. During testing phase, the washing machines executed both a normal program and fractions of program. The method captured the similar phases with a normal program and prompted when abnormal behaviour was present: a phase from program was skipped or presented malfunctioning. Also, based on similarity coefficients it is possible to
94
[14]
[15] [16]
R. Kazman, L. Bass, J. Ivers, and G. A. Moreno, “Architecture Evaluation without an Architecture: Experience with the Smart Grid”, 33rd International Conference of Software Engineering, May 2011. C. Laughman, K. Lee, R. Cox, S. Shaw, S. Leeb, L. Norford and P. Armstrong, “Power Signature Analysis”, Power and Energy Magazine, IEEE, Vol. 1, pp.56-63, 2003. I. Cepa, Z. Kocur, Z. Muller, “Migration of the IT Technologies to the Smart Grids”, ELEKTRONIKA IR ELEKTROTECHNIKA, pp.123128, Issue 7, 2012 M. Marcu and C. Cernazanu, “Dynamic Analysis of Electronic Devices' Power Signatures”, International Instrumentation and Measurement Technology Conference, I2MTC 2012, Graz, Austria, May 2012. I. C. Miller, “IDDQ testing in deep submicron integrated circuits”, Proceedings of International Test Conference, ITC 1999, Atlantic City, USA, Sep. 1999. K. Fehrenbacher, “10 Monitoring Tools Bringing Smart Energy Home”, Business Week, Apr. 2009, http://www.businessweek.com/technology/ content/apr2009/tc20090414446611.htm. J. Froehlich, E. Larson, S. Gupta, G. Cohn, M. S. Reynolds, and S. N. Patel, “Disaggregated End-Use Energy Sensing for the Smart Grid”, IEEE Pervasive Computing, Special Issue on Smart Energy Systems, Jan–Mar 2011. M. Marcu, C. Stangaciu, A. Topirceanu, D. Volcinschi, and V. Stangaciu, “Wireless Sensors Solution for Energy Monitoring, Analyzing, Controlling and Predicting”, Lecture Notes of the Institute for Computer Sciences, Social Informatics and Telecommunications Engineering, Volume 57, 2011. Q. Ou, Y. Zhen, X. Li, Y. Zhang, L. Zeng; , “Application of Internet of Things in Smart Grid Power Transmission”, Mobile, Ubiquitous, and Intelligent Computing (MUSIC), 2012 Third FTRA International Conference on , pp.96-100, 26-28 June 2012 S. J. Huang, C. T. Hsieh, L. K. Kuo, C. W. Lin, C. W. Chang, S. A. Fang, “Classification of home appliance electricity consumption using power signature and harmonic features”, Power Electronics and Drive Systems (PEDS), 2011 IEEE Ninth International Conference on , pp.596-599, 5-8 Dec. 2011 W. K. Lee, G. S. K. Fung, H. Y. Lam, F. H. Y. Chan, and M. Lucente, “Exploration on Load Signatures”, International Conference on Electrical Engineering, ICEE 2004, Sapporo, Japan, Jul. 2012. X. Jiang, S. Dawson-Haggerty, P. Dutta, and D. Culler, “Design and Implementation of a High-Fidelity AC Metering Network”, The 8th ACM/IEEE International Conference on Information Processing in Sensor Networks, IPSN’09, 2009, San Francisco, California, USA. M. Drif, A. J. M. Cardoso, “Stator Fault Diagnostics in Squirrel Cage Three-Phase Induction Motor Drives Using the Instantaneous Active and Reactive Power Signature Analyses”, Industrial Informatics, IEEE Transactions on , vol.10, no.2, pp.1348-1360, May 2014 T. Hassan, F. Javed, N. Arshad, “An Empirical Investigation of V-I Trajectory Based Load Signatures for Non-Intrusive Load Monitoring”, Smart Grid, IEEE Transactions on, vol.5, no.2, pp. 870878, March 2014 A. Abu-Siada, N. Hashemnia, S. Islam, M. Masoum, “Understanding power transformer frequency response analysis signatures”, Electrical Insulation Magazine, IEEE , vol.29, no.3, pp. 48-56, May 2013 M. Marcu, C. Cernazanu, “Applications of Smart Metering and Home Appliances' Power Signatures”, Instrumentation and Measurement Technology Conference (I2MTC) Proceedings, 2014 IEEE International , vol., no., pp. 331-335, 12-15 May 2014