Visualizing Asphalt Roller Trajectories in Context: Acquiring, Processing, and Representing Sensor Readings
Alexandr Nikolajevitsj Vasenev
Promotion Committee
Chairman and Secretary: Prof.dr. G. P. M. R. Dewulf
University of Twente
Promotor:
Prof.dr.ir. A. G. Dorée
University of Twente
Assistant promotor:
Dr. T. Hartmann
University of Twente
Members:
Prof.dr.ir. E. van Berkum
University of Twente
Prof.dr.ir. A. M. Adriaanse
University of Twente
Prof.dr.ir. M. König
Ruhr-Universität Bochum
Prof.dr.ir. B. de Vries
TU Eindhoven
Dr. H. Li
Cardiff University
Dr. S. R. Miller
University of Twente
VISUALIZING ASPHALT ROLLER TRAJECTORIES IN CONTEXT: ACQUIRING, PROCESSING, AND REPRESENTING SENSOR READINGS
DISSERTATION
to obtain the degree of doctor at the University of Twente, on the authority of the rector magnificus Prof.dr. H. Brinksma on account of the decision of the graduation committee, to be publicly defended on Friday the 27th of March 2015 at 16.45
by
Alexandr Nikolajevitsj Vasenev born on the 19th of May 1981 in Ivanovo, Russia
This dissertation has been approved by:
Prof.dr.ir. A.G. Dorée
University of Twente, promotor
Dr. T. Hartmann
University of Twente, assistant promotor
ISBN 978-90-365-3860-2 Copyright © 2015 by A. Vasenev (
[email protected]) All rights reserved. No part of this publication may be reproduced or transmitted in any form or by any means electronic or mechanical, including photocopying, recording, or by any information storage and retrieval system, without permission in writing from the author.
Acknowledgements Conducting this research was a valuable experience and exciting journey. I would like to thank Prof.dr.ir André G. Dorée and Dr. Timo Hartmann for this research opportunity and their recommendations. I gratefully acknowledge the financial support provided by Pioneering organization of the Twente Region of The Netherlands. I am grateful to my colleagues from the PhD aquarium. In particular, Frank, Frederick, Julieta, and Hendrik – thank you for the time we spent together. Also, of course, I am indebted to my friends and family who always support me.
v
vi
Summary Road construction companies increasingly need more advanced ways to construct and maintain asphalt roads in the changing business environment. With construction policies around the world moving towards long-term commitments, the agencies involved adopt service-level agreements that put additional pressure on construction companies. As a result, these companies need to ensure that they apply and further develop improved working practices. This is particularly relevant for construction processes that are critical for determining the lifetime of asphalt roads. One such process is asphalt compaction. During asphalt compaction roller operators move continuously over the asphalt layer distributed by a paver with the goal to compact it uniformly. The operators’ actions depend on the working environment (or, in other words, context) in which the compaction takes place. This context comprises multiple factors, including the geometry of the paved road and the temperature of the deployed asphalt mixture. The latter factor is of particular importance as asphalt temperatures characterize the viscosity of the binder in the asphalt mixture. This, in turn, defines the compactability of the layer. As such, the asphalt temperature not only makes the asphalt compaction process possible, but also restricts it. If roller operators do not act with regard to the asphalt temperature, they can damage the asphalt layer. To act adequately during the compaction process, roller operators need to have both objective information about context factors and knowledge on how to act in specific circumstances. At the same time, the information about the construction process (in particular, how equipment moves with respect to the asphalt temperature) is also of interest to other stakeholders involved in road construction. The corresponding personnel include paver operators, project managers, and quality controllers. Two challenges arise given these process specifics. Firstly, roller operators and other construction specialists should be informed objectively about the temperature distributions of deployed asphalt layers. Secondly, construction specialists should have possibility to improve their knowledge about adequate roller trajectories in context of temperature in addition to their learning by doing. Such possibilities can be provided within review sessions organized after the completion of construction projects. The two challenges are interconnected. Each includes the need to visualize how equipment moves with respect to asphalt temperatures both during and after the compaction process. Recent advances in sensing technologies and in the domain of construction informatics allow one to address both these challenges. This thesis deals with visualizing sensor readings by considering the currently available and novel visualization approaches in the domain of construction informatics. The vii
sensor readings this thesis is interested in are those that deal with asphalt compaction equipment in the context of asphalt temperature distributions. This thesis addresses the two challenges mentioned above in a structured manner by following a typical data visualization workflow formed by the steps of acquiring, processing, and representing sensor readings. This thesis accounts for known specifics of the asphalt compaction process to suggest effective methods for each of these steps. According to these aspects, the overall research question of this study was formulated as follows: “How can visualizations of sensor readings that characterize asphalt roller trajectories in the context of asphalt temperature distributions be organized to inform construction specialists about the compaction process in both close to real-time mode and after the completion of projects?” To answer this question, the thesis suggests four methods that recommend how to: (1) track the progress of construction operations with respect to information needs of different process stakeholders; (2) inform construction specialists about the initial temperature distribution of the deployed asphalt layer; (3) refine documented trajectories of construction equipment that could include outliers; and (4) represent equipment trajectories in the context of asphalt temperature to construction specialists after the completion of construction projects. These methods specifically concentrate on the information needs of roller operators. At the same time, the methods account for the possibility of informing many other process stakeholders, both during the process, and after its completion. The known specifics of the asphalt compaction process form the core of these methods. The suggested methods were iteratively developed, implemented, and tested with the help of asphalt paving specialists. The first of the developed methods suggests how to organize the acquisition of sensor readings characterizing construction equipment trajectories in context. As such, chapter two introduces a data collection and management framework to track construction operations. Here, the suggestions on how to organize data acquisition are based on domain-specific knowledge about expected information needs of different stakeholders. The data management scheme considers different levels of decision-making within a construction company and aligns them with different online and offline data processing regimes. The method also accounts for the locations of the process stakeholders who can be positioned at the construction site and/or at some distance from it. Having acquired sensor readings that characterize: (1) the context of the compaction process; and (2) the compaction equipment trajectories, then specialized procedures should be applied for further data processing. Chapter three suggests a procedure to reconstruct the initial asphalt temperature distribution by accounting for specifics of the asphalt paving process. This method reconstructs the geometry of the paved layer and its temperature distribution in an automated way. This method, together with the viii
framework suggested in chapter two can assist in developing information systems to inform operators and other construction specialists about the initial temperature distribution of the asphalt layer. Such information systems can address the first of the two outlined challenges. Chapter four concentrates on the task of processing documented trajectories of construction equipment. These can contain outliers due to the imperfections of sensing devices and disturbances brought in by the environment. These outliers need to be filtered out. The proposed filtering method, in line with other methods described in this thesis, suggests benefiting from incorporating domain-specific knowledge into data processing procedures. At the same time, the method is oriented less towards automated calculations and relies more on human reasoning. This approach considers data not only originated from sensors, but also human-generated information (“soft data”). Chapter five continues with the data visualization procedure proposing a method to represent equipment trajectories in context to construction specialists. A specialized visualization environment is proposed for this task. The environment fosters reviewing equipment trajectories in context and experimenting with alternative trajectories for the same context factors. In this way, the environment can provide possibilities to discuss conducted and consider more advanced compaction strategies. The proposed method utilizes data acquired and processed with the help of other methods proposed in this thesis. In addition to complementing other methods, chapter five demonstrates the coherence of the structure of the methods, which supports visualizing sensor readings collected during asphalt compaction processes. Together, chapters two, three, four, and five form a set of methods to address the second of the outlined challenges. Although the methods were tested mainly for the case of asphalt compaction, they may be also be of use for visualizing other construction processes that heavily rely on equipment trajectories in context. This is illustrated in chapter four. Altogether, this thesis suggests a system of methods to visualize sensor readings characterizing asphalt roller trajectories in context. The stakeholders can consider the visualizations both in close to real-time regime and after the project is completed. The package of complementary methods put forward provides several specific answers as to how to address the challenges outlined. They aim at supporting the development of the professional knowledge of construction specialists and the use of their knowledge during the asphalt compaction process. These methods contribute to a better understanding of how to acquire sensor readings characterizing construction equipment trajectories in context, process them and represent the obtained information to multiple stakeholders located both on- and off-site. The overall ambition of this research is to provide ways to assist multiple process stakeholders in making well-founded decisions on how to proceed with asphalt compaction – an essential process that directly influences the lifetime of asphalted ix
roads. Road construction companies, when they are equipped with the sort of solutions and suggestions provided in this thesis, undoubtedly can enhance their working practices and construct longer-lasting asphalt pavements.
x
Table of contents
Chapter 1. Introduction
1
1.1 Practical context .....................................................................................................2 1.1.1 Road construction: global context ....................................................................... 2 1.1.2 Overview of the asphalt compaction process and opportunities to improve it ......................................................................................................... 3 1.1.3 Motivation for this research: the need for specialized data visualization methods ............................................................................................................... 6
1.2 Theoretical context and derived research questions ..............................................8 1.2.1 Recent research on informing roller operators involved in asphalt compaction .......................................................................................................... 9 1.2.2 Approaches to acquire sensor readings characterizing construction processes .......................................................................................................... 10 1.2.3 Approaches to process collected data .............................................................. 11 1.2.4 Approaches to represent the processed data ................................................... 13
1.3 Overall research question ....................................................................................14 1.4 Research design ..................................................................................................15 1.5 Outline ..................................................................................................................17 1.6 References ...........................................................................................................21
Chapter 2. A distributed data collection and management framework for tracking construction operations
25
2.1 Introduction...........................................................................................................25 2.2 Collecting construction process-related information with sensors – A brief overview ..........................................................................................................27 2.2.1 A brief review of utilizing sensor readings in construction projects ................... 27 2.2.2 Frameworks to integrating sensor readings ...................................................... 29
2.3 The distributed data collection and management framework ...............................30 2.4 Adopted procedure to develop and test framework-based information systems..33 2.5 Illustrative operationalization of the framework for the case of asphalt paving operations...................................................................................................................34 2.5.1 Tracking remotely located construction equipment using distributed data collection and processing .......................................................................... 37
xi
2.5.2 Performing intensive computations at a centralized server to track the construction process .......................................................................................... 39 2.5.3 Applying the developed subsystems to track equipment in the field ................ 42
2.6 Discussion ............................................................................................................43 2.7 Conclusion............................................................................................................46 2.8 Acknowledgements ..............................................................................................47 2.9 References ...........................................................................................................47
Chapter 3. A procedure to reconstruct the geometry and the initial temperature distribution of an asphalted layer from sensor readings collected during the asphalt paving process
53
3.1 Introduction...........................................................................................................54 3.2 Background: overview of the available solutions and approaches to visualize asphalt temperature during paving operations ...........................................................56 3.2.1 Role of asphalt temperature distribution during the compaction process ......... 56 3.2.2 Solutions to inform equipment operators involved in asphalt paving projects about their working context .................................................................. 57 3.2.3 Existing solutions to represent the constructed asphalt layer ........................... 59 3.2.4 Data processing steps to reconstruct an object of interest from sensor readings ............................................................................................................. 61
3.3 A procedure to construct the geometry and the initial temperature distribution of an asphalted layer ..................................................................................................62 3.4 Illustrative implementation of the procedure.........................................................66 3.4.1 Hardware-related aspects of the prototype ....................................................... 66 3.4.2 Software-related elements of the developed prototype .................................... 67 3.4.3 Estimated accuracy of the prototype ................................................................. 68 3.4.4 Prototype tests .................................................................................................. 69
3.5 Discussions ..........................................................................................................72 3.5.1 Specifics and potential use of the suggested data processing procedure........................................................................................................... 72 3.5.2 Possibilities for integrating the suggested procedure into existing solutions............................................................................................................. 73 3.5.3 Limitations and future research ......................................................................... 74
3.6 Conclusions ..........................................................................................................75 3.7 Acknowledgements ..............................................................................................76 3.8 References ...........................................................................................................76 xii
Chapter 4. An information fusion approach for filtering GNSS data sets collected during construction operations
81
4.1 Introduction...........................................................................................................81 4.2 Information sources beneficial for filtering documented trajectories of construction equipment ..............................................................................................84 4.2.1 Overview of sensor-originated readings that constitute hard data .................... 84 4.2.2 Human-generated records: soft data ................................................................ 85
4.3 Fusion of information ............................................................................................86 4.4 Information fusion approach to filter trajectories of construction equipment ........87 4.5 Procedure to validate the proposed approach .....................................................90 4.6 Development of the software to filter and visualize outliers in equipment trajectories ..................................................................................................................91 4.7 Application of software .........................................................................................94 4.7.1 Data filtering in earthmoving operations ........................................................... 94 4.7.2 Data filtering in asphalt paving operations ...................................................... 100
4.8 Discussion and future work ................................................................................104 4.9 Conclusions ........................................................................................................108 4.10 Acknowledgments ............................................................................................108 4.11 References .......................................................................................................108
Chapter 5. Organizing interactive visualization environments to represent tracked and experiment with alternative equipment trajectories in the documented context of real construction projects 113 5.1 Introduction.........................................................................................................114 5.2 Background ........................................................................................................117 5.2.1 Short overview of visualization environments within the construction domain ............................................................................................................. 117 5.2.2 Illustrating the dichotomy in VE functionalities for the case of the asphalt compaction process ............................................................................ 119
5.3 A method to organize interactive visualization environments to review and simulate construction equipment trajectories ...........................................................120 5.3.1 Framework to structure interconnections between context, actions of an operator, trajectory of the construction equipment, and the impact of operations ........................................................................................................ 120
xiii
5.3.2 An overall scheme for an interactive simulation and representation visualization environment ................................................................................ 123
5.4 Procedure adopted to illustrate the suggested method ......................................125 5.5 Applying the proposed method for the case of asphalt compaction ...................126 5.5.1 “Context-actions-trajectory-outcome” framework operationalized for the case of asphalt compaction ............................................................................. 126 5.5.2 Organization scheme operationalized for the case of asphalt compaction ...................................................................................................... 127 5.5.3 Specifics of the VE implemented according to the operationalized organization scheme ....................................................................................... 130 5.5.4 Testing the developed VE ............................................................................... 132
5.6 Discussions ........................................................................................................136 5.7 Conclusions ........................................................................................................139 5.8 Acknowledgements ............................................................................................140 5.9 References .........................................................................................................140
Chapter 6. Conclusions and discussions
145
6.1 Main findings ......................................................................................................145 6.1.1 Conclusions on individual chapters ................................................................. 146 6.1.2 Overall conclusions ......................................................................................... 148 6.1.3 Main contributions to scientific literature ......................................................... 150
6.2 Practical implications ..........................................................................................152 6.2.1 Implications for information systems developers ............................................ 152 6.2.2 Implications for construction companies ......................................................... 153
6.3 Methodological reflection....................................................................................155 6.4 Limitations and suggestions for future research.................................................157 6.4.1 Characterizing the developed methods .......................................................... 157 6.4.2 Envisioned use of methods beyond the scope of asphalt compaction ........... 160 6.4.3 Limitations and future research ....................................................................... 161
6.5 References .........................................................................................................163
Publications produced within this research trajectory
165
About the author
167
xiv
Chapter 1. Introduction The role of construction equipment during construction processes is indispensable. Multiple construction process stakeholders, including equipment operators and other construction personnel, can benefit clearly from tracking and analyzing how equipment performs during their operations. Adequate visualizations can provide insights related to the progress of the construction process. These visualizations can help in reviewing how processes were conducted and also support experimenting with alternatives to the conducted processes. Given the importance of informing construction personnel about the ongoing and conducted construction processes, this thesis concentrates on visualizing sensor readings that characterize construction equipment trajectories in context. This thesis particularly deals with visualizing the asphalt compaction process when several asphalt rollers move over the deployed asphalt layer in the context of asphalt temperature distributions. Visualizing roller trajectories with respect to the context of asphalt temperature can help operators develop their knowledge on how to compact in different conditions, as well as helping them comprehending the significance of various specific conditions on-site. Objective information about equipment trajectories in the context of temperature is of interest to roller operators, construction managers, and quality control personnel. When these process stakeholders are adequately informed, they can make well-founded decisions on how to adjust the compaction process by relating their knowledge about the compaction process in general to the information about the process at hand. As such, two interconnected challenges should be considered to improve the compaction practice: (1) Roller operators and other construction specialists should be adequately informed about equipment trajectories and asphalt temperature distributions where they take place; (2) Construction specialists should have possibilities to improve their knowledge about adequate compaction strategies with respect to the asphalt temperature distributions. The latter can be done by providing opportunities to the specialists to reflect on the processes and to consider possible alternatives. This thesis proposes a set of methods to systematically address the two outlined challenges by visualizing equipment trajectories in the context of asphalt temperature distributions. These methods suggest how to acquire, process and represent sensor 1
readings to roller operators and to other construction specialists. These methods are based on known specifics of the compaction process. The visualizations provided to multiple process stakeholders by these methods are available both during the compaction process and after its completion. The proposed methods build on and contribute to the field of construction informatics. As the methods address both theoretical and practical questions, this thesis can be of interest to readers from both academia and the industry. This introduction section provides the context of the study. The rest of this section portrays the practical context and puts forward the need for specialized data visualization methods. This is followed by the theoretical context which includes four research questions. The section concludes with the research design and the outline of the thesis.
1.1 Practical context Road infrastructure is an indispensable asset for modern society. The value of the global transportation system implies that ongoing and significant investments are needed to construct and maintain asphalted roads. Current regulations demand contractors not only construct, but also maintain asphalt roads over prolonged periods of time in order to reduce public investments in the longer term. Therefore, to stay competitive, construction companies are searching for ways to construct roads with increased longevity. This requires search for possibilities to improve critical road construction processes, such as asphalt compaction. The following subsection considers these aspects in more detail.
1.1.1 Road construction: global context Road infrastructure is vital for the transportation of people and goods. For instance, in the EU, more than 73% of the total amount of inland goods in 2009 was transported by road. In comparison, rail transportation covered only about 16% of the transportation needs, while 10.4% of goods were transported by either inland waterways or pipelines [ERF, 2011]. The network of roads is an essential infrastructure asset and because of its scale and the value is (and will be) expensive to maintain. For example, public investment in highway, street, and bridge construction in Europe totals about 80 billion EUR. Asphalted roads are a major component of this system. More than 90 percent of the 5.2 million km of European paved roads and highways are surfaced with asphalt [NAPA, 2011]. This percentage can increase in the future. For instance, despite the fact that the road network in The Netherlands was already intensive, between 2009 and 2011, the total road length increased from 136,827 km to 137,692 km [World Trade 2
Bank, 2014]. In 2011 construction companies paved about 9.6 million tons of asphalt to maintain this extensive network [EAPA, 2011]. Given the amount of public investment, policy makers around the world are concerned with reducing the cost of road infrastructure maintenance. The construction reform policies move towards value and quality-driven competition, integrated team delivery, and long-term commitments [Dorée, 2004]. This trend implies wider use of service-level agreements. The adaptation of service-level agreements is expected to result in prolonged guarantee periods [Minchin et al., 2008] which would require construction companies to maintain roads that they construct longer. The prolonged guarantee periods, from the agencies’ point of view, might lead to significant savings given the increased time in-between road reconstruction activities. Generic calculations can illustrate the scale of the savings. For instance, if the road lifetime increase only by 10%, the yearly need to repair roads will be significantly reduced. This reduction can be estimated to apply to 1,252 km in The Netherlands alone [(137,692 km of Dutch roads divided by 10 years = 13,769.2 km) – (137,692 km / 11 years = 12,517.45 km)]. Assuming a cost to repair one kilometer of asphalt road is 100,000 EUR, the estimated savings are 125 million EUR/year. The yearly savings could be estimated as 4.5 billion EUR per year for the European road network of around 5 million km. Companies need to concentrate on improving processes that impact heavily on the lifetime of constructed roads to respond to demands of the road agencies and to stay competitive on the changing market. In particular, the demand for increased guarantee periods requires companies to search for intricate understanding of the asphalt paving process and the interdependencies within it [Miller et al., 2007]. The asphalt compaction process is often recognized as one of the most critical factors (or even the single most important factor) for achieving satisfactory pavement service life [Abd El Halim et al., 1993; Huerne, 2004]. Given the importance of this factor, this thesis concentrates on the asphalt compaction process. The next section describes this process in more detail and outlines the critical role of roller operators within it.
1.1.2 Overview of the asphalt compaction process and opportunities to improve it According the need to consider how the asphalt compaction process can be improved, this thesis concentrates on the asphalt compaction. Even though multiple stakeholders, including construction managers and quality control personnel, are actively involved in the asphalt compaction process, this thesis pays particular attention to roller operators. This accent is justified as the compaction process (and its outcome) strongly depends on skills and knowledge of the roller operators [Miller, 2010, p. 20]. In other words, 3
operators act based on their knowledge how to compact in specific working settings and their understanding of the concurrent conditions. This subsection briefly describes the compaction process, outlines the role of roller operators during the process, and delineates challenges that should be addressed to advance the process. The asphalt compaction process is needed during paving projects to increase the density and reduce air voids in the deployed asphalt mixture. The elimination of air voids, in particular, helps prevent the intrusion of air and water which can cause early failure in the pavement by the accelerated oxidation of the asphalt binder or the expansion of water when it freezes. The reduction in air voids and an increased density helps improve strength and impermeability. These influence the aging of the asphalt layer [Abd El Halim et al., 1993; Huerne, 2004]. The asphalt compaction process proceeds as follows: In the case of hot-mix asphalt mixtures, a paving or finishing machine deploys the mixtures at temperatures between approximately 110-150 °C [MAPA, 2011] after which the temperature decreases at a specific cooling rate which depends on ambient weather conditions, such as air temperature, wind speed, and solar radiation [Bossemeyer, 1966]. Then, several roller operators work together as a team to compact the layer. The operators control their equipment using their knowledge and awareness of the working context. The operators’ actions result in immediate changes to the speed and moving direction of their equipment which can be observed over time as equipment trajectories. The rollers should travel over the asphalt layer to compact it uniformly to a desired degree while the temperature of the mixture stays within certain limits (see [Wise & Lorio, 2004]). The temperature indicates the layer’s compactability and is a surrogate for binder viscosity which is strongly linked with the layer temperature. To reach the best outcome of the compaction process, the operators can be advised to compact the asphalt layer when its temperature is lower than 130 °C [Commuri & Zaman, 2008], higher than 70 or 80 °C [Commuri & Zaman, 2008; Alexander & Hughes, 1989], or stays between 90 and 100 °C [Floss, 2001]. Mixture designers recommend roller operators in what temperature ranges to compact particular mixtures [Sullivan & Bondt, 2009]. If asphalt is compacted outside of the suggested temperature range operators risk damaging the pavement or not reaching a desired density. For example, if the compaction process starts when the mixture is too hot, rollers will simply displace or “shove” the material, rather than compact it. If the compaction starts too late, roller operators might have to compact the layer at temperatures lower than a suggested minimum value. In this case, the texture of the surface can be impaired and some essential properties of the layer can deteriorate [Bijleveld et al., 2012]. Often, roller operators on-site rely on their subjective perceptions to consider the temperature distribution behind the paver. They consider whether the deployed asphalt mixture has a specific color, or if there is “white smoke” above the paved surface. Clearly, these proxies are likely to be inaccurate, experience-based, and variable with 4
changing conditions, for instance, during night shifts. As a result, there is need to objectively inform roller operators about the temperature distribution of the recently paved surface to overcome these deficiencies. Provided with adequate information about the temperature of the asphalt mixture, roller operators should relate their understanding of project settings to the suggestions how to compact particular mixtures in different working conditions. For instance, operators need to choose how to compact the mixture given the geometry of the road under construction. Even the compaction of a straight road can be performed in different rolling patterns [Tserng et. al., 1996]. If the road is curved, the operators might need to choose working from the inner side to the outer side throughout the turn or, alternatively, to compact in a tangential direction [Floss, 2001]. When the road geometry incorporates conjunctions or roundabouts, rolling patterns can become even more intricate. In addition to road geometry, other factors, such as changing the order of rollers within the compaction fleet, can influence operators’ choices. Altogether, a number of factors demand that the operators need make choices how to compact the layer in specific conditions. To make an adequate choice how to proceed with compaction, roller operators need to know a number of working strategies, which are suitable for different working conditions. Roller operators need to consider essential context factors of the compaction process. One of these factors is the initial asphalt temperature distribution of the deployed layer. This temperature can vary during a project. For instance, an asphalt truck can deliver asphalt mixture that is significantly colder than the previous load or a paver might need to stop and wait for the delivery of asphalt mixture. These disturbances in the mixture deployment process can cause temperature and density differentials, which can lead to the premature failure of the road pavement [Miller et al., 2011]. If roller operators are informed about the changes in the temperature distributions, they can act to avoid the negative consequences which are possible; for example, they can adjust the trajectory of their rollers and compact close to the paver to ensure that the compaction is performed within the suggested limits. Therefore, to act adequately the operators must possess information on the context of the process. Clearly then, roller operators do play a significant role during the asphalt paving process. The operators control their rollers by acting on their understanding of the process context. These actions are guided by their knowledge on how to compact in different settings and to follow suggestions on how to work with a particular mixture. As mentioned, these actions result in roller movements that can be tracked as equipment trajectories. To be effective and efficient, operators need to be informed about the working context and know how to compact in different conditions. These aspects can be formulated as two challenges that should be taken into account to improve the compaction process: (1) operators should be adequately informed about the context of their work; and 5
(2) roller operators should have possibilities to improve their knowledge. The first challenge implies the development of novel specialized information systems. The second challenge requires solutions to provide operators with possibilities to reflect on the processes: how they are conducted and what can be alternatives.
1.1.3 Motivation for this research: the need for specialized data visualization methods This thesis considers that roller operators should be informed adequately about their working context and should be provided with opportunities to consider what equipment trajectories are suitable for each specific context. The temperature distribution of a paved layer should be considered in both cases as a context factor. This subsection reviews several existing solutions relevant to these challenges from the perspective of visualizing the compaction process. Regarding the first challenge, equipment manufactures and companies specialized in data processing suggested several specialized solutions to visualize asphalt temperature distributions on-site. These solutions include, among others, the Trimble CCS900 [Trimble, 2014] and the Hamm HCQ [HAMM, 2014] systems. The Trimble CCS900 and several other similar systems are oriented to collect temperature data from sensors located on rollers and to deliver the information to the operators who control the same (or another) roller. When informed by these systems, roller operators can adjust their work according to the temperature sensed next to the rollers. In a similar way, the asphalt temperature next to the paver can be monitored using several temperature sensors (Pave-IR) [Swaner, 2010] or a line scanner [Miller et al., 2011]. These solutions assist in informing paver operators. When equipped with this information, paver operators can adjust the settings of their equipment to provide more homogeneous temperature distributions. Although the listed solutions are suitable within their scope, they lack the ability to inform roller operators about the temperature distribution sensed next to the paver. Several researchers [Glee et al., 2012; Ligier et al. 2010, p.31] have emphasized the value of informing roller operators about the temperature of the distributed asphalt layer, yet no specifics of how to organize such information transfers were suggested. The introduction of novel visualization solutions is needed to address this challenge. The second challenge concerns providing possibilities to roller operators to improve their professional knowledge. It is commonly accepted that reviewing the previously conducted processes is beneficial for process improvements and is incorporated in corresponding standards, such as the ISO 9001 [Arditi & Gunaydin, 1997]. Nevertheless, such practices are less common in the domain of asphalt compaction. One possible reason for this is the lack of suitable solutions to review conducted processes. Having solutions that allow roller operators to reflect on equipment 6
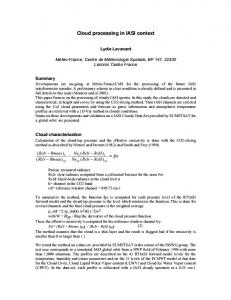
trajectories in context of temperature distributions and allowing consideration of alternative trajectories visually can improve operators’ professional knowledge. The most relevant visualization environments (VEs) for this task to date include AsphaltOpen which can assist in reviewing earlier conducted compaction processes [Miller et al., 2011] and SIMPAVE which can simulate road construction processes [Turkiyyah, 2007]. Yet, these VEs can only partially support the outlined task: AsphaltOpen does not provide possibilities to experiment with alternative compaction trajectories, while SIMPAVE does not allow a review of real processes. This thesis concentrates on the challenges as follows. First, it investigates the task of objectively informing asphalt roller operators about the temperature distribution of the deployed layer. Second, it considers how a VE can be organized to review equipment trajectories in context and to assist users in experimenting with alternative trajectories. Each of these tasks implies visualizing trajectories of asphalt rollers in the context of temperature distributions. Visualizations presented in close to real-time could assist roller operators in acting adequately in specific context. At the same time, visualizing conducted trajectories in connection with the context after completion of the compaction project is valuable, as operators (and other construction specialists) can consider the adequacy of specific trajectories with respect to the context. To make these visualizations possible, suitable data visualization methods need to be devised. Several methods are needed to visualize roller trajectories in context. The methods should cover all elements of the generic data visualization workflow: acquiring, parsing, filtering, mining, representing, refining, and interacting with the data (as listed in [Fry, 2007]). This thesis operationalizes these seven elements of the workflow as three data visualization steps. The steps correspond to methods for data acquisition, processing (which covers tasks of parsing, filtering, and mining), and representation (including tasks of representing, refining, and interacting with the data). This clustering of the workflow steps appears to be suitable as it aligns well with a typical three-tier architecture of information systems which consists of data, logic, and representation tiers. Therefore, such clustering enables a structural approach to the steps of data acquisition, processing, and representing from the perspective of information system architecture. The functions of lower data management, application processing, and representation thus become closely linked to the visualization workflow. Figure 1 represents interrelations between the challenges aligned with the methods to visualize (by acquiring, processing, and representing) equipment trajectories in context. The methods might operate either in close to real-time mode during the compaction process or after the completion of the project. The methods oriented for the real-time usage can inform roller operators on-site about their working context. Thus, they enable operators to utilize their professional knowledge effectively. The methods for postprocess visualization can guide the development of a VE solution for reviewing 7
conducted and experimenting with alternative roller trajectories in the context of previously measured temperature distributions.
Figure 1. Interrelations between the outlined challenges and data visualization steps
In addition to informing roller operators, the data acquisition, processing, and representation methods can adequately inform other stakeholders who are interested in the compaction process. These stakeholders include paver operators, project managers, and quality assurance personnel. They can all benefit clearly from the information about the temperature of the distributed layer and trajectories of asphalt rollers. With such information delivered in close to real-time mode, the project managers and paver operators could make decisions if some adjustments to the process are needed, while the quality control personnel can assess the process. In addition to supporting the work on-site, this information can be of help for planning future paving projects. For instance, careful analysis of interdependencies of the compaction process can assist strategic decision makers in planning their next projects better. Furnished with an improved understanding of the productivity issues, the planners can envision potential problems and devise solutions to mitigate them. Altogether, there is practical need for data visualization methods to adequately inform roller operators (and other construction specialists) about equipment trajectories in the context of asphalt temperature distributions. This thesis suggests such methods by building on recent advances in the domain of construction informatics. The next section reviews the relevant theoretical aspects.
1.2 Theoretical context and derived research questions The previous section outlined the need for methods to visualize compaction equipment trajectories in the context of asphalt temperature distributions. This thesis proposes methods to acquire, process, and represent sensor readings characterizing asphalt 8
roller trajectories in context to address this need. Information systems based on these methods can represent adequately the corresponding information to roller operators and other construction specialists. The methods account for known specifics of the compaction process and particular information needs of different process stakeholders from different (operational, tactical, and strategic) decision-making levels. This section continues with an overview of the relevant research efforts on utilizing sensors to visualize the asphalt compaction process. The advances in construction informatics are reviewed on how to acquire, process, and represent sensor readings. In addition, the section presents research questions of this thesis.
1.2.1 Recent research on informing roller operators involved in asphalt compaction Contemporary advances in information and communication technologies provide many opportunities to improve construction practices, in general, and the asphalt compaction process, in particular. This section briefly reviews prior work in acquiring, processing, and representing sensor readings collected during construction processes. Two recent research projects have suggested ways to acquire and process multiple sensor readings characterizing asphalt equipment movements; namely, the Computer Integrated Road Construction (CIRC) project [CIRC, 2014] and the Advanced Galileo Navigation System For Asphalts Fleet Machines (ASPHALT) project [ASPHALT, 2014]. The CIRC project aimed at developing precision systems for real-time control of the positioning of road construction equipment. These systems rely on CAD (Computer Aided Design) models established during the design phase and real-time sensor measurements. The CIRC project specifically concentrated on geometric modeling and data conversation and exchange aspects, while the topic of data representation received significantly less attention. The ASPHALT research project had a similar scope and concentrated on developing a system for machine control and fleet management to improve the quality and durability of asphalted roads. Both these projects significantly differ from this thesis. Specifically, they did not systematically approach the topic on how to visualize roller trajectories in the context of asphalt temperature. Moreover, these projects did not consider informing roller operators and other process stakeholders about the initial temperature distribution of the asphalt layer. In other words, the CIRC and ASPHALT projects only partially address the first challenge, left the second untouched. Other complementary projects have concentrated on data acquisition and processing, with research efforts focused on representing hot-mix asphalt construction processes to construction specialists. This direction was explored within the ASPARi (Asphalt Paving Research and Innovation) network prior to the beginning of the research described in this thesis. This research line is particularly relevant to the second challenge. ASPARi 9
researchers particularly sought to enrich the understanding of construction personnel of the asphalt construction processes, as well as working towards consistently reducing the variability of quality inherent in the process [Miller, 2010]. This research also developed an open source tool named AsphaltOpen [Miller et al., 2011] to make tacit knowledge of asphalt teams explicit through visualizations. As opposed to the CIRC and ASPHALT projects, the ASPARI network particularly concentrated on representing the processed information to equipment operators. At the same time, significantly less attention was paid to a systematic approach to data processing to inform multiple stakeholders in close to real-time mode. Moreover, data processing procedures were not documented explicitly and the developed visualization solutions did not allow alternatives to the documented trajectories in the asphalt temperature context to be demonstrated. Within their own scope, these research projects and the ASPARi network approach the challenges in a complementary way. However, additional efforts were needed to unite the heterogeneous research on visualizing the sensor readings collected during asphalt compaction processes. This thesis bridges this by building upon advances in data acquisition, processing, and representation. The rest of this section provides a brief overview of these advances.
1.2.2 Approaches to acquire sensor readings characterizing construction processes Recent years have seen an increase in the development of technological advances and research about how to track construction processes. Researchers have proposed several frameworks to utilize different sensors including frameworks: to organize mobile computing for information management on construction sites [Chen & Kamara, 2011; O’Brien et al., 2009]; to facilitate decision making by project managers who take corrective actions during ongoing projects [Azimi et al., 2011]; and to describe operational processes and their functional aspects [Hai et al., 2011]. At the same time, although it was acknowledged that different personnel may need different sets of information (see for instance [O’Brien et al., 2009]), no framework has been suggested yet on how to organize data acquisition to effectively support decisionmaking tasks at different organization levels within construction companies. Specifically, the question how to support decision makers at operational, tactical, and strategic decision making levels was not addressed. However, the corresponding suggestions can address the continuum of information needs within a construction company. Reuse of data can assist personnel both during the project and after its completion. Carefully collected and stored data could therefore help to assess construction operations; serve as reference during the maintenance stage; and provide datasets for future specialized visualizations. 10
For the case of asphalt compaction, acquiring and re-using sensor readings characterizing equipment trajectories in the asphalt temperature context for diverse decision makers is clearly of benefit. Therefore, the first research question of this study concerns the data acquisition step: “How can the acquisition of sensor readings characterizing equipment trajectories in the temperature context be organized to inform multiple stakeholders involved in the asphalt compaction process at operational, tactical, and strategic levels?” The suggestions on how to organize data collection and management are particularly relevant when data acquisition is considered as a first element of the data visualization procedure. The answer to this question allows to proceed with organizing (and managing) further data processing.
1.2.3 Approaches to process collected data This research approaches the task of processing sensor readings characterizing trajectories in the asphalt temperature context by dividing the data processing step into two sub-steps. These sub-steps are concerned with processing the context-related data (reconstructing temperature distributions of asphalted layers) and the equipment trajectories data. Both sub-steps can benefit from accounting for known specifics of the paving process: how the asphalt layer is typically constructed and what equipment trajectory can be expected. The two data processing sub-steps are described next.
Reconstructing temperature distributions Demonstrating initial temperature distributions to roller operators and other construction specialists can help them make well-founded decisions. The reconstructed distributions can be of use to operations on-site and also assist construction professionals in considering (after the project is completed) if equipment movements were adequate in response to the temperature distributions. The Pave-IR [Swaner, 2010] and AsphaltOpen [Miller et al., 2011] systems apparently employ specialized data processing procedures after the completion of the construction project. However, these solutions do not inform multiple stakeholders in close to real-time mode and no specific procedure to reconstruct temperature distributions was suggested. Given the lack of the methods to reconstruct initial temperature distribution of the asphalted layer, the second research question of this study is formulated as follows: “How can known specifics of asphalt paving processes be incorporated into a data processing procedure to reconstruct the initial temperature distribution of a constructed asphalt layer from multiple sensor readings?”
11
A suitable procedure, together with an adequate data acquisition framework, can address the first of the challenges – adequately informing roller operators (and other construction specialists) about the initial asphalt temperature distribution. At the same time, the procedure to reconstruct the initial temperature distribution can assist in addressing the second challenge, which is related to reviewing conducted asphalt roller trajectories and considering possible alternatives to these trajectories.
Filtering outliers in documented equipment trajectories Next to the task of reconstructing the asphalt temperature context of roller trajectories, it is also essential to ensure that the acquired equipment trajectories are suitable for future representation and analysis. Specifically, the documented trajectories should be free from eventual outliers caused by the absence, poor strength, or reflection of navigation signals. Otherwise, these outliers can hamper future data analysis or result in misleading outcomes. Statistical techniques or data fusion methods are most commonly means to filter outliers. The latter approach relies on simultaneously collecting readings from diverse types of sensors and then fusing them to cross-relate different readings automatically and remove outliers. For example, documented equipment trajectories can be corrected by fusing signals from GNSS devices and inertial measurement units [Caron et al., 2006] by utilizing dead-reckoning sensors [Peyret et al., 2000], or by applying Kalman filtering [Herrera et al., 2013; Rezaei & Sengupta, 2005]. Alternatively, or as an addition, relating the documented movements to the expected moving trajectories can be of use [Imran et al., 2006]. Nonetheless, although automated path filtering often can be beneficial, in some cases the automated methods can erroneously remove unique path segments. For instance, if equipment rapidly changed its heading direction due to obstacles on-site, the automated filtering methods can eliminate the corresponding sensor readings as outliers. Yet, preserving these readings may be valuable for assessing near-miss events. Incorporating additional information sources can account for largely unexpected, but possible, equipment movements. For instance, notes written by a human observer can be of use for such analysis. Such “soft” (human-generated records), as opposed to “hard” (sensor-based) data, can provide additional insights about the process. Incorporating human reasoning into the data filtering task can also identify specific segments of equipment trajectories that contain outliers. A possible way to approach this task is by considering information fusion principles. For instance [Blasch & Plano, 2002; Nilsson et al., 2012; Blasch & Plano, 2003], suggested involving a human expert’s reasoning into the task of information processing. However, the question how to eliminate outliers carefully in documented equipment trajectories by utilizing humancentered solutions was left underexplored. 12
As a result, incorporating additional information and human reasoning can benefit the task of processing construction equipment trajectories. Therefore, this possibility was investigated during the thesis research. In particular, the third research question of this study was framed as “How can additional information about construction processes, known specifics of these processes, and human reasoning be incorporated to benefit the task of processing equipment trajectories documented with sensors?” Once equipment trajectories have been freed from outliers and the temperature distribution of the paved layer has been reconstructed, the data representation step can start.
1.2.4 Approaches to represent the processed data The task how to review roller trajectories in context and assist in experimenting with alternative trajectories is the second challenge for this thesis. Often, reconstructing construction processes in the real world is an effortful, time-consuming and, sometimes, even dangerous task. Thus, visualization environments (VEs) are commonly used to review construction processes. For instance, specialized VEs were suggested to support planning construction site activities [Retik & Shapira, 1999], to assist in visual impact assessment of housing developments [Stojanovic et al., 2013], and to demonstrate the impact of highway construction on the public [Zanen et al., 2013]. Given the demonstrated usefulness of VEs for multiple construction-related purposes, utilizing a specialized VE to view earlier and demonstrate alternative equipment trajectories seems appropriate. As mentioned earlier, two specialized VEs to represent the asphalt compaction process have been developed earlier. The open-source software AsphaltOpen was created to represent previously conducted asphalt paving operations [Miller et al., 2011]. The SIMPAVE environment [Turkiyyah, 2007] was designed to visualize the paving process for simulation and education purposes. Despite their distinct purposes, both systems were designed to illustrate how equipment moves within the context of asphalt temperature distributions. Nonetheless, these VEs lack the ability to demonstrate alternative trajectories for real context factors. This functionality can be of use to analyze particular (real and alternative) equipment trajectories. The discussions supported by such a VE can, in turn, assist in improving professional knowledge of roller operators. The following final question of the study needs to be answered to combine the functionalities of reviewing real, and experimenting with alternative, equipment trajectories within a single VE: “How can a visualization environment be organized to represent conducted and possible alternative equipment trajectories in the context of temperature distributions?” This question, together with others, aims to address the second challenge. 13
In summary, this thesis deals with the practical needs of: (1) informing operators on-site about the initial temperature distribution of the asphalt layer; and (2) providing possibilities to improve operators’ professional knowledge by supporting tasks related to reviewing conducted and experimenting with alternative equipment trajectories in context. Both these needs account for the asphalt temperature distribution as an essential context factor. As a plausible answer to these challenges, this thesis puts forward a sequence of methods to suggest how to acquire, process, and represent sensor readings characterizing equipment trajectories with respect to this context factor.
1.3 Overall research question Given the described practical needs and the outlined theoretical context, this research suggests how to visualize sensor readings characterizing construction equipment trajectories in context of asphalt temperatures with the help of domain-specific knowledge. For this purpose, the following four research questions were formulated that correspond to the data acquisition, processing, and representation steps of the adopted data visualization workflow: 1.
How can the acquisition of sensor readings characterizing equipment trajectories in the temperature context be organized to inform multiple stakeholders involved in the asphalt compaction process at operational, tactical, and strategic levels?
2.
How can known specifics of asphalt paving processes be incorporated into a data processing procedure to reconstruct the initial temperature distribution of a constructed asphalt layer from multiple sensor readings?
3.
How can additional information about construction processes, known specifics of these processes, and human reasoning be incorporated to benefit the task of processing equipment trajectories documented with sensors?
4.
How can a visualization environment be organized to represent conducted and possible alternative equipment trajectories in the context of temperature distributions?
The overall research question of this study can be formulated as follows: “How can visualizations of sensor readings that characterize asphalt roller trajectories in the context of asphalt temperature distributions be organized to inform construction specialists about the compaction process in both close to real-time mode and after the completion of projects?”
14
The overall research question incorporates major concepts of this study. “Visualizing” can be seen as a sequence of methods of data acquisition, processing, and representation. The methods are “organized” with the help of known specifics of the asphalt compaction process by building upon and contributing to the construction informatics domain. Informing construction specialists in different modes correspond to the two challenges outlined in section 1.1.2 “Overview of the asphalt compaction process and opportunities to improve it”. Finally, “construction specialists” refer to roller operators and, to a lesser extent, to other stakeholders involved in asphalt compaction.
1.4 Research design This thesis describes a set of methods to answer the research questions and to visualize construction equipment trajectories in context to: (1) inform construction process stakeholders in close to real-time; and (2) review conducted processes and consider alternatives. This thesis elucidates specific data visualization methods by accounting for the body of knowledge of the construction informatics domain and known specifics of the asphalt compaction process.
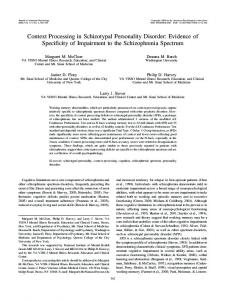
Figure 2. Technical research design: research phases include literature review and development of methods to acquire, process, and represent the processed data
The study was organized in four research phases as outlined in Figure 2. These include the initial literature review and the interactive developments of several specialized methods. 15
The initial phase concentrated on reviewing literature on the asphalt compaction process and data visualization procedures including relevant publications in academic journals (e.g. Advanced Engineering Informatics and Automation in Construction). The best available compaction practices were reviewed in relevant academic manuscripts [Miller, 2010; Huerne, 2004] and professional publications (such as the Asphalt Handbook and educational materials for roller operators). Research phases 1, 2, and 3 dealt with aspects of acquiring, processing, or representing the processed data accordingly. Each phase was concerned with applying known specifics of asphalt paving (depicted in Figure 2 as “what” questions) together with the knowledge from the construction informatics domain (formulated as “how” questions). The outcome of the research formed a set of methods that covers specific data visualization tasks. The methods suggest how to: organize data collection and management (as proposed during research phase 1); reconstruct temperature distributions of asphalted layers and filter outliers in equipment trajectories (phase 2); and represent equipment trajectories together with the temperature distribution (phase 3). Each phase benefited from insights generated during the previous phase(s). Because the intention of this research was to develop feasible methods to address practical tasks, it was essential to continuously interact with practitioners to ensure the practicality and external validity of the methods. To do so, the research adopted the combination of ethnographic principles and action research as described in [Hartmann et al., 2009]. This combination follows an iterative loop which starts with observing project routines and identifying required information flows. By discussing their observations with practitioners, the researchers consider the routines that can be supported by an information system. Then, the researchers develop and implement specialized information systems. Later, another iteration of observations, analysis, development, and implementation steps can start. The iterative prototyping approach was selected based on advantages it can provide. In particular, it can significantly enhance the likelihood of providing a system that will meet user needs, as well as facilitate both the awareness and understanding of user needs and stakeholder requirements (as noted in [INCOSE, 2007]). At the same time, in addition to collecting suggestions on how to improve the systems and the underlying methods, the involvement of participants also contributes to the construct validity [Miller, 2010, p.249].
16
Figure 3. The adopted approach to iteratively develop information systems that illustrate specific methods of data acquisition, processing, and representation
To identify structurally the information flows that can support practitioners in their routine tasks, the adopted ethnographic-action research approach was extended by incorporating the human-centered distributed information design methodology [Zhang et al., 2002]. These combined methodologies form a coherent approach as represented in Figure 3. The amalgamation of the methodologies allows to differentiate between multiple levels of analysis (user, functional, task, and representational) and to consider the contents for system implementation as a product of these analyses, which is to be implemented in an iterative way. This development of methods therefore stays in line with implementing and testing information systems that illustrated the methods. In summary, the research design was formed by four phases dedicated to literature review and the development of specialized methods to acquire, process, and represent equipment trajectories with respect to asphalt temperature distributions. The methodology accounted for the iterative development of information systems that embodied the methods. These systems were tested during real construction projects. The outcome of the research phases form the core of this thesis, as described next.
1.5 Outline This thesis is composed of four articles that have been either published or submitted for review to recognized international academic journals. The next four chapters represent these academic articles. The chapters describe the specialized methods that address the research questions. They illustrate how the methods can be utilized within 17
specialized information systems. The overall structure of the thesis with respect to the research phases is presented in Table 1. The paper-based format was chosen due to suggestions of the University of Twente to deliver theses. This approach aligns well with the author’s intention to communicate the outcome of the research with a large audience. Table 1. Structure of this thesis Research phases and major issues under consideration
Chapters of this thesis
Chapter 1. Introduction Phase 1. How to acquire sensor readings during construction projects
Chapter 2. A distributed data collection and management framework for tracking construction operations
Phase 2. How to process data characterizing roller trajectories and asphalt temperature distributions
Chapter 3. A procedure to reconstruct the geometry and the initial temperature distribution of an asphalted layer from sensor readings collected during the asphalt paving process
Phase 3. How to represent the documented and processed trajectories and support experimenting with alternative trajectories
Chapter 5. Organizing interactive visualization environments to represent tracked and experiment with alternative equipment trajectories in the documented context of real construction projects
Chapter 4. An Information fusion approach for filtering GNSS data sets collected during construction operations
Chapter 6. Conclusions and Discussions
Noticeably, the paper-based theses possess several specific characteristics, which can be observed in this thesis as well. On one side, this format can clearly indicate academic performance as is measured typically in terms of publishable articles. Also, the publication of chapters as academic articles assists in wider disseminating research results. Besides, because the academic publishing implies that the authors have to address reviewers’ suggestions, the quality of the research publications (and thus, chapters of a paper-based thesis) is improved. At the same time, article-based theses hold some drawbacks. Because academic articles need to be self-standing there are redundancies within and less well elaborated logical connections between thesis chapters. In addition, terminology across the articles can differ slightly. These factors can result in a perception that the thesis overemphasizes individual chapters, while the overall readability is reduced. Two remarks related to the text of this thesis can be noted. Firstly, to improve readability of the thesis some minor alterations were introduced to the text. In particular, the chapters received consecutive numbering of sections and the text was reformatted 18
in a coherent manner. Secondly, this thesis, similar to the articles, uses the first-person plural personal pronoun “we” throughout the text. This pronoun emphasizes that the research was conducted in a collaborative way together with other researchers who are listed at the beginning of each chapter. However, even though the collaboration indeed improved the methods and their descriptions, the author remains the main contributor and first author of the papers (as well as the introductory and conclusion chapters) that formed this thesis. The thesis is structured as follows. Chapter two portrays the specialized framework to support acquisition of sensor readings (or in other words, data collection) to form the basis for next data processing and representation methods. The framework indicates the benefits of exploiting readings originating from the same sensors, but with varying levels of detail, to inform different levels of decision-making: operational, tactical, and strategic. In this way, multiple process stakeholders obtain the possibility of tracking the progress of construction projects in close to real-time and also to review it later. Chapters three and four describe methods related to processing sensor readings characterizing equipment trajectories in context. In particular, chapter three suggests how to reconstruct the initial temperature distribution of the asphalted layer from sensor readings by applying data processing rules which account for a priori knowledge of the asphalt paving process. The data processing procedure allows to reconstruct a georeferenced model of the geometry and the temperature distribution of the deployed asphalt layer solely based on the sensor readings collected. Methods developed in chapters two and three can be used together to address the first of the outlined challenges: to inform equipment operators about the temperature distribution as an essential context factor of their work. Afterwards, chapter four describes how outliers in documented equipment trajectories can be filtered with the help of a human-centered information fusion approach. Within the approach a human expert is directly involved in filtering equipment trajectories: the expert defines the initial search parameters to identify potentially erroneous path segments and decides if the identified segments contain outliers. Next, chapter five depicts a specialized method (and a corresponding visualization environment) that enables one to represent equipment trajectories in the context of asphalt temperature distributions. The method allows to review real equipment trajectories, as well as to experiment with alternative trajectories for the same context within a gaming environment. The method builds on and benefits from the methods to acquire and process the data described in chapters two, three, and four. As a result, the visualization environment developed according to this method can provide roller operators (and other construction specialists) the possibility to discuss specific trajectories in relation to the asphalt temperature context. In this way, the set of methods addresses the second challenge (to assist in improving operators’
19
professional knowledge) by providing possibilities to explicate and discuss the knowledge of specialists involved in asphalt compaction. Finally, chapter six concludes the thesis and discusses the implications of this research with respect to both the practical and the theoretical background. The chapter also reflects on the adopted methodology.
In summary, the asphalt compaction process relies heavily on the skills and knowledge of roller operators who act alongside other stakeholders involved in asphalt paving. It is essential that these construction specialists: (1) are adequately informed about the initial temperature distribution of the asphalt layer – an essential context factor of asphalt compaction; and (2) have the possibility to improve their knowledge by reflecting on the already-conducted and alternative compaction strategies. Both these challenges can benefit from visualizing sensor readings that characterize trajectories of asphalt compaction equipment in the context of the temperature distribution of the asphalt layer. This thesis concentrates on developing several interconnected methods to acquire, process, and represent these sensor readings. The methods enable visualizing the sensor readings during the compaction process and after its completion. The corresponding visualizations are designed to inform process stakeholders located onsite and distant from the construction site. The methods build on and contribute to the field of construction informatics. These methods incorporate elements that account for known specifics of the asphalt compaction process. The suggested methods aim specifically to inform roller operators about the temperature of the distributed asphalt layer and to provide them with ways to consider conducted (and alternative) trajectories with respect to their context.
20
1.6 References Abd El Halim, A. O. Phang, and R. C. Haas (1993). "Unwanted Legacy of Asphalt Pavement Compaction." Journal of Transportation 119(6): pp. 914-932. Alexander, M. L. and C. S. Hughes (1989). "Compaction of asphalt pavement." Washington, D.C., Transportation Research Board National Research Council. Arditi, D. and H. M. Gunaydin (1997). "Total quality management in the construction process." International Journal of Project Management 15(4): 235-243. ASPHALT (2014). "Advanced Galileo Navigation System For Asphalts Fleet Machines project." http://www.asphalt-fp7.eu/, last retrieved December 2014. Azimi, R., S. Lee, S. M. AbouRizk and A. Alvanchi (2011). "A framework for an automated and integrated project monitoring and control system for steel fabrication projects." Automation in Construction 20(1): 88-97. Bijleveld, F. R., S. R. Miller, A. H. Bondt and A. G. Dorée (2012). "Too hot to handle, too cold to control - influence of compaction temperature on the mechanical properties of asphalt." in: 5th Eurasphalt and Eurobitume Congress, Istanbul, Turkey: 1 - 11. Blasch, E. P. and S. Plano (2002). "JDL level 5 fusion model ‘user refinement’ issues and applications in group tracking." in: Signal Processing, Sensor Fusion, and Target Recognition 4729: 270-279. Blasch, E. P. and S. Plano (2003). "Level 5: user refinement to aid the fusion process." in: Proc. SPIE 5099, Multisensor, Multisource Information Fusion: Architectures, Algorithms, and Applications: 288-297. Bossemeyer, H. (1966). "Temperaturverlauf beim Einbau von bituminösen Mischgut." Ph.D. Dissertation, Darmstadt. Caron, F., E. Duflos, D. Pomorski and P. Vanheeghe (2006). "GPS/IMU data fusion using multisensor Kalman filtering: introduction of contextual aspects." Information Fusion 7(2): 221-230. Chen, Y., and J. M. Kamara (2011). "A framework for using mobile computing for information management on construction sites." Automation in Construction 20(7): 776788. CIRC (2014). "Computer Integrated Road Construction project." http://cordis.europa.eu/projects/rcn/35221_en.html, last retrieved December 2014. Commuri, S. and M. Zaman (2008). "A novel neural Network-based asphalt compaction analyzer." The International Journal of Pavement Engineering 9(3): 177-188.
21
Dorée, A. G. (2004). "Collusion in the Dutch construction industry: An industrial organization perspective." Building Research & Information 32(2): 146-156. EAPA (2011). "European Asphalt Pavement Association – asphalt in figures 2011." http://www.eapa.org/userfiles/2/Asphalt%20in%20Figures/Asphalt%20in%20figures%2 029-11-2012.pdf, last retrieved December 2014. ERF (2011). "European Road Statistics, European Union Road Federation." http://www.aapaq.org/q/2012st/doc/REF/ B06_ERF_European_road_statistics_2011.pdf, last retrieved December 2014. Floss, R. (2001). "Compaction Technology in Earthwork and Highway and Transportation Engineering." Munich, BOMAG GmbH & Co. OHG. Fry, B. (2007). "Visualizing Data: Exploring and Explaining Data with the Processing Environment." O'Reilly Media. Glee, K. C., D. R. Potts, P. T. Corcoran and T. L. Rasmussen (2012). "Paving system and method." US patent, publication number US8099218 B2, publication date Jan 17, 2012. Hai, R., M. Theißen and W. Marquardt (2011). "An ontology based approach for operational process modeling." Advanced Engineering Informatics 25(4): 748-759. HAMM (2014). "HAMM compaction quality." http://www.hamm.eu/en/technologies/hcq/, last retrieved December 2014. Hartmann, T., M. Fischer and J. Haymaker (2009). "Implementing information systems with project teams using ethnographic-action research." Advanced Engineering Informatics 23(1): 57-67. Huerne, H. (2004). "Compaction of asphalt road pavements: using finite elements and critical state theory." Ph.D. Dissertation, University of Twente. Imran, M., Y. Hassan and D. Patterson (2006). "GPS–GIS-Based Procedure for Tracking Vehicle Path on Horizontal Alignments." Computer-Aided Civil and Infrastructure Engineering, 21: 383-394. INCOSE (2007). "Systems engineering handbook: a guide for system life cycle processes and activities." International Council on Systems Engineering. Ligier, A., E. Wasle and H.-J. Euler (2010). "Application definition and tech. feasibility study." https://www.mobacommunity.com/servlet/JiveServlet/download/1181-11225/ASPHALT_D.3_App_Def_V2.0.pdf last retrieved December 2014. MAPA (2014). "Minnesota Asphalt Pavement Association: Asphalt Paving Design Guide.” www.asphaltisbest.com, last retrieved December 2014.
22
Miller, S. R. (2010). "Hot mix asphalt construction : towards a more professional approach." Ph.D. Dissertation, University of Twente. Miller, S. R., H. Huerne and A. G. Dorée (2007). "Understanding asphalt compaction: an action research strategy. " in: proceedings of the seventh International Postgraduate Conference in the Built and Human Environment, International Council for Research and Innovation in Building and Construction (CIB): 456-466. Miller, S. R., T. Hartmann and A. G. Dorée (2011). "Measuring and visualizing hot mix asphalt concrete paving operations." Automation in Construction 20(4): pp. 474-481. Minchin, R. E., M. I. Hammons and Ahn J. (2008). "A construction quality index for highway construction. " Construction Management and Economics 26(12): 1313-1324. NAPA (2011). "The Asphalt Paving Industry: A Global Perspective." National Asphalt Pavement Association, European Asphalt Pavement Association, Global series 101, http://www.eapa.org/userfiles/2/Publications/GL101-2nd-Edition.pdf, last retrieved December 2014. Nilsson, M., J. V. Laere, T. Susi and T. Ziemke (2012). "Information fusion in practice: A distributed cognition perspective on the active role of users." Information Fusion 13(1): 60-78. O’Brien, W., C. Julien, S. Kabadayi, X. Luo and J. Hammer (2009). "An architecture for decision support in ad hoc sensor networks." J. Inform. Technol. Constr. 14 (2009): 309-327. Peyret, F., J. Jurasz, A. Carrel, E. Zekri and B. Gorham (2000). "The Computer Integrated Road Construction project." Automation in Construction 9(5-6): 447-461. Pulido Herrera, E., H. Kaufmann, J. Secue, R. Quirós and G. Fabregat (2013). "Improving data fusion in personal positioning systems for outdoor environments." Information Fusion 14(1): 45-56. Retik A. and A. Shapira (1999). "VR-based planning of construction site activities." Automation in Construction 8(6): 671-680. Rezaei, S. and R. Sengupta (2005). "Kalman filter based integration of DGPS and vehicle sensors for localization." in: Mechatronics and Automation, IEEE International Conference. Stojanovic V., R. Falconer, J. Isaac, D. Gilmour and D. Blackwood (2013). "Interactive visualisation to support sustainability assessment in land use scenario planning." in: Smith, S. D. (Ed.) and Ahiaga-Dagbui, D. D. (Ed.), Proceedings 29th Annual ARCOM Conference, Reading, UK, Association of Researchers in Construction Management: 1373-1382.
23
Sullivan, C. and A. H. De Bondt (2009). "Greener, leaner, meaner." Asphalt Professional, September 2009: 18-23. Swaner, K. (2010). "The PAVE-IR System: Detecting Thermal Segregation and Much More." HMAT: Hot Mix Asphalt Technology 15(6): 52-54. Trimble (2014). "Trimble CCS900 Compaction Control System." http://www.trimble.com/construction/heavy-civil/machine-control/gradecontrol/ccs900.aspx, last retrieved December 2014. Tserng, H.-P., J. S. Russell, B. K. Krishnamurthy and R. L. Schmitt (1996). "An operations planning system for asphalt pavement compaction." in: proceedings of the 13th ISARC, Tokyo, Japan: 349-358. Turkiyyah, G. (2007). "Final Technical Report TNW2007-03, SIMPAVE: Towards Building Interactive Simulations for Planning." http://www.lib.washington.edu/Msd/norestriction/b60940657.pdf, last retrieved December 2014. Wise, J. and R. Lorio (2004). "A practical guide for estimating the compaction window for thin-layer HMA." CAPSA, 8th Conference on Asphalt Paving for Southern Africa. Sun City, South Africa. World Trade Bank (2014). "Roads, total network (km)." http://data.worldbank.org/indicator/IS.ROD.TOTL.KM, last retrieved December 2014. Zanen P. P. A., T. Hartmann, S. H. S. Al-Jibouri, H. W. N. Heijmans (2013). "Using 4D CAD to visualize the impact of highway construction on the public." Automation in Construction 32:136-144. Zhang, J. J., V. L. Patel, K. A. Johnson, J. W. Smith and J. Malin (2002). "Designing human-centered distributed information systems." IEEE Intelligent Systems 17(5): 4247.
24
Chapter 2. A distributed data collection and management framework for tracking construction operations1 Construction work typically means producing on shifting locations. Moving materials, equipment and men efficiently from place to place, in and in between projects, depends on good coordination and requires specialized information systems. The key to such information systems are appropriate approaches to collect de-centralized sensor readings and to process, and distribute them to multiple end users at different locations both during the construction process and after the project is finished. This paper introduces a framework for the support of such distributed data collection and management to foster real-time data collection and processing along with the provision of opportunities to retain highly precise data for post-process analyses. In particular, the framework suggests a scheme to benefit from exploiting readings from the same sensors in varying levels of detail for informing different levels of decision making: operational, tactical, and strategic. The sensor readings collected in this way are not only potentially useful to track, assess, and analyze construction operations, but can also serve as reference during the maintenance stage. To this extent, the framework contributes to the existing body of knowledge of construction informatics. The operationality of the framework is demonstrated by developing and applying two on-site information systems to track asphalt paving operations.
2.1 Introduction Construction projects often involve a number of specialized equipment, located not only on-site, but also at distance. As the work procedures and productivity of the equipment highly depend on the location and activities of others, informing construction personnel about the project progress is an important task. In this setting, equipment operators can make decisions on how to proceed with their tasks and project managers can decide if some changes need to be introduced into the process by, for example, increasing the amount of trucks that transport construction material or adjusting the hauling route.
1
This chapter has been published as: Vasenev, A., T. Hartmann and A. G. Dorée (2014). "A distributed data collection and management framework for tracking construction operations." Advanced Engineering Informatics 28(2): 127-137.
25
Later, the documented data can be used to identify inferences between project parameters and develop suggestions about how to plan future construction projects. Consequently, in the scope of construction informatics the question how to best connect on-site sensors, process the obtained data, and provide information to spatially distributed equipment operators and site managers in real-time along with informing strategic decision makers within construction companies is essential. Though several ways to meaningfully collect readings from sensors located at construction sites were introduced earlier (see, for instance, [Leung et al., 2008] and [Chen & Kamara, 2011]), the previous approaches did not consider the purpose to collect and process sensor readings in different levels of detail to support operational, tactical, and strategic decision making. To address this gap, this paper proposes a framework that allows for distributed data collection and management acknowledging these three levels of decision making. The framework suggests to store sensor readings at different locations in different levels of detail that correspond to the sensor readings update rate. The readings, obtained with high update rate are stored at the moment of data collection. Then, the update rate of these sensor readings is reduced to support close to real-time visualizations to timely inform equipment operators and managers about the ongoing processes. Based on such visualizations, operators can decide how to perform their next activities to comply with the project pace, while the managers can decide if additional equipment should be introduced to the project. These well-founded decisions will ultimately lead to improved work productivity. Besides supplying the real-time information delivery needs, highly precise readings (with significantly higher update rate) can later be analyzed to find inferences between project-related elements. Such analysis can provide suggestions how to plan future construction projects. To illustrate the application of the framework for developing systems to track asphalt paving this paper describes the operationalization of the framework. Two frameworkbased information systems were implemented according to the dataflow and were applied for real construction projects. These instantiations demonstrated the expected functionality and were positively accepted by equipment operators and managers onsite. This paper is structured as follows: the next section briefly reviews existing technologies and approaches to collect construction-related information using sensors. Afterwards, the third section reveals the proposed distributed data collection and management framework. The fourth section delineates the research methodology adopted to apply the framework to track construction activities. Then, two illustrative information systems oriented to follow asphalt paving operations are described. The sixth section provides discussions over the proposed framework. Finally, conclusions regarding the proposed framework are drawn. 26
2.2 Collecting construction process-related information with sensors - A brief overview Recent years have seen an increase in research about how to best use automated data sensors to track on-going construction operations. At the same time, as using sensors meaningfully always requires the development of the corresponding information systems, research efforts also concentrated on development frameworks to support construction personnel in their work tasks. This section gives a short overview about recently published work in the area of automated sensing to control and support construction activities. The overview includes some of the most commonly used technologies to track construction processes: RFID tags, computer vision based sensors, and GNSS (Global Navigation Satellite System that correspond to a number of navigation solutions, such as GPS, GLONASS, and Galileo). Afterward, the section summarizes recent efforts to incorporate several on-site sensors into a single system using frameworks that aim to support construction activities that the here presented work built upon
2.2.1 A brief review of utilizing sensor readings in construction projects One of the most widely explored applications is the use of RFID tags to track construction material on-site (see for example [Razavi & Haas, 2011; Lu et al., 2011; Costin et al., 2012; Lee et al., 2013] or [Trappey & Wognum, 2011]). An example of a recent published case study in this area shows how RFID tags can assist in tracking and managing materials on water supply projects [Ren et al., 2011]. For in-depth view on the latest developments, trends, and research solutions the interested reader can refer to special issues on advances in RFID technology, such as [Cheng et al., 2010] and [Trappey & Wognum, 2011]. Essential features of the technology result in corresponding technology-specific advantages and limitations that characterize RFIDbased solutions. Thus, the RFIDs can naturally overcome previous documenting techniques, such as barcodes, by providing opportunity to store additional data in some types of RFID tags and by rejecting the need for the line-of-sight between the tag and the tag reader. However, as the effective range of tag readers is constrained, the possibility to use RFIDs in harsh environments (or to follow equipment and materials on distance) is limited. Next to the RFID technologies, computer vision sensors were effectively employed on construction sites, for example as described in [Brilakis et al., 2011; Park et al., 2011; Jog et al., 2011a; Golparvar-Fard et al., 2013]. Work in this area was, for example, concerned with developing algorithms that allow for the combination of different images and video frames [Jog et al., 2011b; Teizer & Vela, 2009] or with the evaluation of 27
different needs for accuracy of these sensors [Golparvar-Fard et al., 2011]. This theoretical work has motivated more practical applications to, for example, track the workforce on a construction site [Yang et al., 2011] or support safety management by predicting equipment operator's blind spots [Ray & Teizer, 2012a]. Researchers in the field of computer vision have also recently developed artificial intelligence based methods to, for example, classify the different actions of construction workers on-site [Gong et al., 2011a], or for productivity analysis [Gong et al., 2011b]. Another closely related strand of study related to computer vision includes research on utilizing range cameras for the purposes of the construction domain, for example for representing 3D workspace [Son & Kim, 2013] and analyzing worker posture in terms of ergonomics [Ray & Teizer, 2012b]. Altogether, the ongoing research on utilizing computer vision sensors hold promises for wider exploitation in the future, such as non-intrusive data collection technologies to track construction activities. However, some factors currently hamper everyday use of computer vision sensors. Among others, these factors include difficulties to track objects in cluttered environments and the necessity to consider weather and lighting conditions. Particularly related to this study is the research strand related to the utilization of GNSS measurements to track equipment and human movement on-site. Among others, systems to track construction activities include documenting equipment movements on asphalt paving sites [Miller et al., 2011] or automating earthwork operations for highway projects [Kim et al., 2012]. In current practice, the GNSS technologies appear to be the most common solutions to track construction activities, though their applications are also limited by the demand to maintain an unobscured line-of-sight between the receiver and satellite constellations. However, while this condition is fulfilled and the atmospheric effects are taken into account, for instance by utilizing correction signals from a base station, this type of sensors can track equipment with accuracy within the centimeter range. How to best select specific sensors to follow a construction project typically depends on the characteristics of the project at hand, the purpose of the specific information system, and limitations of particular technologies. For instance, the choice between RFID, computer vision, and GNSS technologies can be justified by site specifics. GNSS can effectively track outdoor equipment at both on-site and at distance. At the same time, to track equipment movements at construction sites on which surrounding objects obstruct GNSS signals, one could utilize RFID tags or computer vision technologies for non-intrusive tracking. However, the latter technologies are operational within a relatively short range and could demand an obscured line of view between the object and tracking devices. As a result, this need to choose specific sensors for particular operations requires the meaningfully fusion of various data streams originating from different sensors [Shahandashti et al., 2011; Pradhan et al., 2011; Voisard & Ziekow, 2012]. For 28
instance, common fusion mechanisms include combining GPS with inertial navigation sensors measurements [Akula et al., 2011] or tracking materials during construction operations by fusing RFID and GPS sensor readings [Razavi & Haas, 2010].
2.2.2 Frameworks to integrating sensor readings To address how to meaningfully combine different sensors on a more generic level, researchers recently proposed several frameworks. Some of these frameworks aim to organize mobile computing for information management on construction sites [Chen & Kamara, 2011; O’Brien et al., 2009] and how to facilitate decision making by project managers who take corrective actions during ongoing projects [Azimi et al., 2011]. Other examples include frameworks to describe operational processes and their functional aspects [Hai et al., 2011] and to consider ontologies to support development of information systems oriented to assist different management levels in making decisions [Scherer & Schapke, 2011]. While some frameworks acknowledge the need to holistically manage information in relation to different layers within construction companies, including executive management, department management, project management, site management, and construction operators (e.g. [Scherer & Schapke, 2011]., others highlight that decision makers on-site can necessitate different sets of information (see for instance [O’Brien et al., 2009]). However, to the best of our knowledge, currently no framework aims to suggest organizing information systems to effectively support decision making tasks at all these different organization levels of construction companies. To overcome this gap, this paper proposes a framework that considers the different hierarchical levels of a construction company including organizational, project, and operation levels. As decision making on each level has particular interests [Halpin & Riggs, 1992], specific characteristics of sensor readings can be of particular value at different decision making levels. Specifically, close to real-time information can support equipment operators in making well-founded operational decisions, as well as inform project managers who can control and adjust project performance, for instance by introducing additional equipment into the project. This need for close to real-time information delivery is widely acknowledged and multiple researchers suggested solutions (see for example [Leung et al., 2008; Li & Liu, 2012; Cheng et al., 2013; Song & Eldin, 2012; Akhavian & Behzadan, 2012; Liu et al., 2012]). At the same time, the outcome of the project’s performance analysis (performed in a post-processing manner) may assist managers in planning future projects. An exemplary scenario is to analyze productivity based on user queries to a database (e.g. such as in [Pradhan et al., 2011]) for estimating future equipment productivity in some regions based on already known production rates within other regions [Pradhan & Akinci, 2012]. In such ways, applying data mining techniques to 29
retrospectively analyze carefully documented construction processes can support in planning future projects or, in other words, in making strategic decisions. The outlined differentiation between close to real-time and post-processing data analysis calls for consideration how fast the collected data should be transferred and processed. This lag in delivery requires particular attention in case of close to real-time systems. Particularly, though wireless-based solutions allow to effectively track machine movements on- and off-site, for example by adopting ultra-wideband communication [Cheng et al., 2011; Saidi et al., 2011] and ad-hoc networks [Jang et al., 2012], the bandwidth of such solutions is lower than in case of wired connections. For instance, signal attenuation in case of long-range wireless transmission can lead to the expected degradation in frame rate in computer vision tracking systems [Leung et al., 2008, p.754]. As a result, to support timely delivery of close to real-time visualizations, there is a need to consider the amount of data that should be transferred, processed, and delivered to final users. As a possible way to deliver close to real-time visualizations to support the corresponding decision making tasks, the sensors' original level of detail can be decreased. Such decrease can reduce demands for transmission bandwidths and avoid processing overwhelming amounts of data. However, during reducing the rate of highly detailed data some undesirable data losses can occur that can negatively influence later post-processing data analysis. Therefore, a suitable approach should provide opportunities to avoid irreversible data losses. Altogether, to the our best knowledge currently no framework supports the distributed data collection and processing that handles sensor readings both in real-time rate with the reduced level of detail and utilizes the highly precise readings to form a single warehouse database. To address this need we developed such a framework which is outlined in the next section.
2.3 The distributed data collection and management framework The proposed distributed data collection and management framework (Figure 1) aims to support collecting, processing, and visualizing sensor readings from ongoing construction processes. The proposed framework supports both close to real-time and post-processing data analysis; provides opportunities to transfer sensor readings from numerous locations to multiple users who can track construction processes, and suggests to maintain the sensor readings in the local storage of the sensor device at construction equipment for later data analysis.
30
31
Figure 1. The proposed distributed data collection and management framework
Even though some sensors already accumulate sensor readings in inner memory, others such as RFID or cameras do not always store original sensor readings at the moment of their collection. In this case, the readings can be collected by and stored at a computer connected to a particular sensor. Such a systematic approach of data storage allows to avoid irreversible data losses. As the framework is generic, it has no limitations to a particular set of sensors and can incorporate different tracking technologies described in the previous chapter. The framework is organized as a generalized dataflow. First, the readings from different sensors are collected at individual construction equipment and are stored in a high update rate. Then, the level of detail is reduced and sensor readings are aligned in time. Afterwards, the readings are visualized in a meaningful way, documented in the storage located at the construction equipment, and sent to the remote server. The updates from the server (if needed) are then received and visualized on the operator's screen. The reduced level of detail allows to reduce the network throughput requirements and thus ensures the existence of contemporary information on the server even if the network bandwidth is low. The server can, therefore, provide close to real-time information to multiple different users. Altogether, these stages allow to collect highly precise sensor readings for documentation purposes, visualize the local readings to inform the equipment's operator, and communicate with the remote server that can update external users with the current equipment status based on user queries. The information obtained in this way could support operational and tactical decision making of personnel involved in the construction process, such as equipment operators and project managers. After the project (or a part of it) is completed, the highly precise data can be transferred to a centralized data warehouse. Such warehouses accumulate precise information from different sensors within a single storage for further processing. For instance, data mining can be applied to identify major factors that influence the construction process. In these settings, the warehouse data (such as the one for quality assurance purposes) can support planning future construction projects. Thus, the additional information can directly benefit strategic planning of future activities. As the approach proposed by the framework relies on several databases, the sensorbased infrastructures designed using the framework will benefit from the fact that the sensor readings are stored in different locations with different levels of detail. Such an approach ensures that no irreversible data loss occurs within the information system: the collected readings remain available for later usage in their high level of detail. Furthermore, such configuration of storage elements provides supplementary data back-up. Additionally, as the framework relates the close to real-time and the postprocessing data management schemes, the framework suggests to utilize distributed data processing elements.
32
To test the potential of the proposed framework we developed and implemented two information systems that particularly correspond to the framework's scheme to manage data in real-time. The next section describes the adopted methodology.
2.4 Adopted procedure to develop and test frameworkbased information systems To demonstrate the potential of the proposed framework to collect, process, and deliver visualized sensor readings with different levels of detail in a distributed way we adopted the following procedure: (1) to illustrate how the framework can be operationalized we developed a dataflow for distributed data collection and processing for asphalt paving as a specific type of construction activities; (2) we developed two information subsystem to track specific equipment during paving activities; and (3) we ensured the functionality of the systems by deploying them on construction projects and discussing it with operators and managers on-site. By instantiating the framework we aimed to ensure that the framework can assist developing information systems to support users in their daily work by providing effective visualizations to multiple users in close to real-time rate, while the collected data should be preserved for future processing and analysis. We chose paving operations as both specific and illustrative examples of construction activities because such operations necessitate the coordinated work of different specialized equipment that move on- and off-site. This characteristic is pertinent not only to asphalt paving, but also for other construction activities. Therefore, we consider that the illustrative operationalization can be projected to other construction activities, as most of them involve specialized equipment that move in coordinated manner. To identify meaningful information flows for finding a suitable arrangement of sensors to track paving activities at paving sites we conducted both literature review and field studies. The initial information flow was reconstructed by analyzing control variables (as described in [Miller, 2010], [Huerne, 2004]) that influence the asphalt paving process. After the literature study, the first author of this paper attended four paving projects to follow equipment operators in the field. This activity, as well as later system development and testing, was guided by the combination of ethnographic and action research principles [Hartmann et al., 2009] to further understand real world practice. Based on the outcome of this activity, we adopted the following arrangement of sensors in the context of this research: GPS sensors to follow trucks, pavers, and rollers; and temperature sensors on pavers to document distribution of the temperature of the asphalt mat.
33
Once the disposition of sensors was identified, we developed visualization systems according to the workflow described by [Vasenev et al., 2011]. The development activities were guided by the workflow and hence incorporated the following steps: equipment selection, infrastructure organization, data processing, and visualization. Besides, we utilized the steps as a mean to structure discussions about the system development between us and paving experts. The next section illustrates the application of the framework to define a dataflow to track asphalt paving activities as a particular example of construction projects. Then, the details of implementations and testing of the dataflow are described.
2.5 Illustrative operationalization of the framework for the case of asphalt paving operations Asphalt paving operations demand utilization of several specialized equipment, such as asphalt trucks, pavers, and rollers, to transport the asphalt mixture, lay down the asphalt mat, and compact the asphalt layer to a desired density. Coordinated equipment movements are crucial for obtaining a high quality road surface. Trucks continuously travel between an asphalt plant and a road construction site, while pavers and rollers move at the site. The information about current equipment locations and their previous movements can support construction specialists in making decisions on how to perform their tasks. For example, a paver operator could be interested in knowing when the next truck will arrive, a roller operator might desire to know what is the asphalt temperature after the paver, and a project manager could track equipment to ensure the continuous material delivery from asphalt plants to the construction site. Particularly noticeable in relation to this research is the large international project OSYRIS (Open System for Road Information Support) [Ligier et al., 2001] that aimed at providing a common infrastructure with open interfaces and thus connect previously fragmented and non-compatible different systems. The project’s component-based framework linked its central element – the product model – to multiple components: office (road design, work documentation, worksite web, and on-site design viewer), onboard computer (on-board computer and setting-out), and measurement and control components (compactor measurement system and paver measurement system). According to the employed principle of modularity, the components can be interchanged and additional elements, such as cooling models or co-operation between paver and rollers, can be added. However, though the OSYRIS project aimed to develop an information technological infrastructure for the road construction and maintenance, its purpose (similar to the purpose of the research project Computer Integrated Road Construction [Peyret et al., 2000]) was mainly oriented to provide tools to track equipment-specific information, 34
rather than suggesting frameworks for system development based on the assumption that different data granularity could be especially useful for different decision makers. By having a different purpose this paper complements the previously conducted research in the field and, as such, contributes to the existing body of construction informatics. In particular, the paper advocates the approach to develop information systems by means of exploiting readings from the same sensors with different levels of detail for informing different decision making levels: operational, tactical, and strategic. As mentioned before, to illustrate how the proposed framework for distributed data collection can be operationalized, we developed an organization structure of an information system. The information system collects sensor readings from multiple onand off-site locations and delivers visualizations in close to real-time rate to multiple users, located both at a construction site or at distance (Figure 2). At the same time, the sensor readings are documented in high detail at different equipment and can be later uploaded to a centralized database for the careful analysis.
Figure 2. The proposed organization structure of an information system to track paving operations
The proposed framework can be operationalized to track multiple types of equipment during asphalt paving projects as shown in Figure 3. In particular, the dataflow elements related to every equipment follow the same structure: collecting sensor readings, storing them, reducing the level of detail, aligning readings in time, visualizing local data, and communicating with the server. Though some particular steps are omitted, the succession of the dataflow steps sustains. For instance, the developed dataflow does not include data transfer from the server to asphalt trucks and only one sensor type (GNSS) is used on rollers. Nevertheless, additional sensors can seamlessly be introduced and the omitted steps can be easily re-integrated. 35
Figure 3. Implemented dataflow for distributed data collection and processing for asphalt paving operations according to the proposed framework: subsystem one demonstrate tracking remotely located construction equipment; subsystem two illustrates a case with intensive computations at a centralized server
Due to the extensive nature of the framework, we split the description in two parts that highlight characteristics of the framework from different viewpoints. In the first part, we describe a subsystem that traces locations of asphalt trucks that spend a significant part of their operations off-site. The second part depicts the implemented dataflow that concentrates on the central processing of massive amount of sensor readings. Though the subsystems track different equipment and perform different calculations, both of them are implemented using the principles depicted in the framework.
36
2.5.1 Tracking remotely located construction equipment using distributed data collection and processing To illustrate data collection from distantly located equipment we focus on the example of asphalt mixture delivery to a construction site. Ensuring the continuity of paving the constant delivery of asphalt to the construction site is crucial for the quality of the asphalt layer. If the paver stops, the temperature homogeneity of the asphalt layer will be disrupted, resulting in a lower quality of the road surface. The continuity of paver movements ultimately depends on the number of trucks transporting the mixture from an asphalt plant to the construction site [Miller & Dorée, 2008]. Road traffic can influence the timely asphalt delivery and, thus, introduce uncertainty about the estimated time of arrival (ETA) of the truck at the construction site. Altogether, the paver operator could benefit from the close to real-time information about the trucks' positions. By having such information at hand, the operator can adjust the paver's speed according to the trucks' ETA to avoid disruptions in the construction process. At the same time, the positional information collected at asphalt trucks can later be used for analyzing and further planning construction activities. In the given settings, the proposed framework can support close to real-time data collection and visualization along with storing location data for further use. Figure 4 overviews the organization structure of the information system we developed and implemented to track remotely located construction equipment. In the embodiment of the information system delivery trucks are equipped with smartphones to collect, store and send sensor readings to a remote database. Communication with the remote server was established by a 3G connection. To test the approach we developed a specialized Java program for an Android-based smartphone in addition to establishing and configuring a web-server. Firstly, the smartphone's program collects, stores, and sends out readings from the phone's GNSS, compass, and accelerometer sensors. In particular, the transmitted data include the identification number of the record, time stamp, latitude and longitude of the equipment position, identification number of the equipment, and readings from the phones' azimuth and accelerometer sensors. Then, the data are received by the server and stored in a central database. Later, the data are visualized to display the truck location superimposed on a geographical map. The following server-side software components were specially developed first author in line with the proposed framework: 1.
A PHP program to receive the transmission from a smartphone, check if the received data are in the expected format, and store the data to the database.
2.
A database to accumulate the received data,
3.
A visualization web-page (an HTML document that utilizes Java script and Google Maps API) to display equipment positions. 37
Figure 4. Organization structure of an information system to track remotely located construction equipment
The developed subsystem illustrates several characteristics of the proposed framework. Firstly, multiple clients can access the data to track different equipment almost in real-time. For instance, a paver operator can track asphalt trucks and reduce the paver's speed if the next truck is expected to arrive with a delay; also a construction manager can check the progress of the construction project and make decisions on how to improve it by, for example, adding additional transport vehicles to maintain continuity of material supply. Then, in addition to updating the server, the approach allows to use the Java program to store the data in inner memory at the moment of collection. In this sense, even if the data will not be transmitted to the server, it will stay available in the inner memory and, thus, will not be lost. Finally, the documented sensor readings can be downloaded from the local memory located at the smartphone to analyze the equipment's path by using adopted post-processing software, such as conventional GNSS processing or specialized software (for instance, discrete event simulators). To illuminate the framework's characteristics that support centralized data processing to support delivery of equipment-specific information from different sensors to multiple clients.
38
2.5.2 Performing intensive computations at a centralized server to track the construction process The information about the temperature of the deployed asphalt mat can influence operators' decisions about how to conduct the compaction activities and, correspondingly, how to move their equipment. For instance, if the asphalt temperature after the paver drops down (in case a truck delivered a colder load of the asphalt mixture), the roller operators can decide to compact the mat closer to the paver. However, despite the potential value, the transfer of temperature information from pavers to rollers does not take place in current paving practices and a roller operator can only roughly estimate the temperature of the recently deployed asphalt mat based on personal visual observations. A possible solution to transfer temperature data from pavers to rollers can be implemented according to the proposed framework. The organization structure of the corresponding information system is shown in Figure 5. The structure employs several elements from the dataflow depicted in Figure 3, namely the elements that correspond to a paver, a server, rollers, and auxiliary (additional) system users on-site.
Figure 5. Organization structure of an information system to track paving operations on-site
To provide roller operators with geo-referenced asphalt temperature of the deployed asphalt mat, an information system needs to obtain sensor readings of the mat's temperature along with locations of the construction equipment. For this purpose, we selected two different types of sensors: a temperature linescanner and Differential GPS (DGPS). The linescanner is mounted behind the screed of the paver at the height of 39
approximately three meters to continuously measure the asphalt temperature during asphalt paving (Figure 6). Such non-intrusive installation allows to precisely document the surface temperature of the asphalt layer. We utilized a Raytek MP150 linescanner which is capable to document up to 150 measurement lines per second with 1024 discrete measurements points per line. In addition to temperature, the equipment paths are documented using highly precise devices. For this study the field set-up included a Trimble SPS851 base station and two receivers (one located next to the linescanner at the paver and another on a compactor).
Figure 6. Linescanner mounted behind a paver
The obtained readings are processed and stored in different levels of detail according to the suggested framework. The roller's DGPS receiver documents (in its inner memory) the equipment locations in high level of detail using the manufacturer settings, specifically suitable for post-processing analysis. Then, the DGPS receiver reduces the sensor update rate to three Hz and transmits them to a laptop via Bluetooth. The laptop reduces the rate of the readings once again, now to the one Hz rate. These readings are displayed and stored in a specially developed Excel spreadsheet by means of a VBA (Visual Basic for Applications) program. To this extent, we incorporated the framework's functionality related to organizing extra storage of the collected data at an equipment. In other words, both readings in high and lower levels of detail were stored on the same equipment to ensure excessive data back-up, according to the design decisions made during the implementation of the illustrative information system. Then, 40
the laptop sends the one Hz rate readings over the network to a server, which runs a centralized database. The changes of rate of paver's DGPS readings are similar, but the data processing additionally process temperature readings. The readings from the linescanner are initially documented in high level of detail using hardware-specific driver and software. Then, the linescanner readings were reduced from 1024 discrete measurements obtained at 150 Hz to 20 measurements at the rate of one Hz. As both location and temperature readings are reduced to a one Hz update rate, the readings can be aligned, stored, and sent to the server. As in the roller's case, we developed a specialized VBA program for the paver. The server receives the readings from the paver and the roller, stores the data in a database, and processes them. Then, the geo-referenced temperature plots are calculated and visualized by using a large set of documented readings from the paver and the most recent location of the roller. To combine the temperature and location information from different sensors we developed a specialized data fusion approach. The computation and visualization modules were implemented using Matlab. To combine the GPS coordinates and temperature information the Matlab code generated a non-regular mesh where every node corresponds to a single temperature measurement. Though the details of the data fusion solution are out of the scope of this paper, it is necessary to note, that the core calculations are based on an automatically generated mesh. In the implemented information system, every obtained equipment location was combined with twenty temperature readings from the linescanner. Therefore, twenty new temperature points are introduced every second. As the sensor readings are accumulated during the paving project, a large amount of readings would require extensive processing power. For example, if a paver continuously spreads the asphalt mixture for five hours, the amount of the documented temperature spots --even after reducing the level of detail --- can reach 360 000 points (20 points per second x 3 600 seconds per hour x 5 hours). Thus, with the current level of detail (20 readings per second) both tasks of creating a mesh and visualizing the temperature distribution is computational demanding and requires a robust database system together with a centralized high performance computing unit. Finally, the obtained visualizations (or the corresponding sets of data) can be transmitted back to equipment operators and to other external users. The highly precise readings can later be stored in a datawarehouse, according to the suggested framework. In summary, the implemented solution illustrates the possible implementation of the proposed framework to collect information from different sensors and different locations, process it centrally and deliver it to different clients. Specifically, the documented path of the paver is combined at the server with the sensor readings that correspond to asphalt temperature after the screed of the paver. Later, the georeferenced temperature plot is combined with the location of another navigation sensor to show its relative positioning in relation to the paved surface. As a result, information originated at the paver can be transmitted to a roller. Meanwhile, as the highly precise 41
sensor readings are stored at construction equipment, the readings are available for later scrupulous data analysis, quality assessment, and references during the maintenance phase of the construction project.
2.5.3 Applying the developed subsystems to track equipment in the field After designing and implementing the framework-based solutions described above, the first author of the paper tested the two subsystems on asphalt paving projects conducted in the Netherlands. The first subsystem was tested at several paving projects shortly described in Table 1. In particular, the described solution employed the remotely located server from a hosting provider that received readings from a smartphone via 3G connection. As the documented sensor readings were also stored in the phone's memory, they remained available for upload to a datawarehouse database. Table 1. Characteristics of projects where the subsystem to track asphalt trucks was tested Location (area)
Short description
Mixture
Equipment
Mass of the paved mixture
Project duration
Gorinchem
Area near a hangar of ca. 40x60 m
AC 22 bind 6cm AC 16 surf, 5 cm
3 drum roller, Tandem roller
940 tones bind 780 tones surf
7-16.30 hr
Alkmaar
Road 7-8 m wide and ca. 800 m long
EME bind, 7 cm
Combi roller (steel drum front and tires rear), Tandem roller
Ca. 1200 tones
7-14 hr
The information system proved to be functional in the given conditions. The developed information system delivered the information about the estimate time of truck arrival to paver operators and to project managers, as well as stored the data for later processing. The system and the resulted visualizations were discussed with several operators and managers, who found the provided information valuable for performing their daily tasks. To this extent, the members of asphalting crews, interviewed during testing the system on-site, suggested that such systems can support their operational and tactical decision making tasks. The second information system was tested during a paving project near the city of Wijhe in The Netherlands. During the project about 300 tons of asphalt were paved and compacted by a construction team, formed by one paver and three compactors. The initial tests of the system incorporated GPS receiver and the processing unit located in the manager's car next to the constructed road. Further testing of temperature information delivery from the paver to other equipment included a highway paving 42
project near the Dutch city of Leiden. This latter test was performed during two consequent days when two asphalt layers were constructed. Both layers were about 25 meters wide and had a length of 500 meters. The amount of asphalt mixture paved was about 1650 tons per day. On the first day construction activities lasted from 7.00 till 16.30 in the evening, and on the second day from 6.30 till 17.00. Again, the equipment movements and the surface temperature of the asphalt layer after the paver were documented, stored in sensors' inner memory, transmitted to the remote server, and visualized. Later, the highly precise readings from DGPS sensors were collected within a datawarehouse database and visualized. These visualizations were discussed during feedback sessions with equipment operators and managers involved into the corresponding projects according to the Process Quality improvement framework suggested by [Miller, 2010]. To this extent, highly precise sensor readings contributed to analyzing previously conducted operations and formed the ground for strategic decisions about how to improve working practices. Similarly to the first solution, the obtained close to real-time visualizations were discussed with equipment operators and construction managers who found the delivered information useful for their operational and tactical tasks. Therefore, we consider that the second subsystem is capable to track construction projects in realtime and, similarly to the first subsystem to track remotely located equipment, demonstrates the specifics of the framework. In summary, the framework-based information systems demonstrated their ability to document highly precise data for post-process analyses and, according to the feedback from the operators and project managers, are able to support decision making of construction professionals in close to real-time rate. These cases validate that the framework can effectively guide the development of such information systems.
2.6 Discussion The information systems developed on basis of the proposed framework demonstrated their ability to provide close to real-time visualizations to multiple users as well as storing highly detailed data for post-processing. The systems allowed to document and accumulate sensor readings with high levels of detail, process, and distribute location and geo-referenced temperature data from different equipment to multiple users in close to real-time rate in lower levels of detail. Additionally, after the construction projects were finished the collected data with high level of detail were transferred to a warehouse. As the framework-originated systems deliver the functionality that was found useful by practitioners involved in tests, the framework proved to be an effective mean to guide development of such information systems to support operational and tactical decision 43
making processes of construction specialists. The sensor readings with the high level of detail can later inform quality assurance tasks and scrupulous data analysis. Such analysis, targeted to find inferences between project activities and project performance, thus informs the strategic decision making by project planners and its scope unfolds further than tactical decision making of project managers. Ultimately, the combination of operational, tactical, and strategic decision making can lead to improvements in high quality outcomes of the ongoing and future construction projects. As the conducted initial tests described in this paper were mainly oriented to demonstrate the applicability of the framework to support tactical and decision making of equipment operators and project managers, the outcomes of implemented systems were discussed with the construction personnel in free form. This approach is at variance with quantitative analysis of advantages correlated with specific implementations of the framework. Therefore, we see the instantiations of the framework as a proof-of-concept where the conducted tests aimed to evaluate their functionalities, rather than as examination of causal relations between variables related to testing particular implementations of the framework. Nevertheless, the discussed functionality of the developed information systems can directly be related to requirements to evaluate a specific system design, as described in [Kim et al., 2013]: fast communication, information sufficiency, and advantageous visualization. In particular, the first of the requirements was fulfilled by the proven systems’ ability to deliver close to real-time visualizations, while others can be related to the practitioners’ approval that the visualization can effectively support their needs. The decision to additionally store the reduced and aligned readings locally (in addition to sending then to the server) depends on the design of a specific information system. For instance, such design decision can result in separating files to store different levels of detail and use a mapping or hashing system to retrieve the low level data from the high level information. Though using separate files can be memory intensive, the design decision can be based on the need to provide additional back-up of data. Future research should investigate advantages related to specific operationalization of the framework as well as corresponding limitations, such as:
44
-
Re-defining level of detail can reduce demands of the communication bandwidth and thus support tracking large amount of construction equipment at the same time. Moreover, the amount of information transfer from clients to a server can automatically be adjusted. For instance, if the bandwidth decreases, then the frequency of transferring sensor readings from clients to a server can automatically be reduced, but the data will still remain available in sensors' storages for future analysis.
-
The centralized data storage and processing in real-time could allow to utilize some recent computing advantages, such as scalable computation power and storage capacity of the server. For instance, several additional computation
nodes could automatically be activated if multiple construction projects might be tracked at the same time. The latter advantages can be leveraged by utilizing cloud computing infrastructures. For example, the storage function can be supported by a cloud database, such as MongoDB or by adopting the MySQL solutions within the Amazon EC2 cloud computing platform. In a similar way, massive data processing can benefit from cloud computing, for example by utilizing specialized cloud interfaces, such as NCLab. Altogether, adopting cloud computing principles can benefit framework-based information systems because of on-demand network access to a shared pool of configurable computing resources. The five essential cloud computing characteristics (as outlined in [Mell & Grance, 2010]) can, according to our vision, be exploited as follows to support needs of a construction company to track construction processes based on the here presented framework: -
On-demand self-service. During the adoption of an information system within a company the need for increasing computing capabilities can be addressed directly by the company without disrupting the hosting providers.
-
Broad network access to the data: mobile phones and tablets with thin clients can support professionals on-site in making operational and strategic decisions. The examples of such decisions include introducing additional trucks to transport construction material or altering the hauling route. At the same time, workstations with thick clients at the office can assist in computation-intensive analysis of the documented data.
-
Resource pooling. All necessary resources (storage, processing, memory, and network bandwidth) are pooled dynamically by the service provider and are assigned according to the current demands of a construction company.
-
Rapid elasticity. The computation capabilities can be increased if multiple construction projects might be tracked simultaneously.
-
Measured service. The dynamic assessment of the utilized resources can support planning on how to utilize information systems according to the company-specific data processing demands.
We expect that if cloud computing infrastructures will be widely adopted by major sensor manufacturers, the interoperability support between different tracking systems will improve. For example, though Topcon and Trimble tracking solutions can already upload the sensor readings to a cloud, currently there is no opportunity to combined the uploaded information in a centralized way, partially due to existing company-specific data formats. However, if communication and processing infrastructures of information systems would use a similar modular structure, as suggested by the framework, it could be possible to harmonize different formats due to the same underlying data collection and management principles. 45
In their current embodiments, we consider the described information system as merely illustrative examples of exploring the potential of the proposed framework for data collection and management with respect to construction projects activities, rather than final solutions. In this way, some limitations characterize the described systems. For example, some technical issues related to managing sensor networks and handling specific events, such as the introduction of a new sensor in the system (in other words, a new machine into the project), were intentionally left aside of the scope of the paper. These essential issues will need to be addressed at the moment the suggested framework will be operationalized into sophisticated information systems. To effectively handle the need to consider specific interactions of the new sensor with the existing ones, as well as interoperability and the system calibration issues, a potentially prominent solution will be to adopt a system design based on a service oriented architecture (SOA), such as proposed in [Hsieh & Hung, 2009]. According to the underlying concept of connecting loosely coupled services, systems designed in this way will naturally account for reliability and scalability issues. Also, the data processing algorithms can be improved, for instance the introduction of additional filtering or advanced data fusion solutions can benefit the systems [Vasenev et al., 2013]. Therefore, the developed processing methods were described in short and new data processing approaches are to be developed and described in details in future research. Besides, the implemented subsystems were oriented to support relatively small-scale construction projects, the system infrastructures were developed without using high-end resources. A server rented from a hosting provider was used within the first illustrative example, and a single-computer dedicated server was developed for the second information system. Additional limitations were introduced in the second example: an on-site processing unit was utilized and no long-rate communication channels were employed. Nevertheless, we anticipate the possibility to move the unit to an off-site location if a high-speed Internet access will become available on construction sites in the future. Altogether, we see the proposed framework as a stepping stone from the specialized information systems that separately support either real-time or post-processing data analysis to a coherent system of data collection and management.
2.7 Conclusion This paper proposed a framework for distributed data collection and management that can support operational, tactical, and strategic decision making of the specialized personnel involved in construction projects. The underlying framework's principles allow to track construction projects based on readings from on-site and off-site sensors that are connected to a central processing unit, accessible from arbitrary locations. The real-time data processing can be performed with decreased level of detail of the sensor 46
readings, while all information is also preserved at multiple locations and stays available for later upload to a warehouse database for future scrupulous analysis. To illustrate the framework's feasibility to follow construction equipment in real-time and document the sensor readings in different level of detail at different locations we proposed a dataflow for tracking asphalt paving operations as a specific example of construction activities. Then, we developed and tested two subsystems to illustrate equipment-specific elements of the dataflow. In particular, the solutions aim to provide additional information to paver and roller operators employed in asphalt paving projects in order to support them in making well-founded operational decision at a later point. All information stays available at a centralized server to assist construction managers in making operational and tactical decision. At the same time, the sensor readings are stored in high level of detail at construction equipment for further analysis. Such detailed data can then be used for scrupulous analysis after the project is completed. For instance, post-processing of the collected data may assist quality assessment tasks or help with finding inferences between different process-related factors and events that can negatively influence the construction productivity. In this way, sensor readings collected as suggested by the framework can potentially be useful not only to track, assess and analyze construction operations, but also to serve as reference during the maintenance stage.
2.8 Acknowledgements This research would not have been possible without financial support of the Pioneering Foundation and cooperation with the ASPARi network (“Asfalt Sector Professionalisering, Research & Innovatie”) founders Dura Vermeer, TWW, Ballast Nedam, and BAM Wegen. We would like to acknowledge these companies, their staff and asphalt teams for support and opportunity to conduct the research at their construction sites. Specially, we would like to thank Frank Bijleveld and Marco Oosterveld for fruitful discussions during the preparation and conducting on-site experiments of the developed information systems.
2.9 References Akhavian, R. and A. H. Behzadan (2012). "An integrated data collection and analysis framework for remote monitoring and planning of construction operations." Advanced Engineering Informatics 26(4): 749-761. Akula, M., S. Dong, V. R. Kamat, L. Ojeda, A. Borrell and J. Borenstein (2011). "Integration of infrastructure based positioning systems and inertial navigation for 47
ubiquitous context-aware engineering applications." Advanced Engineering Informatics 25(4): 640-655. Azimi, R., S. Lee, S. M. AbouRizk and A. Alvanchi (2011). "A framework for an automated and integrated project monitoring and control system for steel fabrication projects." Automation in Construction 20(1): 88-97. Brilakis, I., M.-W. Park, G. Jog (2011). "Automated vision tracking of project related entities." Advanced Engineering Informatics 25(4): 713-724. Chen, Y. and J. M. Kamara (2011). "A framework for using mobile computing for information management on construction sites." Automation in Construction 20(7): 776788. Cheng, T., M. Venugopal, J. Teizer and P. Vela (2011). "Performance evaluation of ultra wideband technology for construction resource location tracking in harsh environments." Automation in Construction 20(8): 1173-1184. Cheng, T., J. Teizer, G. C. Migliaccio and U. C. Gatti (2013). "Automated task-level activity analysis through fusion of real time location sensors and worker's thoracic posture data." Automation in Construction 29(0): 24-39. Costin, A., N. Pradhananga and J. Teizer (2012). "Leveraging passive RFID technology for construction resource field mobility and status monitoring in a high-rise renovation project." Automation in Construction 24(0): 1-15. Golparvar-Fard, M., J. Bohn, J. Teizer, S. Savarese and F. Pena-Mora (2011). "Evaluation of image-based modeling and laser scanning accuracy for emerging automated performance monitoring techniques." Automation in Construction 20(8): 1143-1155. Golparvar-Fard, M., A. Heydarian and J. C. Niebles (2013). "Vision-based action recognition of earthmoving equipment using spatio-temporal features and support vector machine classifiers." Advanced Engineering Informatics 27(4): 652-663. Gong, J., C. H. Caldas and C. Gordon (2011a). "Learning and classifying actions of construction workers and equipment using bag-of-video-feature-words and Bayesian network models." Advanced Engineering Informatics 25(4): 771-782. Gong, J. and C. H. Caldas (2011b). "An object recognition, tracking, and contextual reasoning-based video interpretation method for rapid productivity analysis of construction operations." Automation in Construction 20(8): 1211-1226. Hai, R., M. Theissen and W. Marquardt (2011). "An ontology based approach for operational process modeling." Advanced Engineering Informatics 25(4): 748-759. Halpin, D. and L. Riggs (1992). "Planning and Analysis of Construction Operations." Wiley. 48
Hartmann, T., M. Fischer and J. Haymaker (2009). "Implementing information systems with project teams using ethnographic-action research." Advanced Engineering Informatics 23: 57-67. Hsieh Y. M. and Y. C. Hung (2009). "A scalable it infrastructure for automated monitoring systems based on the distributed computing technique using simple object access protocol web-services." Automation in Construction 18(4): 424-433. Huerne, H. (2004). "Compaction of asphalt road pavements: using finite elements and critical state theory." Ph.D. Dissertation, University of Twente. Jang, W.-S., D.-E. Lee and J. ho Choi (2012). "Ad-hoc performance of wireless sensor network for large scale civil and construction engineering applications." Automation in Construction 26(0): 32-45. Jog, G.M., I. Brilakis and D. C. Angelides (2011a). "Testing in harsh conditions: Tracking resources on construction sites with machine vision." Automation in Construction 20(4): 328-337. Jog, G.M., H. Fathi and I. Brilakis (2011b). "Automated computation of the fundamental matrix for vision based construction site applications." Advanced Engineering Informatics 25(4): 725-735. Kim, S.-K., J. Seo and J. S. Russell (2012). "Intelligent navigation strategies for an automated earthwork system." Automation in Construction 21(0): 132-147. Kim, C., T. Park, H. Lim and H. Kim (2013). "On-site construction management using mobile computing technology." Automation in Construction 35(0): 415-423. Lee, J. H., J. H. Song, K. S. Oh and N. Gu (2013). "Information lifecycle management with RFID for material control on construction sites." Advanced Engineering Informatics 27(1): 108-119. Leung, S.W., S. Mak and B. L. Lee (2008). "Using a real-time integrated communication system to monitor the progress and quality of construction works.", Automation in Construction 17(6): 749-757. Li, Y. and C. Liu (2012). "Integrating field data and 3d simulation for tower crane activity monitoring and alarming." Automation in Construction 27(0): 111-119. Ligier, A., J. Fliender, J. Kajanen and F. Peyret (2001). "Open system road information support." in: 18th International Symposium on Automation and Robotics for Construction: 205-210. Liu, D. H., J. Sun, D. H. Zhong and L. G. Song (2012). "Compaction quality control of earth-rock dam construction using real-time field operation data." Journal of Construction Engineering and Management-ASCE 138(9): 1085-1094.
49
Lu, W., G. Q. Huang and H. Li (2011). "Scenarios for applying RFID technology in construction project management." Automation in Construction 20(2): 101-106. Mell, P. and T. Grance (2010). "The NIST definition of cloud computing." Communications of the ACM 53(6): 50-50. Miller, S. and A. G. Dorée (2008). "Improving logistics in the asphalt paving process – what can we learn from the planner's logic?" in: 24th ARCOM conference, 1-3 September 2008, Cardiff, UK. Miller, S. (2010). "Hot mix asphalt construction: towards a more professional approach." Ph.D. Dissertation, University of Twente. Miller, S., T. Hartmann and A. G. Dorée (2011). "Measuring and visualizing hot mix asphalt concrete paving operations." Automation in Construction 20(4): 474-481. O’Brien, W., C. Julien, S. Kabadayi, X. Luo and J. Hammer (2009). "An architecture for decision support in ad hoc sensor networks." Journal of Information Technology in Construction 14 (Special Issue Next Generation Construction IT: Technology Foresight, Future Studies, Roadmapping, and Scenario Planning): 309-327. Park, M.-W., A. Makhmalbaf and I. Brilakis (2011). "Comparative study of vision tracking methods for tracking of construction site resources." Automation in Construction 20(7): 905-915. Peyret, F., J. Jurasz, A. Carrel, E. Zekri and B. Gorham (2000). "The computer integrated road construction project." Automation in Construction 9 (5-6): 447-461. Pradhan, A., B. Akinci and C. T. Haas (2011). "Formalisms for query capture and data source identification to support data fusion for construction productivity monitoring." Automation in Construction 20(4): 389-398. Pradhan, A. and B. Akinci (2012). "A taxonomy of reasoning mechanisms and data synchronization framework for road excavation productivity monitoring." Advanced Engineering Informatics 26(3): 563-573. Ray, S. J. and J. Teizer (2012a). "Coarse head pose estimation of construction equipment operators to formulate dynamic blind spots." Advanced Engineering Informatics 26(1): 117-130. Ray, S. J. and J. Teizer (2012b). "Real-time construction worker posture analysis for ergonomics training." Advanced Engineering Informatics 26(2): 439-455. Razavi, S. N. and C. T. Haas (2010). "Multisensor data fusion for on-site materials tracking in construction." Automation in Construction 19(8): 1037-1046. Razavi, S. N. and C. T. Haas (2011). "Using reference RFID tags for calibrating the estimated locations of construction materials." Automation in Construction 20(6): 677685. 50
Ren, Z., C. Anumba and J. Tah (2011). "RFID-facilitated construction materials management (RFID-cmm) a case study of water-supply project." Advanced Engineering Informatics 25(2): 198-207. Saidi, K. S., J. Teizer, M. Franaszek and A. M. Lytle (2011). "Static and dynamic performance evaluation of a commercially-available ultra wideband tracking system." Automation in Construction 20(5): 519-530. Scherer, R. and S.-E. Schapke (2011). "A distributed multi-model-based management information system for simulation and decision-making on construction projects." Advanced Engineering Informatics 25(4): 582-599. Shahandashti, S. M., S. N. Razavi, L. Soibelman, M. Berges, C. H. Caldas, I. Brilakis, J. Teizer, P. A. Vela, C. T. Haas, J. Garrett, B. Akinci and Z. Zhu (2011). "Data-fusion approaches and applications for construction engineering." Journal of Construction Engineering and Management 137(10): 863-869. Sheng, Q. Z., S. Zeadally, Z. W.Luo, J. Y. Chung and Z. Maamar (2010). "Advances in RFID technology." Information Systems Frontiers 12(5): 481-483. Son, H. and C. Kim (2013). "Multiimaging sensor data fusion-based enhancement for 3d workspace representation for remote machine operation." Journal of Construction Engineering and Management-ASCE 139(4): 434-444. Song, L. and N. N. Eldin (2012). "Adaptive real-time tracking and simulation of heavy construction operations for look-ahead scheduling." Automation in Construction 27: 3239. Teizer, J. and P. A. Vela (2009). "Personnel tracking on construction sites using video cameras." Advanced Engineering Informatics 23(4): 452-462. Trappey, A.J. and P. Wognum (2011). "Special issue on RFID and sustainable value chains." Advanced Engineering Informatics 25(1): 2-3. Vasenev, A., F. R. Bijleveld, T. Hartmann and A. G. Dorée (2011). "Visualization workflow and its implementation at asphalt paving construction site." in: CIB W78W102. Vasenev, A., D. Ionita, F. R. Bijleveld, T. Hartmann and A. G. Dorée (2013). "Information fusion of GNSS sensor readings, field notes, and expert's a priori knowledge." in: Proceedings of European Group for Intelligent computing in Engineering (EG-ICE) workshop in July 2013, Vienna University of Technology, Austria: 1-10. Voisard, A. and H. Ziekow (2012). "Modeling trade-offs in the design of sensor-based event processing infrastructures." Information Systems Frontiers 14(2): 317-330.
51
Yang, J., T. Cheng, J. Teizer, P. Vela and Z. Shi (2011). "A performance evaluation of vision and radio frequency tracking methods for interacting workforce." Advanced Engineering Informatics 25(4): 736-747.
52
Chapter 3. A procedure to reconstruct the geometry and the initial temperature distribution of an asphalted layer from sensor readings collected during the asphalt paving process2 Having information about the temperature and the geometry of the distributed asphalt layer during the asphalt paving process is valuable for roller operators and other construction personnel involved in the process. Furnished with this information, the construction professionals can make adequate decisions how to proceed with the asphalt compaction process. However, this information of has not yet been provided to the construction specialists. Even though the relevant data are collected by a number of specialized information systems, the procedure how to process these data to obtain the initial temperature distribution and the geometry of the asphalted layer has been lacking. This paper address this gap by proposing a data processing procedure that reconstructs the geometry and the initial temperature distribution of an asphalted layer by processing readings collected during the process. The localization and temperature readings are taken from GNSS (Global Navigation Satellite System) and infrared sensors situated on the paver. The proposed procedure constitutes four data processing steps that account for known specifics of the asphalt paving process. The output of the procedure is a reconstructed triangular mesh describing the distributed layer that allows for representing the temperature and the layer geometry. To illustrate the data processing procedure, we developed a prototype to reconstruct the corresponding information during the compaction process. The prototype aims at informing roller operators about their location relative to the initial temperature distribution. We employed the prototype during two real construction projects. The outcome of these tests suggests that the proposed data processing procedure supports reconstructing the geometry and the initial temperature distribution of an asphalted layer from sensor readings collected during the asphalt paving process.
2
This chapter has been submitted to an international refereed journal as an academic paper. Coauthors of the corresponding paper are T. Hartmann and A. G. Dorée
53
3.1 Introduction The global network of asphalted roads is an important infrastructure asset indispensable for modern society [WRA, 2014]. Given the high social and economic value, it is desirable to increase periods between construction and service activities in order to cause as little disturbances for traffic as possible. At the same time, constructed roads should possess certain quality parameters over the prolonged span of service (maintenance) periods. The intervals between maintenance activities are increasing due to the demands of regulating agencies who try to keep roads open for traffic most of the time. As a result, the road construction industry concentrates on improving construction processes that heavily influence the quality and the lifetime of the roads. The asphalt compaction process is often recognized as one of the most critical factors (or even the single most important factor) for achieving satisfactory pavement service life [Abd El Halim et al, 1993]. The process highly depends on coordinated work of multiple equipment that operates in continuously changing contexts. During the process one or more pavers lay down asphalt mixtures and rollers continuously move over the paved asphalt layer with the intention to compact it to a desired density. To reach the desired density, the roller operators consider the layer’s compactability. The layer’s compactability mainly depends on the viscosity of the binder in the asphalt mixture. The viscosity can be inferred from the temperature of the deployed asphalt layer. Since the asphalt temperature is important for deciding when and where to compact [Krishnamurthy et al., 1998], the roller operators need to judge the temperature of the deployed asphalt mixture behind the paver. In particular, the operators might need to compact closer to the paver if the distributed layer is relatively cold, or increase the distance between the paver and the roller in the opposite case. Often, the operators have to rely on their subjective (and experience-based) feeling. They attempt to identify if the deployed asphalt mixture has a specific color or if there is “white smoke” above the paved surface [Miller, 2010]. Such perceptions can be nullified by working conditions, for instance if asphalt paving is performed at night. Alternatively, the suggestions how to compact the deployed asphalt layer can come from other personnel. For instance, based on the hierarchy within a construction team, the roller operators might be guided by a quality control manager or technician. The managers or technicians can examine thermal profiles behind the paver and instruct roller operators to maintain or alter their working distances. In either setting, construction personnel onsite need to be informed about the temperature profile of the deployed layer. Currently, despite the need to communicate information about the temperature distribution behind the paver to roller operators (or other specialists), existing solutions lack such functionality. The available systems mainly rely on sensors located on rollers. For instance, the Trimble CCS900 [Trimble, 2014] and Hamm HCQ [HAMM, 2014] 54
systems collect and deliver temperature information from the roller’s sensors to an operator who controls that (or another) roller. This approach allows to inform roller operators about the temperature sensed next to the rollers. Meanwhile, the Pave-IR solution [Swaner, 2010] represents the initial temperature distribution as a time-based graph to the paver operators. This temperature-related information is not georeferenced and not communicated during on-site construction to roller operators or project managers. To obtain information for a specific location, the rollers need to travel to this location. Such action is undesirable as it could damage the paved layer. Altogether, the existing solutions lack the possibility to reconstruct a geo-referenced initial temperature distribution of the paved layer during the compaction process. To overcome this limitation, this paper proposes a data processing procedure to reconstruct the geometry and the initial temperature distribution of the paved asphalt layer from localization and temperature sensors located on the paver. The specialized data processing procedure was developed to geo-reference and process location and temperature sensor readings. This procedure recommends how to re-sample and interpolate temperature and location data with the help of applying known specifics of the paving process. This approach reconstructing the layer’s geometry and the temperature based solely on sensor readings without any a priori information. As an outcome of the procedure, a triangular mesh representing the paved layer is calculated. The obtained mesh enables to easily interpolate temperature measurements across the mesh. In addition, the mesh facilitates visualization of the layer information, as the mesh representation is commonly supported by contemporary visualization solutions. Visualizations of this mesh can be demonstrated to roller operators during both on-site processes and after the completion of the construction projects. This paper continues with the introduction of the important role of the mix temperature during the asphalt compaction process. Then, it provides an overview of existing solutions that allow demonstrating temperature of the asphalt layer both during and after the paving process. Afterwards, the data processing procedure suitable for reconstructing asphalt layers from multiple sensor readings is presented. The procedure accounts for known specifics of the asphalt paving process. Then, an illustrative implementation of the procedure as an information system prototype is presented together with initial tests conducted during two paving projects. The paper concludes with discussing the conducted research and its implications.
55
3.2 Background: overview of the available solutions and approaches to visualize asphalt temperature during paving operations To date, a number of solutions have been developed to acquire and represent the temperature of asphalted layers both during on-site paving operations and after the completion of construction projects. Among these solutions are industrial systems to inform roller and paver operators about the asphalt temperature next to their equipment. Also, several researchers suggested how to visualize the asphalt layer temperature for both reviewing and simulating asphalt compaction operations [Miller et al., 2011; Turkiyyah, 2007]. However, the existing solutions do not support reconstructing the initial temperature distribution of the paved layer and its geometry solely based on sensor readings. The industrial systems mainly operate with temperature spots located only next to a roller or, alternatively, produce just time-based (instead of geo-referenced) graphs from sensors located on the paver. Meanwhile, academic solutions imply that the geometry of the layer is already available and can directly be visualized. This study provides suggestions how to reconstruct the geometry and the initial temperature distribution of the paved layer and thus bridge the approaches to acquire temperature data and represent the information about the temperature distributions of asphalted layers. This section starts with highlighting the role of asphalt temperature for the compaction process and the need to inform roller operators about it. Then, currently available solutions that deal with the asphalt temperature distributions are described. To provide directions on how the geometry of the paved layer and its temperature distributions can be reconstructed, the section also describes a generic four-step data processing workflow suitable to reconstruct an object of interest from different sensor readings. This workflow is adopted within the procedure described later.
3.2.1 Role of asphalt temperature distribution during the compaction process During the asphalt compaction process changes in asphalt temperature both make the compaction process possible and restrict it. In the case of commonly used hot-mix asphalt mixtures (HMA) the paving or finishing machine deploys the asphalt at temperatures between approximately 110 and 150 °C depending on the mixture characteristics, layer thickness and ambient conditions [MAPA, 2014]. After deployment, the temperature of the newly paved asphalt layer continuously decreases, leading to changes in the compactability. Mixture designers also suggest specific temperature ranges that are best suitable for conducting compaction activities [Sullivan 56
& Bondt, 2009]. The recommendations may include compacting the asphalt layer when its temperature is lower than 130 °C [Commuri & Zaman, 2008], higher than 70 or 80 °C [Commuri & Zaman, 2008; Alexander, 1989], or when it is between 90 and 100 °C [Floss, 2001]. To follow the recommendations on how to proceed with the compaction, operators need to continuously consider the temperature of the paved layer, as some undesirable events can lead to variations in the layer’s initial temperature distribution. For instance, due to longer transportation time or poor temperature isolation of the bed of the truck, the transportation truck can deliver asphalt mixtures that have already significantly cooled down. In another situation, a paver might need to stop and wait for the next asphalt truck. Temperature variations, caused by inefficient transport logistics, can cause premature failure of the road pavement [Miller et al., 2011]. To mitigate the potential negative results of the temperature segregations, adequate compaction is needed. As research on temperature segregations suggests, to mitigate the effect of temperature differentials it is desirable that the finished pavement has a uniform density of 93 percent or greater for dense-graded mixes [TRAC, 2001]. To reach such a uniform density, roller operators need to plan their movements in advance based on the temperature of the layer. As the mixtures may react very sensitively to a too early start of compaction work [Bomag, 2009], the rollers may simply displace or “shove” the material, rather than compact it. In such settings, roller operators might need to postpone compacting if the mixture is too hot. At the same time, if the compaction starts too late, then to achieve a desired compaction degree roller operators have to compact the layer at temperatures lower than a suggested minimum value. These actions can negatively affect essential functional properties of the layer (e.g. the texture of the surface can be impaired). Even if the target density is achieved without observable damages, the compaction performed outside of the compaction window can reduce cracking toughness of the layer by up to 35% and lead to the increase of the crack propagation rate by up to 40% [Bijleveld et al., 2012]. Given the importance of the role of the initial temperature distribution of the asphalted layer, several specialized solutions were recently developed to acquire and represent the temperature information both during and after the compaction process. A brief overview of these solutions is presented next.
3.2.2 Solutions to inform equipment operators involved in asphalt paving projects about their working context Based on specifics of the compaction process, roller operators need to consider the temperature of the asphalt layer to identify a working distance between the paver and 57
the roller [Chadbourn, 1996]. In practice, roller operators do that by relying on their visual perception of the color of the deployed asphalt layer. If this perception is inaccurate due to fog or poor lighting conditions (e.g. during night shifts), the operators can start compacting too close to the paver. This can damage the asphalt layer. Therefore, the operators can certainly benefit from objective information about the temperature behind the paver to decide when to start compacting activities. Even though several suggestions [Glee et al., 2012; Ligier et al. 2010] propose to inform roller operators about the temperature of the paved layer using data collected by sensors located on pavers, currently no information system truly supports that functionality. In our view, this can be partially explained by the absence of a suitable procedure to reconstruct the initial temperature distribution from data originated at the paver. This subsection reviews some of the information systems oriented for asphalt roller operators and highlights the need for such procedure. Over the last years, advances in sensing technologies have led developments of specialized solutions to inform asphalt equipment operators about the context of their work. Earlier, several solutions were developed within the scope of the Continuous Compaction Control (CCC) paradigm. CCC is a technique available for earthworks and road construction applications for thirty years [Bomag, 2012], which enables using an instrumented compactor to measure soil or asphalt compaction in real-time and adjusts compactive effort accordingly to control the level of compaction (Intelligent Compaction, 2013). CCC solutions are mainly oriented to inform roller operators about nontemperature aspects of their work and can indeed inform asphalt roller operators in their work. However, they do not consider the temperature context of the compaction process. In addition to CCC solutions, several insights related to informing roller operators about their working context were provided within the Computer Integrated Road Construction (CIRC) project. This project aimed at developing computer integrated construction systems for road construction equipment [Peyret, 2000]. However, similar to CCC systems the CIRC project did not pay particular attention to reconstructing georeferenced initial temperature distributions and the geometry of the paved layer. The most advanced approaches to inform equipment operators about the asphalt temperature can probably be found within the scope of a set of recently developed intelligent compaction (IC) solutions. IC refers to the compaction of road materials using modern vibratory rollers equipped with an integrated measurement system, an onboard computer reporting system, Global Positioning System (GPS) based geo-referencing, and optional feedback control [Intelligent Compaction, 2014]. By integrating measuring, documenting, and controlling systems, IC solutions provide roller operators with amounts of roller passes and the temperature of the deployed asphalt mixture, sensed next to a particular type of construction equipment.
58
For instance, the Trimble CCS900 [Trimble, 2014] and Hamm HCQ [HAMM, 2014] systems support collecting, processing, and representing the temperature data obtained by the roller’s sensors to an operator who controls the same (or another) roller. In a similar way, paver operators can track the asphalt temperature next to the paver by using the Pave-IR system that employs a set of temperature sensors or a linescanner positioned behind the paver [Swaner, 2010]. Using this system, the paver operators can consider the current and earlier temperature distributions across the newly paved asphalt layer based on the provided time-based graphs. Although Pave-IR allows sensing the temperature information behind the paver, the time-based temperature graphs produced by this system are of little use for roller operators. Since construction equipment during the paving process continuously moves, the operators would have difficulties to relate particular time-referenced readings to specific spots over the pavement. Therefore, to provide the possibility to refer to temperatures at specific locations, the time-based temperature data should be processed and geo-referenced prior to communicating this information to roller operators. By adequately geo-referencing sensor readings relevant to the paved layer it also becomes possible to identify the layer geometry. This geometry can assist roller operators in relating their position to the distributed asphalt layer. A suitable data processing procedure is therefore needed to reconstruct the geometry and the initial temperature distribution of the paved layer from sensor readings located on the paver. Empowered by this procedure, roller operators could be objectively informed about the temperature distribution behind the paver. Two aspects relevant to visualizing the layer’s temperature and geometry should be considered before developing such a procedure. Firstly, recent approaches on how to visualize the georeferenced temperature distribution of an asphalted layer should be taken into account. Secondly, a suitable workflow to reconstruct the paved layer based on multiple sensor readings should be considered. Together, these aspects can provide the basis for developing the corresponding procedure. The rest of this section covers these two aspects.
3.2.3 Existing solutions to represent the constructed asphalt layer Recently, several solutions were developed to represent the temperature distributions of asphalted layers. These solutions include Veda software to represent Pave-IR data, AsphaltOpen to review construction processes, and SIMPAVE to simulate compaction activities. This subsection outlines characteristics of these solutions and suggests utilizing a triangular mesh for representing the temperature information about the paved layer. The Veda software can be employed to represent temperature distributions documented with the help of Pave-IR system [Veda 2014]. This software visualizes the 59
collected temperature data as separately located color-coded lines of measurements. Each line corresponds to the temperature behind the paver at specific moments of time. As these lines are not interlinked, they provide only sparse information about the temperature distributions. Moreover, the geometry of the paved surface is not considered by the software. As a result, even though the adopted discrete representation of the temperature is useful for representing temperatures across the pavement, it provides less understanding about the values in-between the measured lines. Unlike Veda, two visualization solutions developed in academia – AsphaltOpen and SIMPAVE – aim to represent the temperature by visualizing triangular meshes corresponding to the geometry of the paved layer. AsphaltOpen visualizes previously conducted asphalt paving operation and represents the temperature of the paved mixture using triangle patches [Miller et al., 2011]. The software is oriented to visualize the temperature and equipment movements for reviewing documented compaction processes. The authors mention that this triangular mesh is obtained by combining localization data together with readings from a temperature infra-red linescanner mounted on the paver. However, AsphaltOpen actually assumes a readily made mesh as input and suggestions on how to construct such meshes are lacking. Similarly to AsphaltOpen, mesh-based representations of asphalt layers are utilized within the SIMPAVE environment [Turkiyyah, 2007]. This environment visualizes the paving process for simulation and education purposes. Given the purpose of the environment, the mesh that represents the temperature distribution does not visualize actually documented temperature readings, but is entirely simulated within SIMPAVE. Specifically, a few location points with specific temperatures are generated within the software and then a Delaunay triangulation [Matlab, 2014] is applied to interpolate the temperature values. Altogether, even though the available solutions allow representing the asphalt temperature in one or another way, they do not provide suggestions on how to reconstruct the geo-referenced initial temperature distribution within the layer’s geometry. The Veda software visualizes the data without additional processing, AsphaltOpen does not specify the data processing procedure, and SIMPAVE simulates the temperature instead of representing sensor readings documented during a real project. As a result, no data processing procedure exists that can identify geometry and initial temperature distributions of the paved layer. In our view, an adequate procedure to identify the geometry and the initial asphalt distribution of the paved layer should aim at reconstructing a triangular mesh representing the paved layer, because (1) the existing visualizations have already demonstrated the successful use of the mesh visualization for simulation and reviewing processes, (2) the triangular mesh structure naturally supports interpolating 60
temperature measurements in-between the measured points, and (3) triangular mesh representations are commonly supported by contemporary visualization solutions. Altogether, there is a need for a data processing procedure that converts sensor readings characterizing the temperature distribution of the paved layer to a mesh suitable for representing real project data. This procedure is the major topic of this paper. The next subsection provides a workflow suitable for this procedure.
3.2.4 Data processing steps to reconstruct an object of interest from sensor readings The task of reconstructing the geometry and the temperature distribution of the paved layer is similar to other tasks of reconstructing an object of interest from multiple sensor readings. Such tasks are common in the domain of informatics and are often based on combinations of geometrical calculations and the application of a priori knowledge about the sensed object. In principle, while geometrical rules can assist in understanding the structure of the viewed scene [Coelho et al., 1990], a priori knowledge about the sensed environment can assist in solving geometric problems at large, e.g. related to finding an efficient decomposition of an object into primitives [Kapur & Mundy, 1988, p.3]. This subsection outlines a workflow that can be observable in solutions to identify an object of interest from sensor readings. Two examples from the construction informatics domain illustrate how the data processing steps that constitute the workflow can be implemented. To reconstruct an object of interest from multiple sensor readings one should consider how to (1) collect sensor readings, (2) process the readings to obtain basic elements of the sensed environment, such as points and lines, (3) combine and refine the obtained elements according to some specific logic, and (4) extract the object of interest. This four-step workflow can be observed within specialized solutions available in the domain of construction informatics, for instance in the recently proposed photo- [Martínez et al., 2012; Moreno et al., 2013] and videogrammetry [Fathi & Brilakis, 2013] systems. The data processing steps incorporated in these systems rely on combinations of geometric-based principles and a priori knowledge about some specific objects of interest. Firstly, geometric-based processing can clearly be of use to process individual sensor readings and to obtain basic elements of the sensed environment. In the mentioned systems, the individual sensor readings are combined to identify elements of the sensed environment. In particular, Martínez et al. [2012] suggest to fuse sensor readings from a laser scanner and inclination sensors, while in another work readings originated from a calibrated stereo camera set are processed [Fathi & Brilakis, 2013]. Well-known matrix operations (as described for instance in [Moreno et al., 2013]) typically form the core of the geometric-based processing. 61
After the basic elements of the environment are identified, data processing procedures that account for known specifics of the object can benefit from combining the obtained elements and extracting the objects of interest. For instance, a priori knowledge that some “walls” are adjacent and orthogonal to “floors” can help identifying the corresponding objects [Brilakis et al., 2012]. Within one of the mentioned examples, a specialized data processing procedure that accounts for known specifics of the sensed object enables reconstructing half-planes characterizing the object of interest [Fathi & Brilakis, 2013]. In this way, data processing steps based on a priori knowledge can improve the data processing output. Overall, as the mentioned four-step workflow enables structuring the data processing steps, this paper adopts this workflow to identify geometry of the paved asphalt layer and the asphalt temperature distribution. The next section introduces this procedure.
3.3 A procedure to construct the geometry and the initial temperature distribution of an asphalted layer A suggested data processing procedure to reconstruct the interpolated geo-referenced initial temperature distribution of an asphalted layer is shown in Figure 1. The data processing steps correspond to the workflow outlined above.
Figure 1. Procedure to reconstruct the geometry and the initial temperature distribution of an asphalted layer by taking into account known specifics of the paving process
The suggested procedure accounts for the following known specifics of the paving process: during the process the newly paved asphalt layer is continuously deployed behind a paving machine at relatively high temperatures. This knowledge about the process can be operationalized as data processing rules that govern particular steps of 62
the procedure to identify an object of interest from multiple sensor readings. These data processing rules can be outlined as follows: 1.
Due to the nature of the process, the paver continuously moves forward while deploying the asphalt mixture. Therefore, only a limited set of sensors is needed to reconstruct the asphalt temperature directly behind the paver. Specifically, only the location of the paver and temperatures across the layer directly behind the paver should be continuously documented. An example of such sensor set-up is shown in Figure 2.
2.
The collected individual sensor readings can be processed to form a set of geo-referenced temperature measurements. Given that the paver’s location, temperature data, and interrelations between location and temperature sensors are known, this set can be formed by applying geometric transformations. This transformation implies that (1) the temperature and location readings are aligned in time; and (2) interrelations between coordinate systems of both temperature and localization sensors on the paver are known.
3.
The geo-referenced locations obtained within the previous data processing step can be checked against the known specifics of the paving process to identify if these locations correspond to the newly paved asphalt layer. As mentioned, the newly paved layer is distributed continuously and at high temperatures. Therefore, the sensed data can be seen as related to the newly paved layer if: distances between the locations between new and previous measurements are further than a threshold (for instance, twenty centimeters); and the measured temperature values are higher than a threshold (e.g. the ambient temperature). In this way, both individual characteristics of the georeferenced measurements and their interrelations are considered.
4.
Having the refined set of geo-referenced temperature measurements, the geometry of the paved layer can be identified. For this purpose, knowledge that asphalt layers are typically deployed continuously can be of use. In this way, if any two geo-referenced temperature readings are located relatively close to each other, it can be suggested that the asphalt mixture was also placed in-between them. This idea can be operationalized as the rule to interpolate values in-between geo-referenced temperature locations if the distance between any two temperature measurements is less than a threshold (e.g. one meter).
63
Figure 2. Disposition of the sensors located on the paver
From the perspective of transforming the input dataset to the final mesh, the outcome of each of the data processing steps of the proposed procedure are illustrated in Figure 3.
Figure 3. Data processing steps to identify geometry of the paved layer
The sensor readings collected during step 1 form an initial dataset, which is later used to geo-reference temperature measurements. The exact locations of temperature measurements can be identified based on the angles between the consequent paver’s locations and geometric interrelations between temperature and navigation sensors (step 2). Afterwards, the identified set of geo-referenced temperature measurements is 64
refined to identify if the measurements correspond to the newly paved layer. The measurements are removed from the dataset if their temperature values are lower than a threshold or represent earlier measured spots (for instance, if a paver stood still). Afterwards, the geo-referenced temperature measurements are linked to each other by applying a mesh generation technique, such as a Delaunay triangulation. The generated mesh edges allow interpolating temperature values in-between the measured points. In the final data processing step, the mesh is refined by removing some of the mesh edges. If a distance between measured points is longer than a threshold, the corresponding edge can be removed. At the end of this step the mesh representing the geometry of the paved layer is obtained. The algorithm of the data processing procedure is shown in Figure 4.
Figure 4. Algorithm of the data processing procedure to reconstruct geometry and the interpolated initial temperature distribution of the paved layer
65
To validate the proposed procedure, we implemented it within an information system prototype. The next section describes this effort.
3.4 Illustrative implementation of the procedure To develop a prototype that illustrates the proposed procedure, we followed the workflow for developing visualization-oriented information systems for construction sites suggested in [Vasenev et al., 2011]. In particular, we adopted the division between hardware-related aspects (equipment selection and organization of an infrastructure) and software-related elements (data processing and visualization) of the prototype. We developed the prototype in an iterative manner by following suggestions on implementing information systems with project teams using the ethnographic-action approach [Hartmann et al., 2009]. The implementation process included several visits to asphalt paving sites and the development of several interim information systems, which were discussed with paving experts. The resulting prototype was applied during two real asphalt paving projects.
3.4.1 Hardware-related aspects of the prototype To acquire sensor readings we devised a scheme of deploying hardware components as shown in Figure 5.
Figure 5. Disposition of hardware components of the prototype installed on construction equipment
To exactly document the temperature distribution behind the paver and accurately track equipment movements we employed two types of high precision sensors. To measure the temperature we utilize a Raytek MP150 temperature laser linescanner. This sensor 66
registers 1024 discrete temperature values per line with 150 Hz update rate. We also employ Differential GPS (DGPS) receivers, configured to receive correction signals from a Trimble SP851 base station and both GPS and GLONASS navigation satellites. In this way, these DGPS receivers account for both currently operational global operational GNSS (Global Navigation Satellite System). These sensors are located on the paver next to each other. The known geometrical interrelations between the sensors enable unambiguous geo-referencing temperature readings. The second DGPS receiver is located distantly and indicates the location of a roller. All sensors are connected to computation units (laptops) deployed at the paver and the roller. The laptop on the paver is configured to obtain sensor readings, align them, and transmit the aligned data over Wi-Fi to a MySQL database installed at another laptop. The second laptop can be positioned on one of the rollers or next to the road. This laptop is set up to store the data and visualize it. These visualizations represent initial temperature distributions of the paved layer together with the location of the second DGPS receiver. All devices including laptops and the linescanner use a 24V electrical supply available at the corresponding heavy construction equipment.
3.4.2 Software-related elements of the developed prototype The laptops utilized within the prototype perform computation tasks according to the proposed approach. The data preprocessing procedures are implemented using Visual Basic for Application, embedded in the Microsoft Excel software. This implementation was chosen to maintain earlier established data exchange procedures between the linescanner’s specialized software and Microsoft Excel. The second laptop hosts a MySQL database and executes a Matlab-based program to process and visualize the data. The program implements the algorithm illustrated in Figure 4. The second laptop can also demonstrate the visualization of the paved layer together with the location obtained with the help of the second DGPS sensor. The visualizations can be shown to a roller operator or to other construction specialists on-site. The data processing within the prototype is organized as follows. The first laptop reduces the level of detail of data streams, obtained from each sensor, before transmitting the readings to a server. This approach, suggested in [Vasenev et al., 2014a], provides efficient communication between different construction equipment. Initially, 1024 temperature points are obtained by the linescanner at 150 Hz update rate. Then, the specially configured linescanner’s software processes the readings and groups them to form twenty temperature zones per line. These zones are updated every second. Similarly, the update rate of DGPS readings is 1 Hz. Additionally, within the prototype we implemented a specialized function that ensures that the data will be successfully transferred from the paver to the roller. If the communication link between the equipment is temporarily unavailable, the corresponding dataset is re-sent once the data communication is re-established. To avoid unrecoverable loss of data potentially 67
valuable for future forensic and predictive analysis, the implemented prototype also stores sensor readings with the original high refresh rates locally. The second laptop is configured to process and represent the data using a Matlabbased program according to the algorithm listed above. The visualizations provided by this program are updated in close to real-time rate. In particular, the layer geometry is updated every four minutes and the location of the second DGPS receiver is updated every second. In this way, the user of the prototype continuously receives updates about the initial temperature distributions. These users, including roller operators and other construction specialists, can therefore see visualizations based on the mesh obtained with the help of the proposed procedure. Noticeably, the high level of detail provided by the utilized sensors degrades based on the design decisions made during the development of the prototype. The next subsection investigates the possible reduction of accuracy of the prototype.
3.4.3 Estimated accuracy of the prototype This subsection assesses the accuracy of the developed prototype. Clearly, the accuracy heavily depends on the environment where the construction process takes place. This section concentrates only on how design decisions made during developing and configuring of the prototype influenced the accuracy. Therefore, this section assumes that the prototype is utilized in conditions where the sensors can perform according to their specifications. The degradation in accuracy is therefore calculated for an abstract case when the paver moves with a relatively high speed of 10 m/min and distributes the asphalt layer 6 m wide. As high-end sensors are employed in the prototype, the initial accuracy of sensor readings is relatively high. According to the specifications, the accuracy of temperature readings sensed by the linescanner is ±3 centigrade with the repeatability of ±1 centigrade. The DGPS sensors utilized within the prototype are also highly precise and can provide centimeter-rate accuracy under favorable conditions. As mentioned, these sensors support the Real-Time Kinematic (RTK) correction and track navigation satellites from both GPS and GLONASS constellations. The major degradation in accuracy is caused by design decisions made during the prototype configuration. Mainly, these decisions were made to overcome the limited computing capacity of the laptop configured to compute the mesh representing the paved layer. These decisions are justified by the purpose of this research to illustrate the procedure, rather than to deliver a market-ready solution. As mentioned, we reduced the high update rate of the utilized sensors to 1 Hz before aligning the location and temperature data streams. This update rate is connected to a possible localization error, which depends on the speed of the paver. For instance, if a paver distributes 75 mm thick pavement with the mix delivery rate of 400 tons per hour, it can travel with 68
relatively high speeds up to 16.7 cm per second (10m/min) [Aapa, 2001]. This distance travelled during one second could thus become a localization error observable along the paver’s travelling direction. At the same time, some reduction in the localization accuracy also takes place in the direction orthogonal to the direction of paving. This is connected to the reduction of the amount of linescanner measurements from 1024 spots to 20 zones per line. To this extent, if the paved layer is 6 m wide, each zone possesses the temperature values averaged over the distance of 30 cm. Together, if a paver distributes a 6m wide layer at the speed of 10m/min in conditions favorable for utilizing the locations and temperature sensors, each geo-referenced temperature measurement will have the localization error less than 15 cm in both directions of paving and in the direction orthogonal to it. Given the accuracy of the temperature linescanner, the difference between the measured and the real temperature would be less than 3 centigrade. In principle, this accuracy can be seen as sufficient for the illustrative purpose of the prototype, which was tested during two real construction projects as described next.
3.4.4 Prototype tests The prototype developed to illustrate the suggested procedure was initially tested during a paving project near Wijhe in the region of Overrijssel, The Netherlands. A construction team formed by one paver and three compactors deployed and compacted about 300 tons of asphalt mixture. One of the localization sensors and an infrared temperature linescanner were installed at the paver and connected to the first laptop, while another localization sensor and the second laptop were located in a car next to the road. The second laptop was used to remotely represent the temperature distribution of the asphalt layer to roller operators and project managers during the asphalt construction operations. The illustration of the prototype in operation is demonstrated in Figure 6.
Figure 6. Employing the prototype to visualize the temperature of the paved layer. Courtesy of BAM Infra, Marco Oosterveld
69
During the test the prototype demonstrated its functionality to reconstruct the initial asphalt temperature distribution. As the requirement of the prototype to represent temperature distribution at a distance was fulfilled, the illustrative prototype was found functional. During the second field test the prototype was used to track the initial temperature distribution of the asphalt layer during a large paving project near the Dutch city of Leiden. The project included the construction of two pavement layers during two days. With an average amount of the paved asphalt mixture about 1650 tons per day, each of the constructed layers resulted in 25 meter wide and 500 meter long asphalt pavement strips. Similarly to the first case, the second laptop was utilized to demonstrate temperature distributions to the roller operator and the construction manager on-site. This laptop was located at one of the rollers and at times next to the road. One of the tasks of the second test was to acquire the data characterizing the compaction process. These data provide possibilities to quantitatively illustrate the outcome of each of data processing steps of the implemented procedure. Table 1 illustrates how the datasets are transformed by the described above data processing steps. For instance, the outputs of the implemented data steps when processing five hours of documented data are as follows. Firstly, the data processing procedure forms the initial set of geo-referenced temperature measurements based on the known geometrical disposition of the installed DGPS and temperature sensors. As demonstrated in Table 1, five hours of tracked data resulted in a dataset that included 43 520 geo-referenced measurements. Then, geo-referenced locations that did not correspond to the newly paved layer are removed from the set. According to the prototype configuration, the locations were removed from the dataset if their temperatures were below 70 °C or if new measurements were located closer than 0.2 m from earlier measured points. The refined dataset was formed by 26 699 measurements. Finally, a Delaunay triangulation was applied and the triangles with sides exceeding 1.7 m were to be removed. The resulted mesh can directly be represented to roller operators and other construction specialists. As a result of data processing, a geo-referenced model of the interpolated initial temperature distribution was obtained. The visualization of this model together with roller positions at specific moments of time is demonstrated in Figure 7. As the figure suggests, the proposed data processing procedure provides visualizations suitable to characterize locations of temperature differentials in relation to the position of the observer.
70
Table 1. Quantitative characteristics of the outcome of the data processing steps (reconstructed from the second test dataset) Data processing steps
Step 1: collecting and aligning data
Time periods 10:00-10:40 (Figure 7a)
10:00-12:00 (Figure 7b)
10:00-15:00 (Figure 7c)
Input data format: GNSS - [Paver’s Latitude, Longitude, Height, Timestamp] Linescanner - [Measurement 1, 2, ` 20, Timestamp] Aligned data format: [Measurement 1, 2, ` 20, Timestamp, Paver’s Latitude, Longitude] Data collected during 40 minutes
Data collected during 2 hours
Data collected during 5 hours
Step 2: forming a set of georeferenced temperature measurements
7 360 measurements (368 unique paver’s locations as aligned with 20 temperature readings per location)
28 700 measurements (1 435 paver locations)
43 520 measurements (2176 paver locations)
Step 3: refining the set of measurements
3 941 (number of measurements that correspond to the newly paved layer)
16 629 measurements
26 699 measurements
I = 33 230 triangles
I = 53 377 triangles
Tri = 31 092 triangles
Tri = 51 402 triangles
Step 4: refined triangular mesh
I = 7 837 (initial amount of identified triangles); Tri = 7335 (amount of triangles to visualize the layer after excessive triangles were removed)
Figure 7. Representing variations of initial temperature distributions with respect to the roller’s position at specific moments of time during the paving project: a) 10:40 – roller starts compacting a paved lane, b) 12:00 – roller compacts the lane paved next to the previous one, c) 15:00 – roller finished compacting the two paved lanes.
71
Altogether, during the two on-site tests, the prototype demonstrated its functionality to obtain the geometry and initial temperature distributions of the deployed asphalt layers solely based on sensor readings. As pavers during both test projects travelled at a speed significantly lower than 10m/min and widths of paved layers were less than 6 m, the temperature data was localized with the error less than 15 cm.
3.5 Discussions This paper proposes a procedure to reconstruct the initial asphalt temperature distribution based on readings acquired by sensors collected at the paver. Based on the suggested procedure, a specialized prototype was developed and tested, as described above. This section discusses the developed procedure, the envisioned use of it, as well as outlines the limitations of the conducted and possible future research.
3.5.1 Specifics and potential use of the suggested data processing procedure The procedure suggested in this paper demonstrated to be effective to reconstruct the interpolated temperature of an asphalted layer. By solving the task of reconstructing the geometry of the paved layer and its initial temperature distribution, which was not addressed before, the procedure differs from previous research conducted in closely related fields. The procedure explicitly accounts for the known specifics of the paving process. The procedure suggests how to process individual sensor readings, how to remove excessive data points, and how to generate the geometry of the paved layer together with the initial temperature distribution of the paved layer. To this extent, the procedure can be seen a novel technical contribution. The proposed approach also differs from existing approaches to reconstruct the asphalt layer geometry from sensor readings by describing how to map geometrical and temperature data collected during asphalt paving operations. As a result, the proposed data processing procedure extends the existing set of mapping algorithms. In addition to suggesting the procedure, this paper also illustrates how known specifics of the paving process can be used to derive data processing rules. This paper thus represents a case of how a priori knowledge about a particular construction process can be operationalized and aligned with commonly used data processing steps, which aim to identify an object of interest from multiple sensor readings. In our vision, carefully considering specific data processing principles corresponding to a priori knowledge of the object or process of interest can enrich data processing on a more general level. If such principles are identified and aligned as a “library” of different rule 72
datasets, the principles can be reused in different systems oriented to solve problems in closely related domains. For instance, formalized rules suitable to solve the needs of the asphalt paving domain can potentially assist in addressing the needs of earthmoving or infrastructure manufacturing activities in general. Such sets of rules can be seen as data processing mechanisms within the methodology for integrated computer aided manufacturing (e.g. in IDEF0 diagrams).
3.5.2 Possibilities for integrating the suggested procedure into existing solutions As mentioned above, several existing systems can already collect temperature data characterizing temperature distributions of paved layers. Yet, existing systems do not fully leverage the potential of these data. To complement the existing solutions, the suggested procedure can be integrated into existing systems (including those related to Continuous Compaction Control and Intelligent Compaction) and assist in reconstructing the temperature distributions sensed behind the paver. The described procedure can also benefit solutions that employ cloud computing. Realtime monitoring and uploading data to internet-based infrastructures is already accepted practice (see for example Trimble VIsionLink and TopCon SiteLink3D). Temperature distributions visualized according to the proposed procedure within the cloud will be useful for representing the temperature to different members of the construction team at once. Not only roller operators, but also project managers and quality control personnel would benefit from such visualizations. Altogether, we envision that paving practices will gain more from integrating the proposed procedure into already existing solutions, rather than using the proposed procedure unaccompanied. The suggested data processing procedure can also be of value with respect to multiple diverse applications. For instance, the identified as-built geometry of a paved layer could be integrated into existing road models (e.g. [Rebolj et al., 2008; Lee & Kim, 2011]). Besides, the geo-referenced model of the temperature distribution of the paved layer can be used as an input for AsphaltOpen software to visualize paving operations [Miller et al., 2011]. Also, the obtained model can enable assessing temperature fluctuations in asphalt pavements, such as described in Yavuzturk et al. [2005]. Supported by such systems, quality controllers could consider the specific road locations with significant temperature differentials and identify potentially problematic zones prone to early deterioration. In another scenario, these locations can be related to the outcomes of forensic analysis. This analysis can assist in investigating if identified damages at particular road locations correspond to the documented temperature differentials in the pavements. Moreover, with respect to analyzing the documented construction processes, the geometry of the layer can become the basis 73
for future data references. For instance, the interpolated initial temperature distribution can be related to geo-referenced data from other measurement devices, such as nuclear density sensors. Together, predictive and forensic studies can contribute to research in quality assurance and lead to the improvement of existing or development of new working methods. Finally, the initial asphalt temperature distribution by itself or in combination with the asphalt cooling models can form the input for specialized environments to facilitate explication of the tacit knowledge of roller operators [Vasenev et al., 2013]. Such environments can assist in collecting alternatives and identifying best practices related to how roller operators can handle changes in the initial temperature distribution of the paved layer. The in this way identified best practices can then be demonstrated to apprentice roller operators to suggest how to mitigate undesirable events that can negatively influence the compaction process.
3.5.3 Limitations and future research Although the suggested procedure can effectively function within its scope, several limitations characterize the described research. These limitations are related to the assumptions behind the procedure, specifics of the implementation of the information system prototype, and the conducted tests. Firstly, the major assumption behind the procedure implies that acquired data are directly availably for further data processing. In principle, existing solutions allow this assumption. Specialized solutions can already carefully document asphalt equipment movements [Bouvet et al. 2001], while data filtering techniques, e.g. automated Kalman filtering [Caron et al., 2006] or human-centered filtering [Vasenev et al., 2014b] can provide accurate input data. However, because pre-processing sensor readings is essential for successful further data processing, additional research could be suggested to study to what extent this assumption is justified. Another limitation of this research is related to the lack of studying how the suggested procedure can be continuously used. Although the proposed procedure indeed allows reconstructing temperature distributions of paved layers, in the proposed format the procedure does not specify how to efficiently update these distributions over time. The ability to continuously add new measurements to the created mesh without the need to re-apply a Delaunay triangulation might be central to industrial solutions. This task, next to the unexplored opportunity to adaptively modify the update rate related to the available processing and data communication capabilities, calls for future research. Additional research can also study possibilities to improve the data processing procedure. For instance, incorporating additional information, such as the expected geometry of the paved layer or the centerline of the road, could assist in reconstructing the paved layer. 74
In addition to the suggested procedure, the developed prototype also possesses some limitations. In the current format, the prototype is not intended for direct commercial use, as the purpose of developing it was solely to illustrate the functionality of the suggested procedure. The prototype was implemented using Excel and Matlab – tools suitable for rapid application development, but less appropriate for industry-scale solutions. These solutions might demand operationalizing the suggested procedure using other software development tools, such as C, C++, or Java. The corresponding operationalization could also suggest improvements of the procedure. Finally, due to the scope of this paper, the initial tests conducted with the prototype in the field were limited. Additional tests and further development of the prototype are therefore needed. Although the configured prototype has accuracy already suitable to illustrate the suggested procedure, this accuracy can also be easily improved. Slight adjustments of the data resampling procedure would be needed in this case. In particular, the number of temperature zones per sensed line can be increased and the update rate for the linescanner and the navigation sensors can be changed. Despite these limitations the suggested procedure to reconstruct the initial temperature from sensor readings on-site opens up possibilities for other research. For instance, the temperature distributions obtained with the help of the procedure can be used to create and validate cooling models of the deployed layers. Such advanced models could predict changes of the temperature of the asphalted layer. Communicated by means of specialized visualizations, these predictions could assist roller operators in making even better decisions on how to proceed with the compaction tasks. Furthermore, an advanced paving system, such as proposed by [Glee et al., 2012], can be organized around the known cooling model of the paved layer. As an example, specialized systems, which incorporate the proposed procedure, could identify best rolling patterns for specific project conditions and provide corresponding suggestions to roller operators.
3.6 Conclusions Despite the pressing need of constructing higher quality asphalt pavements, roller operators are short of information that can assist them in making timely decisions as to where direct their equipment. In particular, to the best knowledge of the authors no approach currently exists to inform them about the initial temperature distribution of the paved layer. Even though the relevant data are collected by a number of specialized information systems, the procedure how to process these data to obtain the initial temperature distribution of has not yet been proposed. This research proposes such a procedure.
75
The suggested procedure incorporates several data processing steps related to georeferencing, refining, and interpolating temperature in-between measured temperature spots. This non-trivial task is addressed with the help of rules derived from known specifics of the asphalt paving process. In this way, a model of the interpolated initial distribution of the paved layer is automatically created without the need to input additional information, such as a plan of the paving project. A prototype of an information system illustrating the suggested procedure was developed and tested during two real-world asphalt paving projects. These initial tests demonstrated the functionality of the procedure to reconstruct the geometry and the initial temperature distribution of a paved layer based solely on sensor readings. Ultimately, the suggested procedure to reconstruct an essential context factor – the initial temperature distribution of an asphalted layer – aims at providing significant information to decision makers to advance asphalt compaction processes. As asphalt compaction is critical for the roads’ lifetime, advancing these processes will lead to improvements in the transport infrastructure.
3.7 Acknowledgements The authors would like to thank Frank Bijleveld and other members of Asphalt Paving, Research and Innovation (ASPARi) network for fruitful discussions and providing access to asphalt paving projects. The authors are grateful to Seirgei Miller for his editorial advices. Also, the authors would like to acknowledge the Pioneering organization of the Twente region of The Netherlands for supporting this research.
3.8 References Aapa (2001). "Asphalt paving speed." Australian Asphalt Pavement Association, http://web.archive.org/web/20140306091351/http://aapa.asn.au/cms_files/ worktips31.pdf, last retrieved December 2014. Alexander, M. L. and C. S. Hughes (1989). "Compaction of asphalt pavement." Washington, D.C., Transportation Research Board National Research Council. Bijleveld, F. R., S. R. Miller, A. H. Bondt and A. G. Dorée (2012). "Too hot to handle, too cold to control – influence of compaction temperature on the mechanical properties of asphalt." 5th Eurasphalt and Eurobitume Congress, Istanbul, Turkey: 1-11. Bomag (2009). "Basic Principles of Asphalt Compaction." http://www.bomag.com/world/media/pdf/PRE109016_0901.pdf, last retrieved December 2014. 76
Bomag (2012). "Roller Integrated Surface Covering Dynamic Compaction Control." http://www.bomag.com/pl/media/file/PRE108070_1205.pdf, last retrieved December 2014. Bouvet, D., M. Froumentin and G. Garcia (2001). "A real-time localization system for compactors." Automation in Construction, 10(4): 417-428. Brilakis, I., F. Dai and S.-C. Radopoulou (2012). "Achievements and Challenges in Recognizing and Reconstructing Civil Infrastructure." in: Proceedings of the 15th international conference on Theoretical Foundations of Computer Vision: outdoor and large-scale real-world scene analysis. Dagstuhl Castle, Germany, Springer-Verlag: 151-176. Caron, F., E. Duflos, D. Pomorski and P. Vanheeghe (2006). "GPS/IMU data fusion using multisensor Kalman filtering: introduction of contextual aspects." Information Fusion 7(2): 221-230. Chadbourn, B. A., J. A. Luoma, D. E. Newcomb and V. R. Voller (1996). "Consideration of Hot-Mix Asphalt Thermal Properties During Compaction." Quality Management of Hot-Mix Asphalt, ASTM STP 1299, Dale S. Decker, (Ed.), American Society for Testing and Materials. Coelho, C., M. Straforini and M. Campani (1990). "Using geometrical rules and a priori knowledge for the understanding of indoor scenes." in: Proceedings of BMVC: 229-234. Commuri, S. and M. Zaman (2008). "A novel neural Network-based asphalt compaction analyzer." The International Journal of Pavement Engineering 9(3): 177-188. Fathi, H. and I. Brilakis (2013). "A videogrammetric as-built data collection method for digital fabrication of sheet metal roof panels." Advanced Engineering Informatics 27(4): 466-476. Floss, R. (2001). "Compaction Technology in Earthwork and Highway and Transportation Engineering." Munich, BOMAG GmbH & Co. OHG. Glee, K. C., D. R. Potts, P. T. Corcoran and T. L. Rasmussen (2012). "Paving system and method." US patent, publication number US8099218 B2, publication date Jan 17, 2012. Abd El Halim, A. O. Phang and R. C. Haas (1993). "Unwanted Legacy of Asphalt Pavement Compaction." Journal of Transportation 119(6): 914-932. HAMM (2014). "HAMM compaction quality." http://web.archive.org/web/20121014064028/http://www.hamm.eu/en/technologien/hcq/ index.html, last retrieved December 2014.
77
Hartmann, T., M. Fischer and J. Haymaker (2009). "Implementing information systems with project teams using ethnographic-action research." Advanced Engineering Informatics 23(1): 57-67. Intelligent Compaction (2013). "Executive summary, summer 2013." http://www.fhwa.dot.gov/construction/pubs/hif13051.pdf, last retrieved December 2014. Intelligent Compaction (2014). "What is intelligent compaction?" http://www.intelligentcompaction.com/learn/intelligent-compaction-fundamentals/whatis-intelligent-compaction/, last retrieved December 2014. Kapur, D. and J. L. Mundy (1988). "Geometric reasoning and artificial intelligence: introduction to the special volume." Geometric reasoning. K. Deepak and L. M. Joseph, MIT Press: 1-11. Krishnamurthy, B. K., H.-P. Tserng, R. L. Schmitt, J. S. Russell, H. U. Bahia and A. S. Hanna. (1998). "AutoPave: towards an automated paving system for asphalt pavement compaction operations." Automation in Construction 8(2): 165-180. Lee, S. H. and B. G. Kim (2011). "IFC Extension for Road Structures and Digital Modeling." Procedia Engineering 14(0): 1037-1042. Ligier, A., E. Wasle and H.-J. Euler (2010). "Application definition and tech. feasibility study." https://www.mobacommunity.com/servlet/JiveServlet/download/1181-11225/ASPHALT_D.3_App_Def_V2.0.pdf, last retrieved December 2014. Matlab (2014). “Delaunay triangulation”. http://nl.mathworks.com/help/matlab/ref/ delaunay.html, last retrieved December 2014. MAPA (2014). "Minnesota Asphalt Pavement Association: Asphalt Paving Design Guide." www.asphaltisbest.com, last retrieved December 2014. Martínez, J., A. Soria-Medina, P. Arias and A. F. Buffara-Antunes (2012). "Automatic processing of Terrestrial Laser Scanning data of building façades." Automation in Construction 22(0): 298-305. Miller, S. R. (2010). "Hot mix asphalt construction: towards a more professional approach." Ph.D. Dissertation, University of Twente. Miller, S. R., T. Hartmann and A. G. Dorée (2011). "Measuring and visualizing hot mix asphalt concrete paving operations." Automation in Construction 20(4): 474-481. Moreno, F. A., J. Gonzalez-Jimenez, J. L. Blanco and A. Esteban (2013). "An Instrumented Vehicle for Efficient and Accurate 3D Mapping of Roads." ComputerAided Civil and Infrastructure Engineering 28(6): 403-419. Peyret, F. (2000). "The Achievements Of The ‘Computer Integrated Road Construction’ Project." in: Proc. 17th Int. Symposium on Automation and Robotics in Construction, Taipei: 1-6. 78
Rebolj, D., A. Tibaut, N. Čuš-Babič, A. Magdič and P. Podbreznik (2008). "Development and application of a road product model." Automation in Construction 17(6): 719-728. Sullivan, C. and A. H. De Bondt (2009). "Greener, leaner, meaner." in: Asphalt Professional, September 2009: 18-23. Swaner, K. (2010). "The PAVE-IR System: Detecting Thermal Segregation and Much More." HMAT: Hot Mix Asphalt Technology, 15(6): 52 -54. TRAC (2001). "Construction-related asphalt concrete pavement temperature differentials and the corresponding density differentials." Washington State Transportation Center (TRAC), University of Washington, http://www.wsdot.wa.gov/research/reports/fullreports/476.1.pdf, last retrieved December 2014. Trimble (2014). "Trimble CCS900 Compaction Control System." http://www.trimble.com/construction/heavy-civil/machine-control/gradecontrol/ccs900.aspx, last retrieved December 2014. Turkiyyah, G. (2007). "Final Technical Report TNW2007-03, SIMPAVE: Towards Building Interactive Simulations for Planning." http://www.lib.washington.edu/Msd/norestriction/b60940657.pdf, last retrieved December 2014. Vasenev, A., F. R. Bijleveld, T. Hartmann and A. G. Dorée (2011). "Visualization workflow and its implementation at asphalt paving construction site." in: CIB W78W102, Sophia Antipolis, France: 1-10. Vasenev, A., T. Hartmann and A.G. Dorée (2013). "Employing a virtual reality tool to explicate tacit knowledge of machine operators." in: ISARC 2013, the 30th international symposium on automation and robotics in construction and mining, Montreal, Canada: 1-8. Vasenev, A., T. Hartmann and A. G. Dorée (2014a). "A distributed data collection and management framework for tracking construction operations." Advanced Engineering Informatics, 28(2): 127-137. Vasenev, A., N. Pradhananga, F. R. Bijleveld, D. Ionita, T. Hartmann, J. Teizer and A. G. Dorée (2014b). "An information fusion approach for filtering GNSS data sets collected during construction operations." Advanced Engineering Informatics 28(4): 297-310. Veda (2014). "Veda Data Management and Analysis Software – Intelligent Compaction." http://www.intelligentcompaction.com/veda/, last retrieved December 2014.
79
WRA (2014). “The importance of road maintenance”. World Road Association, http://www.erf.be/images/Importance_of_road_maintenance.pdf, last retrieved December 2014. Yavuzturk, C., K. Ksaibati and A. Chiasson (2005). "Assessment of Temperature Fluctuations in Asphalt Pavements Due to Thermal Environmental Conditions Using a Two-Dimensional, Transient Finite-Difference Approach." J. Mater. Civ. Eng., 17(4): 465–475.
80
Chapter 4. An information fusion approach for filtering GNSS data sets collected during construction operations3 Global Navigation Satellite Systems (GNSS) are widely used to document the on- and off-site trajectories of construction equipment. Before analyzing the collected data for better understanding and improving construction operations, the data need to be freed from outliers. Eliminating outliers is challenging. While manually identifying outliers is a time-consuming and error-prone process, automatic filtering is exposed to false positives errors, which can lead to eliminating accurate trajectory segments. This paper addresses this issue by proposing a hybrid filtering method, which integrates experts' decisions. The decisions are operationalized as parameters to search for next outliers and are based on visualization of sensor readings and the human-generated notes that describe specifics of the construction project. A specialized open-source software prototype was developed and applied by the authors to illustrate the proposed approach. The software was utilized to filter outliers in sensor readings collected during earthmoving and asphalt paving projects that involved five different types of common construction equipment.
4.1 Introduction Documenting the movement of construction equipment during construction projects is helpful in controlling and continuously improving construction operations. Specifically, the documented trajectories of construction resources (personnel, equipment, and material) allows to analyze travel patterns of construction workers [Teizer et al., 2007; Teizer et al., 2008], assess equipment operators' work [Pradhananga & Teizer, 2013], labor activity [Cheng et al., 2013], or study variability in construction processes [Miller, 2010; Miller et al., 2011]. Though available technologies such as GNSS (Global Navigation Satellite System), laser positioning, or ultra wideband (UWB) provide opportunities to track movement of the resources with high precision [Cheng et al., 2011; Cheng et al., 2012; Cheng & Teizer, 2013], any such data collection will yield erroneous measurements because of a multiplicity of external factors. Examples for these errors are outliers in documented 3
This chapter has been published as: Vasenev, A., N. Pradhananga, F. R. Bijleveld, D. Ionita, T. Hartmann, J. Teizer and A. G. Dorée (2014). "An information fusion approach for filtering GNSS data sets collected during construction operations." Advanced Engineering Informatics 28(4): 297-310.
81
readings that inaccurately represent equipment's location at specific time. For instance, GNSS measurements can show a position that cannot be realistic in relation to the corresponding timeframe: a resource (e.g., construction equipment) moved into a new location rather too quickly or changed orientation in a manner that is physically impossible (e.g., an asphalt roller rapidly changes its direction by an angle larger than the one specified by the roller's manufacturer). The described outliers occur because of the absence, poor strength, or reflections of navigation signals. In case of GNSS, such conditions are related to an absent or obscure line-of-sight between the GNSS tracker and the GNSS satellites. For instance, the line-of-sight can be affected by atmospheric effects and objects that obscure the satellites visibility, such as trees, overhead bridges, or other obstacles located on or next to a construction site. To allow a sound understanding of the equipment's movement, all outliers should be filtered out before analyzing the collected data. Often, such filtering is performed by applying statistical techniques, such as moving average methods to smooth trajectory data or by relating the equipment movements to the expected moving trajectories [Imran et al., 2006]. Alternatively, simultaneously collected readings from different types of sensors can be fused to automatically cross-relate different readings and remove outliers. Examples of correcting equipment paths in such a way include fusing signals from GNSS devices and inertial measurement units [Caron et al., 2006], utilizing deadreckoning sensors (including Doppler radar, encoder, and fibre-optical gyrometer) [Peyret et al., 2000], and combining readings from different sensors by applying Kalman filtering [Rezaei & Sengupta, 2005; Herrera et al., 2013]. Though such automated filtering methods can often significantly improve the accuracy of the documented equipment paths, such methods can also erroneously remove path segments related to specific movements of the equipment [Bijleveld et al., 2011]. For instance, if a dump truck rapidly reverses its heading direction due to some events onsite, the automated filtering methods can misinterpret the corresponding sensor readings as erroneous data and remove tracked points that do not represent outliers. In practice, filtering out such valuable data can result in an incorrect understanding of the construction equipment's trajectory and lead to erroneous data analysis, for example during safety assessment while evaluating near-misses. As quick unexpected direction changes are a common cause for near-miss accidents, the automated filtering mechanisms can negatively affect the search for such events. To avoid removing accurate but rather unexpected path segments, having additional information about equipment movements to inform GNSS data filtering process is needed. To advise the process of filtering outliers in sensor readings the “hard” (sensor-based) data can be related to the “soft” data (human-generated records) that describe the project context and the conducted activities. These human-generated data can, for example, be collected in the form of a logbook, which describes how equipment moved 82
on-site as well as essential process events, and be collected in a formalized [Pravia et al., 2009] or a standard- free format. Specifically, the events could be documented when a piece of equipment starts new activities, stops due to a breakdown, or alters its moving strategy can support the analysis of a particular trajectory segment, which may include an outlier. Alternative to maintaining a log-book during the construction project, a human observer can generate valuable soft data afterwards by retrospectively analyzing video recordings of the project. Besides using additional soft data sources, the involvement of a human into the data analysis can additionally improve the filtering process. Specifically, human cognitive abilities can be related to fusing information from different sources, including sensororiginated and human-generated records. Among others, such abilities include recognizing visual and aural patterns, applying semantic reasoning [Hall & Jordan, 2010], and interconnecting different elements and objects according to world models, physical laws, and geometric constraints [Cho et al., 2002]. Moreover, humans can also improve fusion processes by applying a priori knowledge about the environment and genuinely processing human-generated data [Raol, 2009]. In other words, the process of fusing information can directly benefits from human abilities “to gather and organize unstructured, a priori information about a problem and then mix that information with measured sensor data, making inferences that could not have been made using the sensor data alone” [Bath et al., 2005]. Because of these advantages, it is not surprising that engaging humans into the processes of fusing information is strongly recommended in the information fusion literature [Blash & Plano, 2002; Blash & Plano, 2003; Nilsson et al., 2012]. To secure the benefits of employing a human expert into filtering trajectories of the construction equipment, it is essential to meaningfully organize interactions between the expert and the documented hard and soft data. In particular, the interactions should aim to assist experts in filtering equipment paths in a way that the experts can apply their a priori knowledge and expectations about how equipment can move during construction. At the same time, there is a necessity to structure the approach to reduce the human involvement to an acceptable level, because if the expert is overloaded with information, some outliers in larger data sets can easily be overlooked. A suitable approach to meet these requirements and integrate both “hard” sensor- and “soft” human-generated records could benefit from Information Fusion (IF) principles that aim at fusing any kind of data [Raol, 2009; Khaleghi & Karray, 2012; Pravia et al., 2009]. Based on the information fusion principles, this paper proposes a human-centered information fusion approach oriented to meaningfully utilize sensor readings and human-generated data that describe expected equipment movements. Within the approach a human expert is directly involved into filtering equipment trajectories: the expert defines the initial search parameters to identify potentially erroneous path segments and decides if the segment contains outliers. Additional information about the 83
project specific conditions and its context inform the expert's decisions if path segments within spatial and temporarily constrains are potentially prone to outliers. In summary, the approach structures how both hard and soft data are represented to an expert who analyses collected equipment trajectories and soft data in conjunction with personal knowledge and understanding how equipment is expected to move during specific time periods and at particular locations. The following section of the paper introduces the major concepts related to information fusion in general. Then, the proposed human-centered approach to filter GNSS data follows. Later, the paper depicts how the implementation of the approach was embodied as open-source software and describes how the developed software was tested to filter paths of asphalt paving and earthmoving equipment. Results and findings are presented and discussed before the paper concludes.
4.2 Information sources beneficial for filtering documented trajectories of construction equipment 4.2.1 Overview of sensor-originated readings that constitute hard data The most commonly used technologies to document equipment movements during construction include laser based positioning and GNSS sensors. For example, laser guided systems generally allow obtaining highly precise positioning data, providing an unobstructed direct line of view between the positioning station(s) and the tracking equipment can be maintained. However, additional stations to track equipment during large projects might be required in case buildings or trees are located on or next to the construction site. Alternatively, GNSS sensors can be utilized to track equipment over large distances but with less accuracy than laser guided systems. At the same time, the location accuracy of GNSS sensors can be improved by additional correction, e.g. by using a Differential GPS solution that transmits such data to multiple GNSS sensors in real-time. Typically, global navigation tracking solutions can be particularly useful to track equipment that move on distance from the construction site, such as hauling trucks. The choice between these systems should be made according to specifics of a construction project. As an example, for road paving processes GNSS solutions tend to be preferred to track these processes because the equipment continuously moves around on a construction site that also shifts. Nevertheless, both laser guided and global navigation systems are susceptible to a certain degree to the context of equipment tracking and can eventually include outliers in the documented equipment paths. 84
Compared to GNSS and laser based positioning, other technologies that document equipment movements are less adopted in practice. Examples of such less-utilized technologies include UWB sensors and computer vision tracking solutions. These technologies, similarly to the previously described, also do not guarantee outlier-free readings. In particular, UWB-based sensors can experience occlusion of tracking signals, while computer vision technologies additionally can suffer from other external factors, including dust and lighting conditions. In summary, though several technologies provide opportunities to document equipment movements, the accuracy of the documented paths is influenced by a construction project's specific context. Eventually, as every technology will yield outliers in the documented equipment paths, having additional data sources is desired.
4.2.2 Human-generated records: soft data To support judgment of whether a particular segment of the documented trajectory paths corresponds to an outlier or not, additional descriptions about the equipment movements are useful. Particularly, human-generated notes (“soft data” as opposite to “hard” sensor readings) about the progress of the construction process could be of value, because humans can depict certain attributes of interest [Nilsson et al., 2012] and suggest specific inferences, such as specify relationships between entities [Rezaei & Sengupta, 2005]. Soft data can be related to hard data within both temporary and spatial domains. For example, the time stamp of a particular human-generated record might suggest to carefully examine the hard data collected at nearly the same time. Similarly, notes can indicate which locations of a specific project are particularly prone to inaccurate measurements, such as areas adjunct to high-rise buildings that can obscure navigation signals from satellites. From another perspective, parallel soft and hard data can support assessing uncertainty of soft data through the lens of the hard data [Khaleghi & Karray, 2012]. This interrelation of soft and hard data within time and spatial domains confirms that the two types of data go hand-in-hand and complement each other. As an example, a site manager involved in an asphalt paving project can produce soft data by making notes regarding how equipment operators’ intent to co-operate and what events took place on-site. Such notes could include records when specific operations started, when trucks arrived, as well as any other relevant incidents, for example, if a roller discontinued operating due to breakdown or the need to refill its water tanks. Once collected, the available soft and hard data need to be meaningfully processed according to some rules that will help to identify outliers. To demonstrate developments in the field of information fusion the next section depicts most common information 85
fusion models. Later, the human-centered approach to combine hard and soft data related to filtering paths of construction equipment will be introduced.
4.3 Fusion of information To benefit from the potential explanatory power of human-generated notes (soft data) that describe events and how entities on-site were linked, soft data should be meaningfully related to the documented sensor readings. Ultimately, this relation might support making decisions about whether a particular segment of an equipment path contains outliers or not. The existing information fusion models allow systematic consideration of procedures to process data from different sources. This section briefly overviews such models. Probably, the most widely accepted approach to categorize merging information from different sources started to develop with the introduction of the Joint Directors of Laboratories (JDL) data fusion model, proposed by the corresponding subpanel in 1991 [Hall & Jordan, 2010]. The succeeding evolution of the model involved the introduction of two additional levels of fusion (data preprocessing and human-computer interaction) to depict the need for introducing the human into fusion processes. While the JDL model was then employed in different research lines, including tailoring it to tasks of the civil engineering domain [Haas, 2006; Razavi & Haas, 2010; Shahandashti et al., 2011], the model has also been criticized because the active role of human users in fusion was not taken into account sufficiently [Blasch, 2006]. Specifically, as a functional model, the JDL aims “to facilitate understanding and communication among managers, theoreticians, designers, and evaluators as well as users of the data fusion systems” [Razavi & Haas, 2010] and less concentrate on describing how the user can be incorporated into specific elements of the fusion systems. For structuring the possibilities to involve humans into information fusion, the JDL model was extended by the fusion community to λJDL [Lambert, 2003] and the visual data-fusion models (as described in [Bossé et al., 2007]). A particularly noticeable upgrade to the JDL model was introduced by the Data Fusion Information Group's (DFIG) model [Blasch, 2006]. The model (see Figure 1) is constituted by several levels that are directly related to the elements of the aforementioned JDL model.
86
Figure 1. Data Fusion Information Group (DFIG) 2004 model (reconstructed based on the model from [Blasch, 2006]).
Essentially, the DFIG model proposes to perform human-centered fusion to estimate and predict relations among different objects in order to assess the situation in hands. In this way, the complicated fusion tasks are to be performed by humans due to their natural sense-making abilities related to estimating states and predicting relations among entities. Altogether, the developments in the field of information fusion increasingly acknowledge the role of humans in information fusion processes. These considerations can be taken into account to develop approaches for filtering outliers in documented construction equipment trajectories. In this setting, human reasoning can support every aspect of the filtering process, including soft data processing, comprehending situations described by both hard and soft data, and deciding if a specific path segment is an outlier. The next section introduces the information fusion approach that benefits from the listed factors.
4.4 Information fusion approach to filter trajectories of construction equipment The active involvement of the user is required to meaningfully perform numerous knowledge-intensive tasks, such as supervising complex systems [Gentil & Montmain, 2004] and applying context-sensitive knowledge for the needs of engineering tasks at hands [Song & Jiang, 2013]. In the civil engineering domain several information systems already rely on the decisions of human operators involved in the data processing loop (see for example [Cho et al., 2002; Kim & Haas, 2000]). Nevertheless, according to the best of the authors' knowledge, no approaches have been suggested on how to incorporate human reasoning in fusing hard and soft data in order to filter outliers in documented equipment paths. 87
To address the described gap related to filtering outliers in documented equipment paths this paper proposes a user-centered information fusion approach (Figure 2). As central element the approach adopts the model of human decision making as introduced by Boyd in the mid-1950s [Nilsson et al., 2012]. The model organizes the decision making process as a loop formed by the four steps: Observe, Orient, Decide, Act (OODA). These steps aim to help differentiating information gathering, analysis and implementation activities by describing important aspects of decision making without excessive burden of details [Bryant, 2003].
Figure 2. Information fusion approach for retrospective analysis of the positional data by an expert.
Within the here proposed approach, the OODA steps are laid out to govern interactions between the expert and the software to support data processing. In this set up, experts can make decisions if a path segment is an outlier based on available hard and soft data aligned with experts' understanding of how equipment can move in general, during a specific project, and within particular time and spatial boundaries. The expert's knowledge can be outlined as a set of interdependent rules. This set of rules supports the expert during the “orient” and “decide” phases of the decision making loop. Within the proposed approach three interdependent groups of rules are outlined: general (how equipment can and cannot move), situated (equipment movements during 88
different phases of the project with respect to time or spatial limits), and operationalized (movements at specific time periods). According to the rules, an expert can deduce expectations on how equipment can move during specific periods of the project. The expert can then consider these expectations and judge whether sensor readings collected during those time periods include outliers. The “general rules” are based on equipment characteristics and describe how particular construction equipment can move due to their specifications. For instance, different equipment can have specific limitations of the maximum speed or the turning angle. Also, certain behavior can be expected according to the equipment's purpose (for instance, a roller often reverse its travelling direction or an excavator might repeatedly turn around its axis). These equipment-specific rules describe how the equipment typically moves without considering specifics of a particular project. Consequently, the general rules supply an expert with an initial understanding about how specific equipment can move in general and during the examined project in particular. The “situated rules” describe how construction equipment can move during the analyzed project. Such rules are related to general rules and to project-specific information, for instance to assumptions about the expected movement patterns in relation to particular projects. In these settings, the equipment's maximum speed during the project can be expected to remain considerably less than the maximum speed specified in the equipment's specifications. This assumption suggests to scrutinize specific elements of equipment paths, where (or when) the collected sensor readings can possibly include outliers. For example, the user can consider (1) a temporary period when an equipment is not expected to make rapid turns and move faster than a certain speed due to the geometry of the construction site; and (2) a spatial area where outliers can be grouped, thus if a single outlier was identified, the following documented equipment locations should be carefully analyzed as potentially prone to errors. The situated rules are interrelated with the “operationalized rules”. These rules exist in relation to a particular equipment path's segment. In this way, experts can judge whether the segment includes an outlier or if the sensor readings accurately describe equipment movements. Such judgments are rooted in situated rules and supported by visual representations of the documented equipment's path and additional soft data. The operationalized rules can, in turn, influence the situated rules. For example, the existing expectations about the maximum equipment's speed during the analyzed project can be updated if that equipment had begun to move faster than expected. Similarly, if experts identify too many outliers within the project, they can adjust personal assumptions about how the collected sensor readings are reliable in general. Such assumptions can then be operationalized by changing the parameters to automatically search the next outlier. For instance, if experts identified that outliers tend to form groups, they can adjust parameters in a way that the software will critically analyze several consequent data points after one outlier will be identified. 89
Within the proposed classification of rules, the situated rules are central in describing how equipment can move during the analyzed project. These rules, if described as statements, can support the automated search for outliers – the core of the expert's interactions with the supportive system. For instance, statements to support the search for outliers can have the following formats: (1) “the maximum angle between the previous and current heading of the equipment should not exceed '20' degrees”; (2) “the equipment's maximum speed should not exceed '2.7' m/s”; (3) or “after identifying an outlier the next path points should be automatically checked and the outlier limit should be extended until N consequent path points appear to be correct according to the expected equipment movements”. Once the statements are formalized, they become a central element in the proposed IF approach to refine the documented equipment paths. The expert can use the statements as search parameters, requesting the software to find next outliers. The formalized statements to find the next outlier are related to the situated knowledge (these interrelated elements are shown with dark background in Figure 2). After the next outlier is identified, the expert can change limits or eliminate the outlier. The expert can correct the path segment if the selection appears to be an outlier according to the available hard and soft data. These hard data corresponds to the documented elements of equipment paths right before and after the selection and soft data are related to the available human-generated information. The sequence of the possible actions is not predefined. For example, a user can find the next outlier and remove it without adjusting the outlier's limits. Similarly, the rules to search for next outliers can be changed at any time. In addition to the described automated search for outliers, a possibility to manually define the beginning of an outlier without using an automated search should also be provided. Overall, different sets of rules can characterize movements of construction equipment that correspond to different states such as those during which the equipment is idle, performs specific operations (such as paving, compacting, or excavating), or relocates to another position without carrying out specific operations. In this respect, the humangenerated data about equipment activities with references to specific time periods can highly benefit the path filtering process as the expert can relate particular time-based on special-based segments of equipment paths to the expected equipment's behavior.
4.5 Procedure to validate the proposed approach As mentioned, currently no method suggests a way to incorporate human reasoning to fuse hard and soft data for filtering outliers in documented equipment paths. To address the gap, the previous section proposed a human-centered fusion approach based on information fusion concepts. To validate the approach, the research strategy included the following procedure: Based on the proposed approach the authors of this paper developed a software 90
prototype that allows to import and visualize previously collected hard (GNSS sensor readings) and soft (specifically, a log of the construction project) data. The functional elements of the prototype were designed in direct correspondence to the components and the interconnection structure of the proposed information fusion approach (as demonstrated in Figure 2). Thus, the functionality of the graphic user interface of the prototype allows experts to convey – during the “act” step of the OODA loop – decisions made during the “decide” step, while visualizations inform the “observe” step, which reinforces the “orient” step of the loop. The developed software prototype is described in more details in the next section. The developed software was applied by the authors to examine paths of five different construction equipment (paver, roller, truck, excavator and dozer) that were involved in two distinct types of construction projects: asphalt paving and earthmoving. The purpose of the examination procedure was to inspect if the provided functionality can assist an expert in filtering outliers in documented (by using GNSS technologies) equipment paths according to the expert's understanding about expected movements of the equipment on-site. The application of the developed prototype is described in section 4.7.
4.6 Development of the software to filter and visualize outliers in equipment trajectories The information fusion approach was operationalized in a software application to locate and eliminate outliers in documented equipment paths. This application was developed by the authors within the research track of the VISICO center of the University of Twente, The Netherlands, and is available as open-source software. The graphical user interface (see Figure 3) was developed according to the suggested information fusion approach and support an expert in steps “act” and “observe” of the described OODA loop. In particular, several interface elements simultaneously represent hard and soft data by displaying the overall path of the equipment and a selected path segment next to the log of the project. The demonstrated logbook represents an example of soft data and ultimately aims to inform the user regarding the details of the construction project in addition to the automatically collected data. Once informed about specifics of the process, the software user can relate them to elements of equipment paths and exercise expert judgment to decide if those elements correspond to outliers or reflect real equipment movements. The major part of the software interface visualizes hard sensor readings to support users in visual examination of the displayed path for evident outliers. Such analysis, rooted in human abilities to identify visual patterns, can naturally support rapidly filtering large groups of evident outliers. 91
92
Figure 3. Graphical user interface of the open-source application developed according to the suggested information fusion approach.
In addition to providing opportunities for human exploration of the data, the software allows to search for the next outlier automatically. The user can choose between two means to detect outliers: angle-based search (by setting the maximum expected equipment's turning angle) and speed-based search (by defining the maximum expected speed of the equipment). Correspondingly, the next outlier will be identified either if the equipment direction significantly differs from the previous heading, or if the adjunct path points are located too distant from each other. After an outlier was identified, the program considers the next N data points. The user-entered value N – called the “intolerance level” – defines the amount of consequent points that should automatically be considered as being potentially incorrect. If another outlier is identified within the path between the next N location points, the limits of the selected outlier interval will be automatically increased to include that outlier as well. This option allows identifying groups of outliers. Users can (re-)define the limits that define an outlier by moving a dedicated horizontal slider. Then, the user can meaningfully relate the selected path with the soft data (logbook) that is displayed next to the path visualization. If the selected interval is considered as an outlier, the interval can be adjusted. While different interpolation techniques can be applied to eliminate outliers, in the developed software a linearization function was implemented by the authors, as it provides necessary functionality without introducing additional need to adjust specific parameters (and potentially communicate them with the user for fine-tuning). The last linearization can be undone, for example, if that action was performed by mistake. In summary, removing an outlier is a three-step procedure. First, the expert can manually or automatically identify and select an untrustworthy path segment according to personal expectations on how specific equipment should move at a construction site. Then, the selected path segment can be related to human-generated data to justify decisions if the segment is an outlier. Finally, the expert can remove the outlier or search for the next doubtful path segments based on the same or different search parameters. As indicated, the components of the developed software prototype naturally correspond to the elements of the proposed information fusion approach. As a result, the prototype provides the expert means to observe and act according to her/his decisions if a specific path segment is an outlier to be removed. As the purpose of the approach is related to filtering outliers in GNSS Data sets collected during construction operations, the prototype was applied to filter outliers in documented paths of earthmoving and asphalt paving equipment. The next section describes the details of these applications.
93
4.7 Application of software To test the applicability of the proposed approach to filter outliers in paths of construction equipment the developed software was applied by the authors to analyze the paths of five different types of equipment involved in asphalt paving and earthmoving operations. The authors have had previous experience in processing GNSS data collected during construction operations. The analyzed construction equipment trajectories were gathered by the authors by means of two different classes of GNSS devices. Each class was utilized to collect a separate dataset that corresponded to a specific type of construction operations. In particular, several inexpensive GPS devices (Wintec G-Rays 2) were used for tracking movements of earthmoving equipment and highly precise Differential GPS (Trimble SPS851 DGPS) to track asphalt paving operations. The latter high-end receivers estimated equipment positions based not only on transmission signals from GPS, but also from GLONASS navigation satellites. By employing different classes of GNSS devices, the conducted tests illustrate the applicability of the proposed approach to filter outliers without being limited to a particular device class, as sensor readings obtained by utilizing either highly or less precise sensors eventually include outliers. This section is organized as follows: first, specifics of equipment movements on-site are depicted. Then, the short description of the construction site context follows. Finally, examples of filtering particular segments of documented equipment paths are shown.
4.7.1 Data filtering in earthmoving operations One of the most common ways to follow construction activities is to attach broadly available low-priced GNSS receivers to construction equipment. As this practice is being extensively adopted, eliminating outliers in equipment trajectories obtained by using these less precise tracking devices is essential before conducting further data analysis. The developed software to filter trajectories was applied to illustrated filtering outliers in paths of earthmoving equipment, documented by using such conventional sensors. The additional description of the utilized low-cost GPS data logging devices and their relative accuracy analysis can be found in [Pradhananga & Teizer, 2013]. As a part of validation of the proposed method an earthmoving project involving a number of dump trucks, two excavators, and a dozer was selected. Trajectories of the equipment were documented during construction of the Engineered Biosystems Building (EBB) at the Georgia Institute of Technology, Atlanta, USA (see Figure 4). The entire site was 120m x 100m in dimension with a total volume of excavation of 40,000 cubic yard (CY) (30,600 m3) of earth.
94
Figure 4. GPS tags mounted on an excavator and a truck (left), data collection site (right)
As in the scope of the proposed approach the understanding and expectations how equipment typically conduct their work is central, the next section depicts specifics of equipment movements.
Specifics of equipment movements in earthmoving projects Dump trucks: Dump trucks are unique equipment that operate similar to automobiles on normal roads but exhibit different behavior at construction sites. In relation to the opportunities to filter outliers according to angle- and speed-based search options, the maximum turning angle and the maximum equipment' speed can be obtained from the equipment specifications (e.g. [Nunnally, 1998; Hitachi, 2014]). Additional information, such as suggested 16 km/h speed limit on-site (e.g. according to [Flintco, 2014]), could guide experts in making their decisions about suspicious path segments. Noticeable, though the speed limit can supply speed-based search, the human reasoning is still important to judge if a particular segment is an outlier or correspond to speeding onsite. Hence, soft data collected by a human observer can assist in making such decisions. The potentially valuable soft data in this case can include notes (as elements of the log of the project) when the truck enters and exits the construction site and how it moves from one specific zone on the construction site to another. As the operation sequence is known (typically a truck passes through a driveway, moves inside the pit and stops for loading and cleaning), the corresponding timestamps can help in path filtering by suggesting what search rules can be applied for different operations. For instance, to 95
filter segments that correspond to the travelling along the driveway, an angle-based search can be used in connection to considering the geometry of the driveway. Then, during the travel, the truck's maximum allowed speed is limited due to presence of other construction equipment and workers, therefore a speed-based search can be utilized. Excavators: Typical operations of the equipment include swinging movement for the most time and occasionally travelling from one working location to another. As the angle-based search could not be suggested to search outliers according to the specifics of equipment movements, the speed-based search can be of use, especially for filtering paths that correspond to the equipment travel paths. In this case, information about the equipment's maximum travel speed (e.g. 5.5 km/h for Komatsu PC 400 LC [Komatsu, 2014]) can support automatic identification of segments that can refer to outliers. Another type of earthmoving equipment – Dozers – typically move linearly to push the earth but also can rotate about its axis and change direction of movement from forward to backwards. Similar to other equipment, the maximum speed can be found in the equipment specifications (e.g. in [John Deere, 2014] for John Deere Crawler Dozer 750C). As dozers can be idle or typically move in straight path during its operation, recording timestamps for when the equipment becomes idle or starts operating can advise an expert in applying the angle-based search for the linear movements that occurred during normal operating procedures. All three types of the described construction equipment were involved in the construction project described earlier. The equipment trajectories were documented by the authors during the project and then processed using the developed software to filter outliers in equipment paths, as described next.
Description of data collection during the earthmoving project GNSS paths of equipment involved in the chosen earthmoving project were collected during the entire work shift that lasted between 6:30 AM to 5:30 PM. The low cost portable GNSS devices gathered the equipment trajectories at the update rate of 1Hz. To assist in identifying outliers manual observations were made and the timestamps when the working context of the equipment changed were noted down. The excerpt of the soft data for different equipment is presented in Table 1. Noticeable, the level of granularity of the soft data was not predefined. While the illustrative excerpt shows that the truck operations were tracked precisely; descriptions related to other equipment had fewer details. However, even the less detailed descriptions can also support the identification of activities on-site and therefore inform the experts' filtering task, as described further.
96
Table 1. Sample of the human-generated data Type of equipment
Timestamp
Description
Dump Truck
2:57:40 PM
Entered the site
2:59:36 PM
Entered the pit
3:03:44 PM
Start loading
3:05:06 PM
Loading complete
3:06:01 PM
Cleaning
3:06:44 PM
Exit
6:03:44 AM
Moved inside the pit
6:08:31 AM
Loading
6:51:20 AM
Stopped (no trucks)
7:02:33 AM
Loading
6:45:45 AM
Started working
7:15:42 AM
Stopped
7:22:28 AM
Started working
8:02:55 AM
Stopped
Excavator
Dozer
Applying the developed software to filter outliers in equipment movements during earthmoving operations Filtering paths of dump trucks: Trucks trajectories were documented only within the construction site, as the sensors were attached when trucks arrived on site and then removed at the exit gate. The left part of Figure 5 shows trajectories on-site collected by a tracking sensor throughout an entire workday. This figure similar to all figures presented later is a screenshot of the graphical user interface of the developed software and demonstrates the functionality of the developed program to overview equipment movements throughout a working shift along with selecting a segment that corresponds to a particular period of interest. The path segment represents a single loading cycle of a truck highlighted in the figure by applying visualization limits that correspond to the timestamps obtained from the soft data. Since the truck paths differ across varying loads, the human involved into the filtering process can identify outliers by comparing a particular trajectory with trajectories corresponding to other loads. In this way, the understanding of how equipment moved during the entire work shift can support an expert in considering what parameters can be applied for the automated search for outliers. The regions 1, 2, 3 and 4 highlighted in the left part of the Figure 5 97
are shown in more detail on the right side of the figure to demonstrate the identified outliers as well as how the path segments appear after eliminating these outliers.
Figure 5. Trajectories of trucks on the construction site collected by a GPS tag throughout the working day (on the left); path segments with outliers identified either manually or automatically and path segments after the outliers were removed (on the right)
Overall, Figures 5, 6 and 7, 9, and illustrate the way the proposed information fusion approach can be applied by showing (1) the initially collected sensor readings next to (2) several enlarged areas that show path segments before and after eliminating the outliers. As filtered GNSS paths normally appear largely similar to visualizations of the as-collected GNSS data and thus require enlarged areas similar to those demonstrated, the illustrations of filtered paths are not included in this paper. In particular, to identify outliers in the documented GNSS data related to earthmoving operations, the authors applied the developed software prototype in the following way. Some evident outliers were located manually, while others were found automatically by applying the angle-based search with the assumption that a turning angle should be less than 40°. The outlier selection and linearization were performed with respect to both hard and soft data at hand. The manual selection was performed by the authors to filter out evident outliers according to the visualized sensor readings. Some visually obvious outliers that contained a large number of obviously erroneous points were identified and filtered out manually. Then, the software user applied automatic search for outliers to detect other (visually less noticeable) outliers that included relatively small number of erroneous points. 98
Filtering path of the excavator: The working shift of an excavator was documented as shown in Figure 6. The figure particularly indicates large amounts of equipment's swing movements where operations were performed at particular spots. However, as the scope of this research was focused on equipment paths rather that equipment activities, only GNSS data related to relocating the equipment were analyzed and only the corresponding path segments were filtered. The soft data (as indicated in Table 1) was utilized to differentiate activities of the equipment.
Figure 6. Excavator's documented path with samples of filtering several manually and automatically identified outliers
The right part of Figure 6 shows how filtering the equipment path was performed with the help of the developed software. Similar to the previous example, at first most evident outliers were removed manually and then less evident outliers were identified by using the parameter-based search. In this case the angle-based threshold for outlier identification was set as 30°. Filtering paths of a dozer: The left part of Figure 7 shows the dozer's moving trajectory within the documented work shift, while the selected section illustrated the equipment's typical moving pattern. These patterns represent the dozers' main activity of pushing soil towards the excavator. Thus, dozers have the capability to change their moving direction from forward to backward similar to trucks, but they travel shorter straight distances. Based on the visualized trajectories and existing soft data (such as presented in Table 1) the specific areas where the dozer traveled in a manner that corresponds to its typical activity (or was alternatively relocating) can be identified and the corresponding way of filtering can be performed. Several samples of manual and 99
automated outlier identifications and filtering are shown within the right part of Figure 7. Similarly to the previous examples, the angle-based search was found useful in identifying outliers.
Figure 7. Trajectory of a dozer and samples of filtering the documented dozer's path segments
4.7.2 Data filtering in asphalt paving operations To examine the applicability of the approach to filter outliers without limitation to a particular technology class, such as inexpensive GPS receivers, the developed software was applied to filter outliers of equipment involved in paving operations whose paths were documented by means of highly precise GNSS sensors. The decision to utilize highly precise sensors was also motivated by typically high demands for accuracy to track paving activities. In particular, localization to track paving operations can be considered as accurate if it has the positioning accuracy of 10 cm in both transversal and longitudinal directions with the possible temporal degradation of the accuracy up to 20 cm [Peyret et al., 2000]. Two essential differences between earthmoving and asphalt paving operations exemplify the different moving patterns of the corresponding equipment: (1) the material is continuously deployed during paving instead of removed during earthmoving; and (2) the continuity of the process is critical, as delays in deploying material that are caused by process interruptions influence the final quality of the road. Because of these characteristics of the asphalt paving operations, equipment movements during asphalt paving are largely differ from those entailed in earthmoving operations. Therefore, this second case validates the generality by illustrating how the 100
proposed approach can be applied for different filtering needs originated from specifics of largely dissimilar construction domains. Similar to earthmoving operations, movements of pavers and rollers highly depend on characteristics and functions of construction equipment, geometry of the construction site, and specifics of the paving process. Therefore, the additional information can support anticipating and analyzing equipment movements. Such information can include descriptions of the construction process and site geometry, as well as depict paver's heading directions at specific locations.
Specifics of equipment movements during asphalt paving projects Pavers: During road construction a paver normally changes its heading based on the site geometry while continue to move forward. At the end of a paved lane, it moves backwards to start another lane. Though the paver should, ideally, advance without stops to sustain the continuity of the paving process, in practice the continuity depends on project geometry, and also can be disturbed by external events or weather conditions. Thus, even if the maximum paver's speed is known (for instance it can be 25 m/min for a particular paver model [Vögele, 2014]), the actual speed during road construction depends on the desired asphalt layer thickness, the continuity of asphalt delivery, and the movements of other equipment. Besides constructing the asphalt layer, the paver sometimes needs to relocate to the beginning of the new paving lane and eventually has to stop and wait for the delivery of the asphalt mixture. In this setting, the information about delays of asphalt trucks, breaks, and other events that negatively influence the continuity of the paver movements can be easily documented as soft data. Therefore, collecting timestamps of the beginning and end of the paving lane, as well as describing on-site events (such as when or where equipment stops) can support experts in filtering outliers in equipment movements. Correspondingly, the choice of using an angle- or speed-based search to identify outliers can be justified by the experts according to their personal knowledge and the provided soft data in relation to the expected movements of the paver in particular moments of time. Overall, the equipment is not expected to make rapid turns and rapidly change speed during paving, but can perform so during relocating to the beginning of the next paving lane. Rollers: The paver is closely followed by rollers. Rollers aim to achieve an optimum density and to provide a smooth surface by compacting the asphalt mat in specific patterns. In general, rollers move back and forth at slow but uniform speed, following a rolling pattern that progresses from the lower to the higher side of the asphalt lane. The roller's driving direction should not be suddenly changed or rapidly reversed, as these actions damage the road surface quality. Additionally, rollers should not stay still over the freshly paved asphalt mat and might avoid overusing stop/start sequences. The maximum speed and the maximum turning angle vary between different equipment 101
models. For example, a specific three-drum roller can have the maximum steering angle of 40 degrees and can reach the speed of 10.2 km/h [Hamm, 2014a], and a tandem roller can perform 25 degree turn and can speed up to 12 km/h [Hamm, 2014b]. Though such information can already be used to filter outliers during equipment movements in relation to both relocating the roller to another lane and compacting operations, additional Though such information can already be used to filter outliers during equipment movements in relation to both relocating the roller to another lane and compacting operations, additional knowledge about the geometry of a particular project can also assist in searching for outliers. Beside compacting and relocating to the beginning of the next paved lane, the roller operator needs to perform other equipment-specific actions. For instance, the equipment eventually needs to travel longer distances to fill its water tank, as water needs to be continuously disposed during compaction to avoid sticking the mixture to the roller's drums. Such information about the equipment behavior can easily be documented by a human observer by means of project notes. In summary, an expert can effectively filter documented paths of the construction equipment by considering the hard and soft data collected during asphalt paving projects in relation to the expectations how the equipment can move on-site. The next section illustrates such filtering based on the proposed information fusion approach.
Description of data collection during the paving project The GNSS sensor readings as well as the project logbook used to validate the applicability of the approach to filter trajectories of asphalt paving equipment were gathered during a road construction project conducted near Alkmaar, a city in the Netherlands (Figure 8). The structured data collection followed the methodology developed within the PQi (Process Quality improvement) framework developed at the University of Twente [Miller, 2010], which has the aim to improve process quality by structured monitoring construction work and making operational behavior explicit.
102
Figure 8. GPS tags mounted on a roller and a paver (left), data collection site (right)
During the tracked 7 hour work shift about 1200 tons of asphalt mixture was paved, which resulted in an 800 m long, 7 m wide, and 7 cm thick asphalt layer.
Applying the developed software to filter outliers in equipment trajectories collected during asphalt paving operations Filtering path of the paver: The filtering of trajectories of equipment involved in the paving project was performed by utilizing the developed software. The user of the software first visually examined the path using the software, and then performed an automated search for outliers (Figure 9).
Figure 9. Overview of the paver's path with examples of identified and linearized sections of the paver's path
103
Filtering path of the roller: The trajectory of a tandem roller was documented during a work shift between 4:56 AM and 11:42 AM. The equipment path highlighted in the lefttop part of Figure 10 corresponds to the time period between 8:05 and 10:11 when the equipment continuously compacted the asphalt layer. Before that period the roller went to the beginning of the paved lane and after that period the roller stood still.
Figure 10. Overview of the roller's path and examples of identified and linearized sections of the roller's path
Several outliers were identified in the documented equipment path. Similar to the paver's path's, both of the manually selected outliers were identified by visually examining the documented path using the interface of the developed software. One of these outliers was located at the beginning of the shift and another one was in the middle of the shift. The second of these outliers had a particularly large value that can be seen as the graph scale of the corresponding illustration extended up to 100 m. In addition to the manually identified outliers, several others were identified automatically. Although the paths of asphalt paving equipment were collected using highly precise GNSS equipment, several significant outliers that had to be eliminated were still found. The proposed approach thus proved to be useful to identify outliers in equipment trajectories documented by highly precise GNSS sensors.
4.8 Discussion and future work The proposed human-centered information fusion approach structures the way of identifying and filtering outliers in GNSS data while accounting for additional soft data characterizing construction processes. In addition, the approach allows incorporating human reasoning about how construction equipment can move during construction 104
operations. The approach is constructed around the observe-orient-decide-act loop that characterizes human decision making and deals with both “hard” sensor readings and “soft” human generated data. Documenting the site and taking notes during the process can provide specifics of the project's context as well as characterize relations between entities and events on-site. Several examples of such descriptions include state of equipment within specific timeframes (if equipment stays idle or performs specific operations), geometry of and objects on the construction site (such as obstacles that could influence equipment movements) and unexpected events (e.g. delays in material delivery on-site). Besides, using soft data can assist in capturing information that can hardly be obtained or require a large number of sophisticated sensors. Soft data can for instance describe locations of materials that were not tagged with positional sensors or markers, identify potential hazards, and characterize weather factors, including visibility, temperature, and rain that can potentially affect the construction activities or sensor readings. In addition, some unquantifiable traits can be described using soft data, including equipment operator's fatigue, recent incidents on-site that can influence worker's behavior, and performed impromptu temporary adjustments to the flow of work. As an additional value, the soft data can depict the intentions of equipment operators how to conduct their activities in a given context. Based on the provided hard and soft data, the expert can identify outliers as visual anomalies in the data visualization or automatically find path segments where equipment moved in an unexpected manner. In this way, soft data can support the expert in making informed decisions whether particular segments of documented equipment paths are outliers. The level of detail of soft data can ideally be just enough to support informed decisions, but according to the nature of human generated records such data granularity can hardly be predicted in advance. As the human-generated soft data aims to provide additional information about the progress of construction work, the amount of the supplied information can differ according to the observer's understanding of the needed data granularity, the person's available time and the needed amount of attention. These conditions particularly apply if multiple pieces of equipment should be tracked. Nevertheless, any amount of supplementary relevant information in addition to the hard data alone can potentially be helpful in identifying outliers. Once this data fusion approach is adopted experience and learning will shed more light on ways to deal with granularity and detail. The conducted tests focused on refining GNSS paths of construction equipment as satellite-based navigation is probably the most common way to document equipment movements. To obtain paths that have different absolute error, both low and high precise equipment was used. Particularly, movements of equipment involved in earthmoving operations were recorded by using low-cost GPS receivers, while high105
end DGPS sensors were employed during the asphalt paving project. The test outcomes indicated that sensor readings obtained by utilizing both classes of equipment paths included outliers that can be filtered according to the proposed approach. Therefore, the authors envision that equipment paths documented by using other technologies, such as laser-based positioning systems, could also be filtered likewise. However, additional tests for such technologies are desired. Although the applicability of the information fusion approach was demonstrated by applying the specially developed software prototype to filter paths of different construction equipment, not all possibilities of utilizing different types of soft data were explored. In particular, the developed software only supports a particular type of soft data (a logbook of the construction project), therefore other potentially useful information sources, such as on-site photos and construction plans, were not presented to the user during tests. In other words, the potential surplus of utilizing specific types of soft data was not the subject of this research. Additionally, the implementation of the approach as a prototype left space for possible improvements in terms of the graphical user interface. The developed interface can clearly be improved based on the tasks of the user and their specifics. For instance, the interface can be extended to encompass additional functionality to effectively handle extra-large datasets or filter paths that potentially contain large amounts of outliers. In addition to the implementation process, several limitations also characterize the conducted tests. In particular, as the data collection was conducted not in experimental settings, but during real construction projects, the collected paths include absolute error, associated with the utilized equipment. Therefore, though the validation of the method was mainly concentrated on filtering outliers introduced by the environment, while aspects related to the in-depth discussion of the accuracy of the documented equipment itself were left aside. Another characterization of the conducted tests is their purpose to demonstrate the potential applicability of the information fusion approach, rather than to provide evidence for advantages of using the proposed solution, for example by comparing it with the fully automated data analysis. This research design decision is related to the authors' consideration that the efficiency of software developed according to the proposed approach is a hardly generalizable characteristic because the demanded amount of human intervention into data processing highly depends on the accuracy of tracking technologies, ambient weather conditions, and the availability of unobstructed transmission signals from navigation satellites. Altogether, the amount of necessary corrections for hard data collected during a specific project can hardly be predicted beforehand, as construction processes are conducted within specific contexts that include particular site layouts as well as objects located on or next to the construction site that can introduce a different amount and type of outliers within collected data. Future research could include further justifications of the approach and evaluations of 106
the desired degree of accuracy of the documented readings. In this way, the research can explore if the proposed information fusion approach can be related to particular data analysis tasks. For example, research could show whether filtering paths obtained by using low-cost equipment can effectively support precise process control and retrospective analysis of near-miss safety accidents. Another particularly promising future research direction is to develop machine learning algorithms that can automatically correct outlier detection settings, reducing the need to involve experts in the process. For instance, if GNSS data are found to be prone to outliers within a specific time or spatial constrains, the software could automatically adjust parameters and concentrate on searching potential outliers within those constrains. Also, additional research could study the benefits of incorporating additional sensor readings by utilizing other technologies, such as video tracking and dead-reckoning system, with respect to considering with the costs of adequately processing multiple input streams. Ultimately, these future research directions could lead to a computer-pull communication pattern when the input from the human could be requested “only when the expected value of their observation exceeded the cost of obtaining it” [Kaupp, 2008]. Future investigations into the nature of expert knowledge can also contribute to automating filtering equipment paths. Such investigations could involve careful analyses of how equipment and human operators can collaboratively perform information fusion tasks by applying frameworks for process analysis, based on distributed cognition [Nilsson et al., 2012]. Ultimately, this trajectory can support further development of information fusion approaches. Another way to improve path filtering can be to adopt structures for soft data based on particular domain-specific ontologies that unambiguously describe both possible events and project background conditions. Finally, better understanding of rules adopted and applied by an expert to filter equipment paths, can contribute to the more automated and even real-time filtering of equipment paths. In this case, a balance can potentially be found between reducing level of details to handle limitations pertinent to data transfer and processing during real-time tracking of construction activities, according to the scheme suggested in [Vasenev et al., 2014], and the robustness of data filtering algorithms. Apparently, a promising approach would be to apply qualitative reasoning methods to assess equipment movements at a construction site. As the major purpose of such methods is to support qualitatively reasoning about physical mechanisms, they provide a natural way to cope with incomplete knowledge [Kuipers, 1989]. As the reasoning about equipment movements can be directly related to spatial qualitative reasoning the following three requirements to qualitative models (as listed in [Escrig & Toledo, 1998]) can guide the process of approaching filtering outliers in equipment paths: representation – to describe relevant aspects of space by making only as many distinctions as necessary, domain theory to express partial knowledge available in the context and inference technologies to relate classes, such as spatial sizes and locations. Based on the potential value to structure and support interactions between 107
human experts and equipment by adopting formalizing principles of qualitative reasoning, future research in this direction can be particularly fruitful.
4.9 Conclusions This paper proposes a human-centered information fusion approach to support the interrelation of soft (human-generated notes) and hard (sensor readings) data with expert reasoning to filter equipment paths. This approach allows effective discrimination of outliers in an interactive way with the aim to increase accuracy of the collected GNSS path trajectories of construction equipment. The proposed approach in particular aspires to avoid cases when automated data filtering can misinterpret some path segments related to equipment-specific movements. To illustrate the approach, the authors developed open-source software to refine documented paths of construction equipment and used it to filter path trajectories of five different construction equipment. The software demonstrated its functionality in supporting its users to easily identify and eliminate outliers based on expectations for how five different types of construction equipment move during asphalt paving and earthmoving projects. The source code of the software together with the compiled version and the description can be freely downloaded from a web-based source code repository [ImportWizard, 2014] and could be applied to refine documented paths of construction equipment before further data processing.
4.10 Acknowledgments The authors would like to thank the ASPARi (“Asphalt Paving, Research & Innovation”) network and the Pioneering organization of the Twente region for their support with this research. Also, the authors would like to acknowledge the National Science Foundation (NSF) under grant CMMI-CIS # 1030472 and the McCarthy Building Companies Inc. USA for the support during data collection. Any opinions, findings, or conclusions included in this paper are those of the authors and do not necessarily reflect the views of ASPARi, NSF, and McCarthy.
4.11 References Bath, W. G., C. M. Boswell, S. Sommerer and I. J. Wang (2005). "Detection systems information fusion." Johns Hopkins Apl. Tech. Digest 26(4): 306-314. Bijleveld, F. R., A. Vasenev, T. Hartmann (2011). "Smoothing GPS data of rollers to visualize asphalt paving operations." in: Proceedings of European Group for Intelligent 108
computing in Engineering (EG-ICE) workshop in June 2011, University of Twente, The Netherlands: 1-8. Blasch, E. P. and S. Plano (2002). "JDL level 5 fusion model user refinement issues and applications in group tracking." in: Signal Processing, Sensor Fusion, and Target Recognition Xi, vol. 4729: 270-279. Blasch, E. (2006). "Sensor, user, mission (sum) resource management and their interaction with level 2/3 fusion." in: 2006 9th International Conference on Information Fusion: 1-4. Blasch, E. P. and S. Plano (2003). "Level 5: user refinement to aid the fusion process." in: Proc. SPIE, vol. 5099: 288-297. Bossé, E., J. Roy and S. Wark (2007). "Concepts, Models, and Tools for Information Fusion." Artech House Intelligence and Information Operations Library, Artech House, Inc. Bryant, D. (2003). "Critique, explore, compare, and adapt (ceca): a new model for command decision making, Report DRDC-TORONTO-TR-2003-105." Defense R&D Canada – Toronto, Toronto ONT (CAN), July 2003. Caron, F., E. Duflos, D. Pomorski and P. Vanheeghe (2006). "GPS/IMU data fusion using multisensor kalman filtering: Introduction of contextual aspects." Information Fusion 7(2): 221-230. Cheng, T., M. Venugopal, J. Teizer and P. Vela (2011). "Performance evaluation of ultra wideband technology for construction resource location tracking in harsh environments" Automation in Construction 20(8): 1173-1184. Cheng, T., U. Mantripragada, J. Teizer and P. Vela (2012). "Automated trajectory and path planning analysis based on ultra wideband data." J. Comput. Civil Eng. 26(2): 151160. Cheng, T. and J. Teizer (2013). "Real-time resource location data collection and visualization technology for construction safety and activity monitoring applications." Automation in Construction 34(0): 3-15. Cheng, T., J. Teizer, G. C. Migliaccio and U. C. Gatti (2013). "Automated task-level activity analysis through fusion of real time location sensors and worker’s thoracic posture data." Automation in Construction 29: 24-39. Cho, Y.-K., C. T. Haas, K. Liapi and S. Sreenivasan (2002). "A framework for rapid local area modeling for construction automation." Automation in Construction 11(6): 629-641.
109
Escrig, T. and F. Toledo (1998). "Qualitative Spatial Reasoning: Theory and Practice: Application to Robot Navigation." Frontiers in Artificial Intelligence and Applications, IOS Press. Flintco (2014). "Construction safety requirements." http://www.flintco.com/uploads/cms_uploads/2013/12/safety-manual-subcontractor-re1387396387.pdf, last retrieved April 2014. Gentil, S. and J. Montmain (2004). "Hierarchical representation of complex systems for supporting human decision making." Advanced Engineering Informatics 18(3): 143-159. Haas, C. T. (2006). "A model for data fusion in civil engineering." in: I. Smith (Ed.), Intelligent Computing in Engineering and Architecture, Lecture Notes in Computer Science, vol. 4200, Springer, Berlin Heidelberg: 315-319. Hall, D. and J. Jordan (2010). "Human-Centered Information Fusion." Artech House Electronic Warfare Library, Artech House, Inc. Hamm (2014a). "Hamm HW 90B/10 static three-wheel roller 10t." http://www.hamm.eu/en/produkte/statische-walzen/serie-hw/hw-90b10.227.php#!tab=technischedaten, last retrieved April 2014. Hamm (2014b). "Hamm DV 70 VV pivot steered tandem roller, double vibration roller." http://www.hamm.eu/en/produkte/tandemwalzen/serie-dv/dv-70vv.176.php#!tab=technische-daten, last retrieved April 2014. Herrera, E. P., H. Kaufmann, J. Secue, R. Quirs and G. Fabregat (2013). "Improving data fusion in personal positioning systems for outdoor environments." Information Fusion 14(1): 45-56. Hitachi (2014). "Hitachi EH-1100-3 specifications." http://hitachiconstruction.com/assets/files/ products/Mining/EH1100-3/EH11003_specs.pdf, last retrieved April 2014. ImportWizard (2014). "Data Import Wizard project." http://asphaltopen.svn.sourceforge.net, last retrieved April 2014. Imran, M., Y. Hassan and D. Patterson (2006). "GPS-GIS-based procedure for tracking vehicle path on horizontal alignments.” Comput.-Aid. Civil Infrastruct. Eng. 21(5): 383394. John Deere (2014). "John Deere 750c." http://www.deere.com/en_US/docs/construction/non_current_products/crawler_dozers/ DKA750CII_0010.pdf, last retrieved April 2014. Kaupp, T. (2008). "Probabilistic human-robot information fusion." University of Sydney.
110
Khaleghi, B. and F. Karray (2012). "Human-centered multi-target tracking: a random set theoretic approach." in: 2012 IEEE 13th International Conference on Information Reuse and Integration (IRI): 193-200. Kim, Y.-S. and C. T. Haas (2000). "A model for automation of infrastructure maintenance using representational forms." Automation in Construction 10(1): 57-68. Komatsu (2014). "Komatsu PC400 LC." http://www.komatsu.com/ce/products/pdfs/PC400_400LC-7_.pdf, last retrieved April 2014. Kuipers, B. (1989). "Qualitative reasoning: modeling and simulation with incomplete knowledge." Automatica 25(4): 571-585. Lambert, D. (2003). "Grand challenges of information fusion." in: Proceedings of the Sixth International Conference of Information Fusion, vol. 1: 213-220. Miller, S. R. (2010). "Hot mix asphalt construction: towards a more professional approach." Ph.D. Dissertation, University of Twente. Miller S. R., T. Hartmann and A. G. Dorée (2011). "Measuring and visualizing hot mix asphalt concrete paving operations." Automation in Construction: 474-481. Nilsson, M., J. van Laere, T. Susi and T. Ziemke (2012). "Information fusion in practice: a distributed cognition perspective on the active role of users." Information Fusion 13(1): 60-78. Nunnally, S. (1998). "Construction Methods and Management." Prentice Hall. Peyret, F., J. Jurasz, A. Carrel, E. Zekri and B. Gorham (2000). "The computer integrated road construction project." Automation in Construction 9(5–6): 447-461. Pradhananga, N. and J. Teizer (2013). "Automatic spatio-temporal analysis of construction site equipment operations using GPS data." Automation in Construction 29: 107-122. Pravia, M, O. Babko-Malaya, M. Schneider, J. White, C.-Y. Chong and A. Willsky (2009). "Lessons learned in the creation of a data set for hard/soft information fusion." in: 12th International Conference on Information Fusion (FUSION ’09): 2114-2121. Raol, J. (2009). "Multi-Sensor Data Fusion with MATLAB", Taylor & Francis. Rezaei, S. N. and R. Sengupta (2005). "Kalman filter based integration of DGPS and vehicle sensors for localization." in: 2005 IEEE International Conference on Mechatronics and Automation, vol. 1: 455-460. Razavi, S. N. and C. T. Haas (2010). "Multisensor data fusion for on-site materials tracking in construction." Automation in Construction 19(8): 1037-1046.
111
Shahandashti, S., S. N. Razavi, L. Soibelman, M. Berges, C. Caldas, I. Brilakis, J. Teizer, P. Vela, C. T. Haas, J. Garrett, B. Akinci and Z. Zhu (2011). "Data-fusion approaches and applications for construction engineering." J. Construct. Eng. Manage. 137(10): 863-869. Song, B. and Z. Jiang (2013). "Proactive search enabled context-sensitive knowledge supply situated in computer-aided engineering." Advanced Engineering Informatics 27(1): 66-75. Teizer, J., D. Lao and M. Sofer (2007). "Rapid automated monitoring of construction site activities using ultra-wideband." in: Proceedings of the 24th International Symposium on Automation and Robotics in Construction, Kochi, Kerala, India: 19-21. Teizer, J., U. Mantripragada and M. Venugopal (2008). "Analyzing the travel patterns of construction workers." in: 25th International Symposium on Automation and Robotics in Construction (ISARC-2008): 391-396. Vasenev, A., T. Hartmann and A. G. Dorée (2014). "A distributed data collection and management framework for tracking construction operations." Advanced Engineering Informatics 28(2): 127-137. Vögele (2014). "Vögele super 1900-3." http://media.voegele.info/media/03_voegele/produkte/broschueren/02_raupenfertiger/la yout_2013/super_1900_3/PB_SUPER_1900-3_EN.pdf, last retrieved April 2014.
112
Chapter 5. Organizing interactive visualization environments to represent tracked and experiment with alternative equipment trajectories in the documented context of real construction projects4 In the construction domain Visualization Environments (VEs) are commonly used to study intricate interrelations between construction equipment trajectories and the context where they take place. Considering this context is essential for adequately accessing construction processes, because the context characterizes the situation of the equipment and heavily influences decisions equipment operators make. To date, existing VEs that deal with construction equipment trajectories are either oriented to review the conducted trajectories or to experiment with alternatives. Each of these VE classes possesses specific characteristics. In the first case, specialized environments represent conducted equipment trajectories and their actual context. Both these aspects are reconstructed from navigation sensor readings and other data acquired during real construction processes. Such VEs enable reviewing documented construction projects, but lack the possibility to investigate alternatives to them. In the second case, VEs enable experimenting with alternative equipment trajectories within a priori defined contexts. Such VEs are less oriented to review real operations and demand additional modeling effort to reconstruct specific projects. This shortcoming limits possibilities to utilize this type of VE for reviewing real construction projects. Combining both functionalities within a singular VE will enable obtaining benefits pertinent to each of the visualization environments classes. This study proposes a method to develop specialized interactive simulation visualization environments for both review and experimentation with construction equipment trajectories. The context of these trajectories is reconstructed based on data from an actual construction project. This enables the utilization of VEs shortly after the completion of the project and opens up the opportunity for experimentation with alternative equipment trajectories. The method comprises two steps: application of a “context-actions-trajectory-impact” framework to structure interrelations between equipment trajectories and their context; and operationalization of an organization scheme to devise a specialized environment based on the framework’s concepts. To evaluate the applicability of the proposed 4
This chapter has been submitted to an international refereed journal as an academic paper. Coauthors of the corresponding paper are S. R. Miller, T. Hartmann, and A. G. Dorée
113
method we operationalized it for the case of the asphalt compaction process. We developed a specialized visualization environment in consultation with asphalt paving professionals. Two test sessions with a paving specialist and two professional roller operators were conducted with the developed VE. The results from the sessions show that the comparison of demonstrated alternative trajectories and the original ones provides meaningful insights.
5.1 Introduction Nowadays, employing construction equipment is critical in literally all residential, commercial, industrial, or highway constructions projects [Gransberg et al., 2006]. With the increasing industrialization of construction work, the role of on-site equipment and machinery is vital in achieving productivity and efficiency [Waris et al, 2014]. This dependency on construction equipment grows with the size and complexity of construction projects. Given the vital role of the equipment during on-site construction, analyzing previously conducted construction projects can provide a number of valuable insights about the process. Among other diverse benefits, such analysis can assist in identifying equipment activity- and safety-related information [Pradhananga & Teizer, 2013], work zone safety aspects [Teizer et al, 2008], and near-miss events (as noted in [Vasenev et al, 2014b]). In addition, the thorough understanding of how equipment might move in specific project conditions can contribute to planning future construction activities (see for instance [Huang et al., 2007; Li et al., 2012a]). To meaningfully study equipment movements the documented equipment paths – in other words, equipment trajectories – need to be considered in connection with the context where the trajectories take place. Within this research we see context as a multiplicity of different factors that characterize the situation of an equipment and influence decisions of the equipment operator. The examples of particular context factors are ambient weather conditions or locations of different equipment at the construction site. By relating equipment trajectories to context factors the trajectories can be carefully studied and assessed. However, because the context of construction is typically highly complex and changes over time, this task is not straightforward. There is a clear need for specialized solutions to facilitate studying construction equipment trajectories in context. To this end, specialized 3D visualization environments (VEs) – visual-based computer interfaces from which various tasks can be performed – are particularly suitable. In particular, capabilities of VEs to “provide insights and understanding and reduce complexity of the phenomena under consideration” [Knight, 1998] are of use for this task. Given these benefits, a number of specialized visualization environments were 114
developed for the needs of the construction domain (e.g. [Turkiyyah, 2007; Vasenev et al., 2012b; Teizer et al., 2013; Fang et al. 2014]). In principle, VEs concerned with representing construction equipment trajectories in context can be classified as either oriented to review conducted equipment trajectories in context or to experiment with alternative trajectories for specific contexts. Several environments allow reviewing real construction processes both in real-time and in postprocessing modes [Miller et al., 2011; Vasenev et al., 2012b; Teizer et al., 2013]. Other VEs (e.g. [Turkiyyah, 2007; Fang et al. 2014]) support experimenting with some processes within a simulated context. Each of these two VE classes possesses distinct characteristics. The first VE class hones in on reviewing conducted equipment trajectories. These VEs deal with sensor readings characterizing equipment trajectories and specific context factors, documented during the real construction processes. Navigation sensors, such as GPS receivers, allow to track equipment movements, while temperature sensors, weather stations, and other sensing devices can provide data regarding the context of these movements. The documented sensor readings are filtered, aligned, and processed by specialized data processing procedures before being represented within a VE. The data processing thus can automatically reconstruct specific context factors, such as ambient weather conditions and delays in the transportation of construction materials. The shortcoming of such environments is its inability to experiment with alternatives to the construction process. In contrast, the VEs of the second class can assist in experimenting with alternatives trajectories for particular contexts, but demand dedicated efforts to model the context of a specific project. Because of the possibility to explore different alternatives for fixed project settings, this class of VEs can be particularly suitable for education purposes. Combining functionalities of both classes would resolve the limitations specific for each of the VE class. Such combination could enable VE users to both (1) review actual equipment trajectories shortly after the completion of the construction project and to (2) experiment with alternative trajectories within the context of the conducted project. When the context of equipment movements is to be reconstructed automatically, the time lag between acquiring and representing sensor readings significantly reduces. However, despite the potential advantages, the topic of developing such VEs did not receive significant attention. According to the authors’ best knowledge, no suggestion on how to organize such VEs has been proposed. Two challenges seem to have hampered the development of environments with the combined functionalities for the needs of the construction domain. Firstly, because each construction process is unique, it is not trivial to provide a generic approach to disentangle intricate interrelations between the context of equipment trajectories, equipment trajectories themselves, and actions of equipment operators, which in a way link the context and the trajectories. Without structuring these interrelations the possibility to develop such VEs is hindered. Secondly, an adequate organization 115
scheme of a VE consisting of components to acquire, process, and represent both real and simulated data has not been suggested. Since these two challenges are closely interrelated, both should be dealt with simultaneously in the development of these VEs. This study proposes how to develop specialized interactive simulation visualization environments. Two elements are presented: (1) a framework to assist structuring interrelations between equipment trajectories and their context; and (2) an organization scheme, which advises how a specialized environment can be arranged according to the framework’s concepts. The application of these elements for a particular construction process is expected to result in the structure for a VE with the envisioned functionality. As the first step of the method, the framework suggests disentangling intricate interrelations between context, operator’s actions, and the outcome of these actions. Within the second step, the framework’s concepts and their interrelations guide the organization of a specialized visualization environment. Overall, the method can support development of specialized VEs suitable for construction processes in general, without specifications for a particular construction process, e.g. earthmoving or soil compaction. To illustrate the proposed method we operationalized it for the case of asphalt compaction process. The operationalized method guided the development of a corresponding VE. The developed environment was tested during two sessions. The aim was to consider if the developed VE can be used to review actual roller trajectories as well as support experimentation with alternative trajectories within the context reconstructed from the documented sensor readings To provide the background of this research, the next section briefly reviews visualization environments developed for the needs of the construction domain. As mentioned, these environments either support reviewing conducted construction processes or assist in experimenting with alternatives. The paper continues with the description of the environments available for the case of asphalt compaction to illustrate this dichotomy. Afterwards, a method to organize VEs with the combined functionalities is suggested. Then, the paper describes how this method can be applied for the case of asphalt compaction. Finally, this paper portrays the details of the VE developed according to the operationalized methods, describes two test sessions conducted with the involvement of practitioners, and finishes with discussions and conclusions.
116
5.2 Background 5.2.1 Short overview of visualization environments within the construction domain Visualizing construction projects is often considered beneficial to study construction operations. As a result, development and utilization of specialized VEs is one of the promising research directions in the construction domain [Balaguer & Abderrahim, 2008]. With regard to representing conducted processes, three-dimensional visualizations add an element of familiarity and realism into systems [Knight 1998], helpful to better understand the documented projects. Similarly, visualizing simulations can substantially help in making optimal decisions where traditional methods prove ineffective or are unfeasible [Kamat & Martinez, 2001]. Multiple specialized environments were suggested to support diverse constructionrelated tasks, including design and planning, simulations, and real-time visualizations. Some recent examples include VEs for conducting collaborative design in a virtual world [Gu & Tsai, 2010], performing design and simulation analysis functions to support optimum road design [Kang et al., 2010], and considering construction safety needs [Lin et al., 2011]. Other authors suggested to plan construction site activities [Retik & Shapira, 1999], integrate health and safety issues in the construction project planning process [Chavada & Dawood, 2010], or VEs together with simulations to help planners to identify an optimal construction plan [Li et al., 2012b]. Next to those examples, interactive visualizations were also suggested to assist visual impact assessment of housing developments [Stojanovic et al., 2013] and demonstrate the impact of highway construction on the public [Zanen et al., 2013]. With multiple environments developed to address diverse needs of the construction domain, a number of environments focus on construction processes. In particular, several VEs concentrate on equipment trajectories in context – the subject of interest of this research. These environments can be seen as related to one of the two classes concerned with either representing conducted construction processes or simulating alternatives for the specific processes. With regard to the first class, several visualization environments were suggested either to represent ongoing or already completed construction processes to VE users. For instance, specialized real-time visualizations can represent real-time data from positioning sensors as suggested in [Cheng & Teizer, 2013]. Dynamic visualizations of ongoing engineering can assist in remote monitoring and planning of construction operations [Akhavian & Behzadan, 2012]. Also, within the same class, other VEs allow to demonstrate conducted projects to construction professionals during education sessions organized after the completion of the project. The corresponding examples 117
include a VE to review steel-erection tasks performed in an indoor training center [Teizer et al., 2013] or an environment to examine asphalt compaction activities [Miller et al., 2011]. Another class includes VEs that support simulating operators’ actions within specific contexts. Such specialized VEs are particularly useful in training specialists within the construction domain. Several reasons contribute to this: construction processes are often unique, context-dependent, and can be too expensive or even dangerous to reproduce. This class of environments encompasses both industrial solutions and academic suggestions. To date, several large producers of construction equipment, such as John Deere, Caterpillar, and Komatsu developed specialized environments to train operators of construction equipment. A wide range of specialized environments to educate equipment operators is available, varying from affordable simulators (e.g. Simlog [Simlog website]) to highly sophisticated systems designed by world leaders in modeling, simulation, and visualization (such as CAE Mining solution [CAE Mining website]). At the same time, academic researchers also suggested and developed education-oriented simulators. The examples include VEs to train students and workers involved in asphalt compaction [Turkiyyah, 2007] or concrete spraying [Velez et al.2013] processes. In addition, some of the developed suggestions advise to couple post-process visualization environments with discrete event simulators. Examples of such simulations include VEs to assess CO2 impacts related to the equipment movements during road construction [Gonzales & Echaveguren, 2012], or to model equipment breakdown during earthmoving operations [Rekapalli & Martinez, 2009]. Broadly, environments with simulation abilities can be referred to as ‘games’. Such VE gaming technologies particularly highlights the possibility to visualize data in an understandable manner and interact with the user. In this regard, the dichotomy can be seen as VEs to reconstruct real processes and VEs for gaming (to experiment with alternative trajectories). Altogether, the listed environments provide diverse possibilities for their utilization. The environments typically either support tracking (or reviewing) conducted construction processes or simulating processes within a priori contexts. Furthermore, existing environments possess specific characteristics. In the first case, VEs allow reviewing documented construction projects, but lack the possibility to investigate alternatives to them. Meanwhile, other environments provide its users with possibilities to simulate specific construction processes by trying out alternatives relevant for a particular context. However, such VEs are less oriented to review real operations and would demand additional modeling effort to reconstruct specific projects. This shortcoming limits possibilities to utilize VEs for reviewing real construction projects shortly after the completion of the construction project, while allowing for their use during education sessions. The next subsection illustrates this outlined dichotomy of VE functionalities on the case of the asphalt compaction process. This process is relevant for the 118
illustration purposes, as it strongly depends on equipment trajectories conducted within a changing context.
5.2.2 Illustrating the dichotomy in VE functionalities for the case of the asphalt compaction process The asphalt compaction process heavily depends on trajectories of pavers and rollers involved. During asphalt paving, a paver deploys a mixture along its moving path. Then, rollers compact the mixture to a desired degree by continuously moving over it. While the trajectories of pavers to a large extent shape the context of compaction, it is the buildup of roller trajectories that define the compaction process in essence. Several VEs were suggested to represent the asphalt compaction process, mainly within the research trajectory of the ASPARi (Asphalt Paving Research and Innovation) network. In line with the dichotomy mentioned above, these VEs either support reviewing real roller trajectories or simulating alternative trajectories for specific cases. Examples of VEs to review the equipment trajectories in respect to their context include AsphaltOpen [Miller et al., 2011] and ProPave [Miller, 2010] solutions. Other VEs do not provide such functionality, but enable simulations of the compaction process. SIMPAVE solutions visualizes the paving process for simulation and education purposes [Turkiyyah, 2007], while another specialized VE was proposed to explicate tacit knowledge of roller operators [Vasenev et al., 2013] through simulating equipment movements. Though the available environments are useful within their outlined functionality, their specific purposes make it difficult to benefit from advantages offered by the other classes. Combining the two outlined functionalities might provide additional benefits and open up new possibilities for utilizing advanced visualization environments. Such environments can assist training equipment operators and provide individualized feedbacks to the project participants shortly after completion of asphalt paving projects. Both explicating operational behavior, as well as training students and workers in the road construction industry can benefit from such VEs [Miller, 2010, p.244; Bijleveld & Dorée, 2014, p.10]. It is desirable, that the corresponding environment could represent actual monitored projects and support discussions about the operational strategies [Bijleveld & Dorée, 2014, p.14]. In summary, existing asphalt compaction-related VEs either allow to review actual monitored projects or provide possibilities to simulate abstract construction projects. Though uniting the functionalities of these environments within a VE is desirable, suggestions on how to organize such VEs were not yet developed. The paper aims to address this gap by proposing a method to organize VEs of this kind. The suggested method is presented next. 119
5.3 A method to organize interactive visualization environments to review and simulate construction equipment trajectories This section suggests a method to organize visualization environments capable of both reviewing documented equipment trajectories in context and simulating alternative trajectories by the users. VEs developed according to this method allow the users to not only review previously tracked operations, but also take control over a piece of construction equipment.
5.3.1 Framework to structure interconnections between context, actions of an operator, trajectory of the construction equipment, and the impact of operations Equipment trajectories and their context are heavily intertwined. During their work, equipment operators continuously act within the changing context and, in turn, contribute to it by changing locations of their equipment. These intricate real-world interrelations between the context, operators’ actions, and equipment trajectories need to be structured prior to the development of specialized interactive simulation VEs. This subsection suggests a framework to approach the interrelations between these concepts. The framework to approach disentangling equipment trajectories from their context can be described as follows. During construction processes, equipment operators make decisions how to act within the context. The context continuously changes and is different at every moment of time. The operators’ decisions are embodied as actions aimed towards a specific goal. Such a goal can be to obtain a uniformly compacted soil layer or to complete a cut-and-fill task. By acting, equipment operators relocate the equipment they control, thus changing the context of operations. Regardless of being relocated or not, the equipment can also perform some work that contributes to the context at the next moment of time. The interrelation of these concepts form the “context-actions-trajectory-impact” framework demonstrated in Figure 1.
120
Figure 1. Interrelations between the context of construction process, actions of an equipment operator, and the outcome of the operator’s actions
Specifically, the suggested concepts of context, operators’ actions, trajectories, and impacts can be outlined as follows: -
Context can be considered as all factors that directly or indirectly influence specific actions [Riss, 2005, p.59]. In practice, characterizing all factors is nearly impossible. Therefore, within the framework we adopt the operational definition of context as provided by Dey [2001]: “Context is information that can be used to characterize the situation of an entity”. We suggest to quantify the context, thus considering the context as formed by a list of context factors. The factors highlight specific measurable aspects of interest of the construction process under consideration. A particular list of factors depends on the type of construction process: the list of context factors would be different in the case of asphalt compaction or earthmoving processes. The context factors may or may not depend on the actions of equipment operators. For example, equipment operators can directly influence the context by changing locations of their equipment, but have no control over the ambient weather conditions and locations of other workers on-site. Given these considerations, the context can be described as a multiplicity of different factors that characterize the situation of an equipment and influence decisions of the equipment operator.
-
Actions. To approach the goal of the construction process, equipment operators act by continuously controlling their equipment within the changing context. The actions are based on the operators’ decisions guided by considerations how to achieve a particular goal. The conducted operators’ 121
actions are manifested as equipment trajectories and the work conducted by the equipment. -
Trajectory. Due to the context and the goal of the process, equipment operators might need to move the equipment from one location to another. The corresponding operator’s actions lead to changes of the equipment’s moving direction and its speed. If tracked by navigation sensors, equipment movements can be documented as equipment trajectories. Similarly, in case of experimenting with alternative trajectories within a VE the trajectories can be documented as changes of locations of the virtual equipment over time.
-
Impact. In addition to the changing location of the equipment, operators also conduct some work according to the specific purpose of the construction equipment. For instance, dozers (or excavators) can move construction materials, while rollers can compact it. This framework sees the corresponding work as the impact that a particular piece of equipment produces. In general, the impact is linked to the location of the equipment and depends on the actions of equipment operator. For instance, dozer operators can change the location of their equipment without transporting any soil. On the other hand, in addition to moving their equipment, roller operators can compact construction materials by applying specialized working modes, such as drum vibrations. As equipment trajectories and impacts are closely related, the described framework groups them within a single concept – the outcome of equipment operators’ actions.
With the outlined concepts and their interrelations, the ”context-actions-trajectoryimpact” framework enables separating equipment trajectories from their context. In other words, the framework suggests how to structure causal links between different context factors, operators’ actions, and their outcomes (equipment trajectories and the impacts the equipment make). Such structuring is important to develop integrated VEs as it provides an intermediate connection between the complexity of the real-world operations and the possibilities to simulate complex processes in visualization environments. Structured interactions between equipment trajectories and the context permit the development of visualization environments to study equipment trajectories in context. The next subsection builds on the outlined concepts and suggests how to organize VEs that allow both reviewing conducted trajectories in context and demonstrating (or trying out) alternative trajectories for the same context.
122
5.3.2 An overall scheme for an interactive simulation and representation visualization environment An overall organization scheme of a VE that incorporates the outlined concepts is shown in Figure 2. This scheme aligns data pre-processing and representation. The scheme resembles the format of IDEF0 (Integration Definition for Function Modeling) diagrams: inputs for specific boxes are associated with the left side of each box; outputs are on the right; mechanisms to enable functions at the bottom; and controls at the top of the boxes.
Figure 2. Organization of an interaction and simulation environment aligned with data pre-processing stage
The scheme organizes data processing and representation elements as follows: earlier acquired sensor readings characterizing real equipment trajectories and their context form the input for pre-processing. With data collection and processing aligned to specific tasks, as suggested for instance in [Vasenev et al., 2014a], the data is to be sampled in a way suitable for future processing. Steps 1 and 2 (Figure 2) deal with data pre-processing. Pre-processing is needed to filter outliers in the documented data and prepare it for the future use. This step can involve a human operator in case human reasoning would be desired for the task. Alternatively, to reduce the lag between acquiring sensor readings and representing documented processes in the VE, the step can be performed in an automated manner. In this case, the environment can be utilized during review sessions conducted shortly after the completion of the construction project. 123
After pre-processing, the data characterizing trajectories and the context should be aligned. A geo-referenced structure, such as a regular grid or a triangular mesh (see chapter 3 of this thesis) is needed to enable unambiguous referencing of the context, trajectories, and impacts. Geo-referencing (or in other words, mapping) impacts characterizing the real project should also allow for mapping alternative impacts. Referenced in a similar manner, they enable cross-comparisons of real and alternative trajectories. Step 3 creates the common context structure. The context structure (for example, a regular grid) is then utilized for reconstructing the context of trajectories (step 4) and impacts of the construction process (step 5). These steps are logically separated because the context can exist without equipment conducting any work within the context. Specifics of reconstructing the context and impacts depend on what context factors are considered relevant for the VE and what data are to be acquired. The corresponding calculations can be derived from the interrelations between the framework’s concepts (operators’ actions, trajectories, and impacts) related to the particular process under consideration. After the completion of the pre-processing stage, the trajectories, context, calculated impacts, and the constructed context structure form the input dataset for the visualization environment. Provided with the dataset, the environment allows its users to both review the documented trajectories in context and to demonstrate (or try out) alternative equipment trajectories for the same context. In the first scenario, VE users could review and explore the documented process in detail. This exploration can be conducted, for instance, in a 4D manner. The VE user could change the point of view within the 3D visualization and also “fast-forward” the process represented in the VE. In the second scenario, a VE user can take control over a particular piece of equipment and simulate an alternative trajectory for the documented context factors. To support this, the VE would track operator’s actions and compute equipment trajectories and alternative impacts. These computations utilize the pre-calculated context structure as a data referencing mechanism. Then, the VE demonstrates the alternative impact to its users. Continuously receiving feedback on the outcome of their actions, the users can further proceed with simulating alternative trajectories. Altogether, the suggested VE organization scheme incorporates the concepts identified using the “context-actions-trajectory-impact” framework. The scheme specifically suggests how the interrelations between different context factors, operators’ actions, and equipment trajectories, and impacts can be organized within specialized VEs. These specialized environments provide dual functionality: they allow reviewing equipment trajectories in context and demonstrating alternative trajectories. The first functionality is enabled by the pre-processing phase, when the acquired real trajectories and context are computed. The second functionality is mainly supported by computations performed within the VE. Specifically, by acquiring the input from the VE 124
users, the environment calculates trajectories and impacts. These calculations are based on the context structure formed according to the real-project data. The next sections illustrate the applicability of the proposed method by applying it for the case of the asphalt compaction process.
5.4 Procedure adopted to illustrate the suggested method To illustrate how a visualization environment for reviewing documented and simulating alternative equipment trajectories in context can be developed using the suggested method, we operationalized the method for the case of the asphalt compaction process. This process is particularly suitable to illustrate the method, as asphalt compaction heavily depends on timely decisions of roller operators instantiated as roller trajectories. These decisions in turn depend on context, which is formed by multiple context factors. To illustrate the method we adopted the following four-step routine: 1.
The interrelations between the context and equipment trajectories were characterized for the case of asphalt compaction. By continuously consulting with asphalt paving professionals, we applied the “context-actions-trajectoryimpact” framework to structure the interrelations.
2.
We operationalized the proposed organization scheme based on the outcome of the step.
3.
The first author of this paper developed a visualization environment according to the operationalized scheme. The development followed the iterative procedure proposed by [Hartmann et al., 2009]. In agreement with the procedure, several meetings with paving specialists took place to discuss the implementation in progress. During these sessions the experts provided their feedbacks on data processing and representation aspects of the environment.
4.
The functionality of the developed VE was tested with the help of practitioners, including two roller operators, who were not consulted during the VE development. Firstly, the practitioners reviewed the documented asphalt roller trajectories, collected during real asphalt compaction projects. Then, the VE users demonstrated alternative roller trajectories within the documented context factors. We compared the real and alternative trajectories to identify if they stay commensurable.
The next section is structured according to this four-step procedure and elaborates the conducted steps.
125
5.5 Applying the proposed method for the case of asphalt compaction This section describes details how the suggested method was applied for the case of asphalt compaction. Firstly, the operationalized “context-actions-trajectory-outcome” framework is presented. Then, a VE organization scheme derived from the operationalized framework is described. The section concludes with the VE implementation details and the description of two tests conducted with the VE. For the tests asphalt-paving professionals were invited to experiment with alternative trajectories for the earlier documented context.
5.5.1 “Context-actions-trajectory-outcome” framework operationalized for the case of asphalt compaction To illustrate the applicability of the proposed method, we operationalized the suggested framework as shown in Figure 3.
Figure 3. The operationalization of the suggested framework for the case of asphalt compaction process.
Several design decisions were made during operationalizing the proposed framework for the case of asphalt compaction. These decisions aimed to keep the level of complexity of the illustrative VE at a manageable level, while providing the intended functionality. Firstly, it was decided to limit the context to be demonstrated within the VE to four context factors. These factors were selected based on discussions with asphalt 126
paving specialists, reviews of relevant academic manuscripts (e.g. [Miller, 2010], [Huerne, 2004]), professional publications (such as the Asphalt Handbook [Asphalt Institute, 1989], and educational materials for roller operators). Two of those factors depend (at least partially) on the operator’s actions: equipment locations and the compaction effort delivered by rollers to the asphalted layers. Other two factors are independent from actions of roller operators, namely the geometry of the working zone and the temperature of the asphalt layer. We paid special attention to the asphalt temperature as a context factor because it defines the compatibility of the mixture, thus strongly influences the compaction process. Specifically, due to changes in viscosity of the binder in the asphalt mixture, the compaction should be performed while the temperature of the mixture is within certain temperature limits [Wise & Lorio, 2004; Commuri & Zaman, 2008; Commuri & Zaman, 2008; Alexander & Hughes 1989]. Asphalt mixture designers can specify such temperature ranges suitable for compacting particular mixtures [Sullivan & De Bondt, 2009]. With the temperature of the layer continuously decreasing after the deployment [Bossemeyer, 1966], roller operators should consider temperature in relation to the suggested temperature limits. After identifying the four context factors of interest, we considered the interrelations between them and the equipment trajectories in this context. Within the research, the compaction impact is calculated directly based on roller trajectories. This approach is adequate if roller operators on-site do not employ specific working modes, such as drum vibrations. This consideration is common within several specialized industrial solutions. Specifically, several solutions exist that calculate the compaction impact solely based on trajectories and then represent the conducted compaction as amounts of roller passes. To incorporate the same data processing logic, we omitted the direct connection between the actions and the impact proposed within the framework. In this case, the actions of roller operators result in equipment trajectories, which define the compaction impact. Thus, the compaction impact that each roller makes is calculated by counting how many times the roller passed over a particular spot. By limiting amounts of and interrelations between the concepts, the operationalized framework provides the level of complexity suitable for the illustrative purposes of this section. The operationalized framework thus makes it possible to operationalize the proposed organization scheme for the case of asphalt compaction.
5.5.2 Organization scheme operationalized for the case of asphalt compaction Based on the outlined above interrelations of the framework’s concepts, an interactive simulation and representation VE for the case of the asphalt compaction can be organized as illustrated in Figure 4. 127
128
Figure 4. An operationalized VE organization scheme for the case of asphalt compaction
Within the operationalized organization scheme we utilized several data sources in order to reconstruct the four context factors of the documented construction project. Specifically, the documented trajectories of pavers and rollers were utilized to reconstruct two context factors: equipment locations and the conducted compaction effort. To reproduce two other context factors (the geometry of the working zone and the temperatures of the paved layer at every moment of time), we employ additional sensors. Temperature sensors located on the paver document the temperature of the deployed asphalt mixture, while in-asphalt sensors record the cooling of the layer. As we view roller trajectories as manifestations of operators’ actions, no additional data related to tracking operators’ action is collected. The data pre-processing stage is organized as follows. Firstly, the outliers in the documented trajectories and context data are filtered out (steps 1 and 2 in Figure 4). Then, the context of the compaction is recreated as a geo-referenced working area where the rollers operate. Since the compaction effort delivered to the paved asphalt layer is the subject of interest, we reconstruct the geometry of the paved layer that represents the rollers’ working area. This geometry can be identified by combining the paver’s trajectory with the known geometrical disposition of temperature sensors situated on the paver. We obtain the geo-referenced model of the paved layer by combining these data and applying the assumption that the initial layer temperature is higher than a threshold [Vasenev et al., 2012a]. This obtained geometrical structure is useful for mapping the temperature data and amounts of roller passes at specific locations. An illustration of a context structure with aligned context data is indicated in Figure 5.
Figure 5. Adopted context structure for mapping the temperature of the constructed layer and conducted compaction efforts
Once the mesh representing the asphalt layer geometry is calculated in step 3, both temperature data and the amounts of roller passes are projected to it (steps 4 and 5). In particular, step 4 reconstructs the changing temperature of the asphalted layer by 129
calculating the asphalt cooling rate and combining it with the initial temperature distribution of the layer. Afterwards, the rollers’ trajectories are projected to the context structure within step 5. For this purpose, the geometry of each roller at every time step is related to the geometry of the paved layer (seen as the context structure). To this end, the vertexes of the mesh compacted are identified by using a point-in-polygon algorithm. These vertices then obtain the updated amount of roller passes. The processed data forms the input dataset for the VE. The dataset is comprised of: trajectories of rollers and the paver, calculated compaction impacts, the asphalt temperature, and the geometry of the paved layer as a data referencing mechanism. Based on the input, the VE provides its users with opportunities to both (1) review the conducted equipment trajectories in the context of the documented real-world project and (2) to try out alternative roller trajectories for the same context factor. The first functionality is similar to other environments that enable reviewing of construction processes. The latter functionality allows a user to select a roller and control it to show an alternative roller trajectory. To support this functionality, the environment documents alternative trajectories based on input from its users, transforms the input into equipment trajectories, and calculates alternative equipment impacts. The impacts of alternative roller trajectories are calculated similarly to the approach described above – by applying a point-in-polygon algorithm to the known geometry of the paved layer. The environment forms a distinct dataset describing the alternative compaction impact. The user can select either the original or alternative impact to be demonstrated as a context factor. In this way, the VE provides the users with opportunities to simulate alternative trajectories. To ensure that the operationalized organization scheme can indeed support reviewing and simulating construction processes, the authors of this paper developed and tested a corresponding VE. The corresponding details are provided next.
5.5.3 Specifics of the VE implemented according to the operationalized organization scheme By building on the operationalized method described above the first author of this paper developed a specialized interactive VE with combined simulation and representation functionalities. This section overviews the implementation details of the environment. The data pre-processing stage was implemented in Matlab. The documented equipment trajectories are preprocessed and aligned to each other. Afterwards, the geometry of the paved layer is reconstructed and the temperature and the rollers’ impacts were related to it. The trajectories, and the geo-referenced temperature and impact data form the input dataset for the visualization environment.
130
The developed VE named PaVE (Paving site Visualization Environment) builds on jMonkeyEngine 3.0 – a Java-based game engine coupled with an integrated development environment. This engine is suitable for the illustrative VE implementation because it supports rapid development of 3D applications, provides fluid interactions between the VE and its users, performs user-defined computations, and is capable of visualizing large-scale meshes. The possibility for rapid application development was particularly beneficial. It allowed to iteratively develop the environment with continuous consultations with two asphalt paving specialists and one experienced roller operator. An example of visualizing a documented compaction project within the environment is demonstrated in Figure 6. The temperature values and compaction efforts at specific road locations at any moment of time are represented using mesh visualizations. These visualizations allow interpolating values between the defined points. The user of the environment can explore the progress by adjusting the time slider to proceed to a specific moment of time within the project. Also, VE users can freely navigate within the developed environment by changing the position and the view direction of the virtual camera.
Figure 6. Interface of the developed VE representing equipment locations, temperature of the distributed asphalt layer, and the compaction impact made by the second roller in the fleet
In addition to the functionality to review the real roller equipment trajectories in context, at any moment of time the VE users can take control over a particular roller. The users can demonstrate (by using a mouse or pointing with a pen on the whiteboard) the direction the roller should move. The environment tracks these inputs and calculates new locations of the roller. Then, the compaction impact made by the controlled roller is computed. The new impact, together with context factors as documented during the project, are demonstrated to the users. In this way, the user can see how the alternative impact progresses with time.
131
The demonstrated alternative trajectories can be compared to real ones to pinpoint differences between particular characteristics of the roller trajectories. We developed several indicators suitable for this purpose. The indicators describe the consistency of trajectories of a single roller, consistency of changes in the distance between the roller and the paver, and the impact the roller makes to the asphalted layer. Firstly, the distances travelled in-between reversing roller moving directions were calculated. As rollers typically change their moving direction many times during a compaction project, calculating such distances is useful to assess how consistently roller operators behave on an individual basis. Secondly, the distances between the roller and the paver over time are computed. This indicator demonstrates how roller operators act as members of a larger group. Finally, we calculate additional statistics about the homogeneity of amounts of roller passes. Visually, it can be represented in the format similar to the roller passes demonstrated in Figure 6. Numerically, the calculated percentage of specific amounts roller passes can indicate the homogeneity of the compaction effort. These indicators allow for quick reviewing roller trajectories and impacts, both related to real and alternative equipment trajectories in context. The functionality of the environment was tested with the help of asphalt paving specialists, as it is described next.
5.5.4 Testing the developed VE To examine the applicability of the developed VE to review conducted roller trajectories in context and also to demonstrate alternative trajectories, we conducted two test sessions. The purpose of the test sessions was to identify if real trajectories in context can be reviewed and alternatives to them can be demonstrated within the VE. These test sessions were organized as follows. Firstly, the sensor readings collected during two real projects were pre-processed to form input datasets. Then, one asphalt-paving specialist was invited for the first test session and two professional operators participated in the second session. The asphalt-paving professionals reviewed real compaction projects documented in the field and demonstrated alternative equipment trajectories for the same context factors. Afterwards, alternative equipment trajectories were exported from the VE and compared to the trajectories conducted during real projects. To assist in cross-comparing roller trajectories and their impacts, we calculated indicators characterizing the trajectories and impacts as described above. For the first test session an asphalt-paving project was reconstructed that took place near the city of Apeldoorn in The Netherlands in July 2010. During the daylong working shift the paving team formed by one paver and two rollers constructed two asphalt layers. An undesirable event took place during the construction of the first layer – the paver stopped for a long period of time. Roller operators continued with the compaction and conducted more roller passes behind the paver than desirable. This part of the construction process was selected as the first case to represent within the developed 132
VE. We visualized movements of the paver and one of the rollers that participated in the project. The asphalt temperature distribution after the paver and the compaction effort performed by the roller were calculated. To test the environment, we invited an asphalt paving specialist to demonstrate an alternative roller trajectory within the VE. After the VE user demonstrated an alternative trajectory for the roller, we calculated indicators for both real and alternative trajectories. Figure 7 represents the calculated indicators. The first and third graphs of the figure represent the distances that the real and the virtual rollers travelled in-between reversing their moving directions. The second and fourth graphs characterize changes in distances between the paver and the real (or virtual) roller. The comparable graphs in Figure 7 differ within the highlighted zones. The zones highlight the time when the VE user was controlling the virtual roller, as well as corresponding time periods during the documented project.
Figure 7. Indicators characterizing the real roller’s trajectory and the alternative trajectory demonstrated for the context
As the third graph indicates, the alternative trajectory demonstrated by the VE user was more consistent than the real trajectory, because the distances in-between switching rolling directions were more similar to each other. Likewise, according to the fourth graph, the VE user mostly kept distances between the roller and the paver within a more consistent zone, compared to the real trajectory. These findings and the VE functionality were later discussed with the VE user. The user found the information insightful and indicated that the environment indeed permits to both review the conducted process and simulate alternatives to the real roller trajectories on-site. For the second test session we reconstructed another asphalt paving project conducted in The Netherlands. We selected a test case where the paver stopped and one of the two rollers participating in the project left to refill its water tanks. We invited two roller operators to participate in the second test session. The operators’ professional experience can be seen as comparable, as each of the operators worked for about 25 years in the asphalt compaction domain. Noticeably, these operators were not previously consulted during the development of the VE. 133
Both operators reviewed the documented and demonstrated alternative roller trajectories suitable for the documented context factors. Then, we calculated indicators characterizing the real and each of the two alternative roller trajectories in context (Figure 8). The graphs calculated after the second test session facilitate, similarly to the first test case, comparing the real roller trajectory with the alternative trajectories. Several differences between the trajectories can be noted. In particular, the first column of Figure 8 shows that the first roller operator demonstrated an alternative roller trajectory with consistently varying longer and shorter distances, as the roller travelled in-between switching its moving directions. These differences can be noted in Figure 8 within the highlighted zones. Meanwhile, the second operator preferred a trajectory with longer distances in-between reversing roller’s directions. The second column indicates that both operators suggested compacting closer to the paver during the time they controlled the virtual roller. Similarly to the first column, the comparable trajectory elements are highlighted. Both alternative trajectories resulted in more homogeneous compaction efforts, as the third column demonstrates. This finding is confirmed by the last column of indicators, where alternative equipment trajectories resulted in more preferable distributions of amounts of roller passes over the deployed layer. Specifically, while the real roller passed ten or more times over about 25% of the layer, impacts of both alternative trajectories led to less than 20% of such over-compacted road surface. Besides, a higher percentage of the compacted area received the compaction impact corresponding to three, four, or five roller passes. Also, less percent of the road received more than ten passes, as the last bar in the graphs indicate. As a result, the calculated impact distribution takes a more apparent bell-shaped form, which indicates a reduction in variability of the resulting compaction efforts. Noticeably, the alternative compaction impacts demonstrated by the operators differ between each other. Even though the delivered compaction was more homogeneous, apparently the operators followed different rolling strategies. Similarly to the first test case, these findings were discussed with roller operators. The operators suggested that the environment certainly permits demonstrating alternative trajectories, but do not provide the feeling of a real compaction process. Together, the two conducted test sessions indicated that the developed visualization environment indeed permits its users to review and simulate construction equipment trajectories in context. In addition, the equipment trajectories documented in the real project and their alternatives demonstrated within the context, can be meaningfully compared. Therefore, based on the possibility to use the environment within the desired scope and the ability to cross-compare the summary statistics calculated for real and alternative equipment trajectories in context, we consider the environment functional. To this extend, the suggested method for organizing such specialized VEs demonstrated to be practical. 134
135
Figure 8. Calculated characteristics of the real and alternative trajectories of the roller
5.6 Discussions This paper proposes a novel method for organizing VEs that can assist in both reviewing actual construction equipment trajectories in context as well as experimenting with alternative trajectories. As trajectories both depend on and contribute to the context, the interactions between the context and equipment trajectories have to be structured prior to building such an environment. This structuring needs to account for the operators’ actions and the impacts the equipment makes. Proceeding from this assumption, we suggested a method to develop an environment. First, the suggested “context-actions-trajectory-impact” framework should be applied to structure the interactions between trajectories and the context according to known specifics of the construction process of interest. This framework can assist in disentangling intricate interrelations between the context of the construction process, operators’ actions, and the outcome of these actions (both trajectories and the work conducted). Then, based on the framework, a specialized VE can be arranged by operationalizing an overall organization scheme for such VEs. To illustrate the proposed method we operationalized it for the case of asphalt compaction process by taking into account the known specifics of the process. Four context factors were chosen to be represented within the environment. Also, the interrelations between the operators’ actions and the outcomes of these actions were devised. The operationalized method guided the development of a corresponding VE. The data pre-processing stage to form the input dataset was implemented in Matlab, while the developed illustrative VE was implemented using a Java-based game engine. The developed environment was tested during two sessions. The tests illustrated that the developed VE provides possibilities to both review real roller trajectories in context and also demonstrate alternative trajectories. Participants of the test sessions noted that the functionality of the VE to review and simulate construction processes within one VE provides a specific level of abstraction in analyzing equipment trajectories in context. Specifically, it becomes possible to review and simulate continuous and lengthy construction projects because of detachment from the second-by-second continuous visualizations and concentrating on trajectories with respect to particular context factors. Without direct connection to time and the visualization cues, the developed environment deals with the knowledge of equipment operators and how to compact the deployed asphalt mixture, rather than with the operators’ skills. Therefore, the introduced method can assist in bridging the gap between the corresponding on-site and off-site reasoning of equipment operators. By bridging the gap between knowledge-based and skills-based reasoning, the proposed method provides additional possibilities to exchange and build upon knowledge of construction professionals. The developed VE enables specific actions to
136
be demonstrated in a particular context. Thus, the VE can assist in explicating tacit knowledge of professional equipment operators. The proposed method not only combines two distinct functionalities of different VE classes, it also suggests how to reduce the time delay between tracking construction processes and simulating alternatives to them within a VE. Given this possibility, VEs organized according to this method could be used in education sessions organized shortly after the completion of construction. During these sessions a VE can deliver personalized feedbacks to the project participants. It can be envisioned that such feedback sessions could be organized as follows: (1) the documented actual process is reviewed by the project participants, (2) The feedback session participants discuss some indicators characterizing equipment trajectories, (3) the VE users demonstrate alternative construction processes, (4) and the indicators related to the alternative processes are examined. Although the illustrative VE indeed showed the applicability of the suggested method, the decisions made during the operationalization of the method resulted in specific aspects of the developed environment. Firstly, as a result of design decisions, only four of the context factors were chosen to be represented within the environment. Multiple other factors, such as the thickness of the asphalt layer, were left aside. In addition, the operationalized framework omitted the connection between operator’s actions and the impact. Secondly, the embodiment of the VE can clearly be adjusted and extended. Although in the illustrative implementation the data pre-processing and representation were implemented using different programming languages, these elements could also be embodied as a single software package. Then, the interactions between the user and the environment were not organized using the set of controls typical for an asphalt roller. Also, physical models related to equipment movements were not considered. The acceleration, deceleration, and turning radius of equipment of the equipment were not simulated in the visualization environment. Finally, the adopted representation of context was also different from the real-world settings: the context factors were demonstrated on a screen and operators need to comprehend them, rather than feel the vibration of the equipment or see “white smoke” over the recently paved asphalt layer. It can be noted that the developed environment operates differently from the virtual reality. Improved physical models of equipment movements and more realistic data visualization and interaction abilities could benefit the environment. From the perspective of the method, several aspects characterize the proposed framework, the organization scheme of a visualization environment. Firstly, to enable separating equipment trajectories from their context, the framework approaches the construction process from a particular perspective. For this purpose, the concepts of context, operator’s actions, trajectory, and impact are introduced. Applying these concepts to view construction processes implies a rather mechanical representation of the process. Additional elaboration of the components, particularly those related to 137
human reasoning, can be useful for more advanced frameworks. For instance, answering questions how operators deal with the incoming information, including prioritizing and aggregating information flows, can assist in clarifying or adjusting the provided “context-actions-trajectory-outcome” framework. Secondly, the outlined organization scheme can additionally be tuned to adjust data processing arrangements. For instance, in the proposed scheme the context structure is reconstructed from the equipment trajectories. The advantages of reconstructing the context prior to the VE are twofold: (1) the calculation demands within the VE can be reduced to facilitate fluid interactions between the user and the environment, and (2) it becomes possible to carefully cross-compare real and alternative trajectories and their impacts within the same stabilized context. Nevertheless, to further reduce the computation demands, a more generic mesh or grid representing the context can be used. Such generic grid can represent the same pre-calculated data structure for several different projects. Future research related to the limitations of the proposed method can take several forms. Firstly, the utilization of this method is possible only if data acquisition was conducted in a way adequate for future data processing. This assumption is reasonable. For instance, it was proposed how to align documenting trajectories of construction equipment with respect to future utilization of the acquired data [Vasenev et al., 2014a]. Then, information fusion can be applied to filter outliers in the equipment trajectories [Vasenev et al., 2014b]. However, because data acquisition is critical for future data processing, additional research in this direction is desired. Secondly, operationalizing the method for other construction processes can provide additional insights regarding how the data acquisition can be organized. Clearly, such operationalizing would also be useful to study the benefits and limitations of the suggested method. Future research can also explore the applicability and suitability of quantifying equipment trajectories, for instance by using statistical-based graphs utilized in this research. During test sessions this topic received significant attention from construction professionals. The test participants confirmed that such graphs could indeed provide brief and insightful overviews of conducted trajectories. Specifically, the practitioners suggested that this approach can help to “digitalize” equipment trajectories and thus make them possible for future analysis and comparisons. As an example, such indicators could assist in tracking the progress of equipment operators who start their careers. Future research can investigate how to expand the method towards creating multi-user environments. Such direction is of particular interest, because typically multiple equipment share the same goal. As a result, equipment operators might need to adjust their actions to maintain or improve the performance of the team as a whole. A possible step in the direction of developing such VEs is to implement multiple client-oriented
138
visualizations that communicate with a server that runs the overall simulation [Vasenev et al., 2012b]. Finally, additional research could investigate to what extent the VEs organized according to this method support human-centered construction process simulations. This research would be in line with the transition from the existing practice of visualizing construction sequences to simulating construction processes. Due to its significance, this transition is one of the relevant R&D initiatives for the next decades [Dawood, 2009]. In this regard, the suggested method can assist in improving understanding of how to organize human-centered simulations of construction processes.
5.7 Conclusions The success of construction projects and construction firms increasingly depends on effective utilization of construction equipment on-site. Pervasive networks and new and less expensive sensors make construction sites more data rich. These data can be used to study and search for ways to advance the utilization of construction equipment via interactive visualization environments. This paper proposes a novel approach to build specific interactive visualization environments that can represent documented equipment trajectories to conduct review, as well as to allow experimentations with alternative trajectories in context. The proposed method is formed by two elements: (1) the “context-actions-trajectory-impact” framework to assist in disentangling continuous interrelations between equipment trajectories and their context; and (2) an organizational scheme outlining how to organize interactive simulation and representation environments. This paper illustrates the applicability of the proposed method by operationalizing it for the case of asphalt compaction – a construction process that heavily depends on roller trajectories in context. Based on known specifics of the asphalt compaction process, four context factors were chosen to be represented within the environment. The corresponding VE was developed according to the operationalized method. Later, the VE was tested with the involvement of professional roller operators. During the tests the VE provided its users the opportunity to both (1) review the actual equipment trajectories in context, as documented during real-world projects and to (2) develop and demonstrate (or try out) alternative roller trajectories for the same context factor. The comparison of the real and alternative trajectories was found to be valid and create meaningful insight for equipment deployment strategies. Visualization environments developed according to the method can easily be integrated into diverse education sessions, including feedback sessions conducted after the completion of a construction project. Using sensors’ acquired data of the real construction projects in the visualization environment reduces the modeling effort 139
significantly. This creates a flexible solution for analysis, learning, and training. It can be expected that such utilization will result in enhancing the operators’ professional knowledge and lead to improvements of construction processes on-site.
5.8 Acknowledgements This work was supported by the Pioneering Foundation and would not have been possible without cooperation with asphalt paving professionals from the Dutch ASPARi (Asphalt Paving Research and Innovation) network. In particular, the authors would like to thank Frank Bijleveld and Marco Oosterveld for fruitful discussions.
5.9 References Akhavian, R. and A. H. Behzadan (2012). "An integrated data collection and analysis framework for remote monitoring and planning of construction operations." Advanced Engineering Informatics, 26(4): 749-761. Alexander, M. L. and C. S. Hughes (1989). "Compaction of asphalt pavement." Transportation Research Board National Research Council, Washington, D.C. Asphalt Institute (1989). "The Asphalt Handbook." The Asphalt Institute, Lexington, Kentucky. Balaguer, C. and M. Abderrahim (2008). "Trends in Robotics and Automation in Construction." Robotics and Automation in Construction, Carlos Balaguer and Mohamed Abderrahim (Ed.) INTECH Open Access Publisher. Bekebrede, G. (2010). "Experience Complexity / A gaming approach for understanding infrastructure systems." TUD Technische Universiteit Delft. Bijleveld, F. R. and A. G. Dorée (2014). "Method-based learning: a case in the asphalt construction industry." Construction Management and Economics 32(7-8): 665-681. Bossemeyer, H. (1966). "Temperaturverlauf beim Einbau von bituminösen Mischgut." Ph.D. Dissertation, Darmstadt. CAE Mining website (2014). "CAE - Mining" http://www.cae.com/cae-terra-simulator/, last retrieved December 2014.(Archived by WebCite® at http://www.webcitation.org/6Tdse0jCh). Chavada R. and N. Dawood (2010). "An innovative approach to integrate H&S issues in the construction project planning using serious game engine technologies", CONVR2010, Sendai, Japan, November 4-5, 2010, in Makanae, K., Yabuki, N. and
140
Kashiyama, K. (Eds.) Proceedings of the 10th international conference on construction applications of virtual reality: 209-218. Cheng, T. and J. Teizer (2013). "Real-time resource location data collection and visualization technology for construction safety and activity monitoring applications." Automation in Construction 34: 3-15. Commuri, S. and M. Zaman (2008). "A novel neural Network-based asphalt compaction analyzer." The International Journal of Pavement Engineering 9(3): 177-188. Dawood, N. (2009). "VR-roadmap: a vision for 2030 in the built environment." ITcon 14: 489-506. Dey, A. (2001). "Understanding and Using Context." Personal Ubiquitous Comput. 5(1): 4-7. Fang, Y., J. Teizer and E. Marks (2014). "A Framework for Developing an As-built Virtual Environment to Advance Training of Crane Operators." in: Construction Research Congress: 31-40. Fischer, G. and J. Ostwald (2001). "Knowledge Management: Problems, Promises, Realities, and Challenges." IEEE Intelligent Systems 16(1): 60-72. Floss, R. (2001). "Compaction Technology in Earthwork and Highway and Transportation Engineering." Munich, BOMAG GmbH & Co. OHG. Gonzales, V. and T. Echaveguren (2012). "Exploring the environmental modeling of road construction operations using discrete-event simulation." Automation in Construction (24): 100-110. Goulding, J., W. Nadim, P. Petridis and M. Alshawi (2012). "Construction industry offsite production: A virtual reality interactive training environment prototype." Advanced Engineering Informatics 26(1): 103-116. Gransberg, D. D., C. M. Popescu and R. Ryan (2006). "Construction Equipment Management for Engineers, Estimators, and Owners." Taylor & Francis. Gu, N. and J.-H. Tsai (2010). "Interactive graphical representation for collaborative 3D virtual worlds." Computer-aided Civil and infrastructure engineering 25 (1): 55-68. Hartmann, T., M. Fischer and J. Haymaker (2009). "Implementing information systems with project teams using ethnographic-action research." Advanced Engineering Informatics 23(1): 57-67. Huang, T., C. W. Kong, H. L. Guo, A. Baldwin and H. Li (2007). "A virtual prototyping system for simulating construction processes." Automation in Construction 16(5): 576-585.
141
Huerne, H. (2004). "Compaction of asphalt road pavements: using finite elements and critical state theory." Ph.D. Dissertation, University of Twente. Kamat, V. R. and J. C. Martinez (2001). "Visualizing simulated construction operations in 3D." Journal of Computing in Civil Engineering 4(15): 329-337. Kang, L. S., H. S. Moon, N. Dawood and M. S. Kang (2010). "Development of methodology and virtual system for optimised simulation of road design data." Automation in Construction 19(8): 1000-1015. Knight., C. (1998). "Visualisation for Program Comprehension: Information and Issues." Computer Science Technical Report University of Durham. Li, H., N. K. Y. Chan, T. Huang, M. Skitmore and J. Yang (2012a). "Virtual prototyping for planning bridge construction." Automation in Construction 27: 1-10. Li, H., N. K. Y. Chan, M. Skitmore, M. (2012b). "The use of virtual prototyping to rehearse the sequence of construction work involving mobile cranes." Construction Innovation 12(4): 429-446. Lin, K.-Y., J. Wook Son and E. M. Rojas (2011). "A pilot study of a 3D game environment for construction safety education." ITcon 16: 69-84. Mikropoulos, T. A. and A. Natsis (2011). "Educational virtual environments: A ten-year review of empirical research (1999-2009)." Comput. Educ. 56(3): 769-780. Miller, S. R. (2010). "Hot mix asphalt construction: towards a more professional approach." Ph.D. Dissertation, University of Twente. Miller, S. R., T. Hartmann and A. G. Dorée (2011). "Measuring and visualizing hot mix asphalt concrete paving operations." Automation in Construction 20(4): 474-481. Pradhananga, N. and J. Teizer (2013). "Automatic spatio-temporal analysis of construction site equipment operations using GPS data." Automation in Construction 29: 107-122. Rekapalli, P. V. and J. C. Martinez (2009). "Runtime User Interaction in Concurrent Simulation-Animations of Construction Operations." Journal of Computing in Civil Engineering 23(6): 372-383. Retik, A. and A. Shapira (1999). "VR-based planning of construction site activities." Automation in Construction 8(6): 671-680. Riss, U. (2005). "Knowledge, Action, and Context: Impact on Knowledge Management." Professional Knowledge Management. K.-D. Althoff, A. Dengel, R. Bergmann, M. Nick and T. Roth-Berghofer, Springer Berlin Heidelberg. 3782: 598-608. Simlog website (2014). "Simlog home page – Simlog." http://www.simlog.com/, last retrieved December 2014. 142
Stojanovic, V., R. Falconer, J. Isaacs, D. Gilmour and D. Blackwood (2013). "Interactive visualisation to support sustainability assessment in land use scenario planning." in: Smith, S. D. and Ahiaga-Dagbui, D. D. (Eds) Procs 29th Annual ARCOM Conference, Reading, UK, Association of Researchers in Construction Management: 1371-1380. Sullivan, C. and A. H. De Bondt (2009). "Greener, leaner, meaner." in: Asphalt Professional, September 2009: 18-23 Tamer Cavusgil, S., R. J. Calantone and Y. Zhao (2003). "Tacit knowledge transfer and firm innovation capability." Journal of Business & Industrial Marketing 18(1): 6-21. Teizer, J., U. Mantripragada, M. Venugopal (2008). "Analyzing the travel patterns of construction workers." in: ISARC 2008 - Proceedings from the 25th International Symposium on Automation and Robotics in Construction, Vilnius (Lithuania), Vilnius Gediminas Technical University Publishing House: 391-396. Teizer, J., T. Cheng and T. Fang (2013). "Location tracking and data visualization technology to advance construction ironworkers' education and training in safety and productivity." Automation in Construction 35: 53-68. Turkiyyah, G. (2007). "Final Technical Report TNW2007-03, SIMPAVE: Towards Building Interactive Simulations for Planning." http://www.lib.washington.edu/Msd/norestriction/b60940657.pdf, last retrieved December 2014. Vasenev, A., F. R. Bijleveld, T. Hartmann and A. G. Dorée (2012a). "A real-time system for prediction cooling within the asphalt layer to support rolling operations." in: Eurasphalt & Eurobitume Congress, Istanbul, Turkey: 1-7. Vasenev, A., T. Hartmann and A. G. Dorée (2012b). "Multi-user interactive visualization of asphalt paving operations." in: 9th European Conference on Product and Process Modeling, Reykjavik, Iceland: 753-758. Vasenev, A., T. Hartmann and A. G. Dorée (2013). "Employing a virtual reality tool to explicate tacit knowledge of machine operators." in: ISARC 2013, the 30th international symposium on automation and robotics in construction and mining, Montreal, Canada: 1-8. Vasenev, A., T. Hartmann and A. G. Dorée (2014a). "A distributed data collection and management framework for tracking construction operations." Advanced Engineering Informatics 28(2): 127-137. Vasenev, A., N. Pradhananga, F. R. Bijleveld, D. Ionita, T. Hartmann, J. Teizer and Dorée A.G. (2014b). "An information fusion approach for filtering GNSS data sets collected during construction operations." Advanced Engineering Informatics 28(4): 297-310.
143
Velez, G., L. Matey, A. Amundarain, A. Suescun, J. A. Marín and C. Dios (2013). "Modeling of Shotcrete Application for Use in a Real‐Time Training Simulator." Computer‐Aided Civil and Infrastructure Engineering 28(6): 465-480. Waris, M., M. Shahir Liew, M. F. Khamidi and A. Idrus (2014). "Criteria for the selection of sustainable onsite construction equipment." International Journal of Sustainable Built Environment 3(1): 96-110. Wise, J. and R. Lorio (2004). "A practical guide for estimating the compaction window time for thin-layer hot mix asphalt." in: Proceedings of the 8th Conference on Asphalt Pavements for Southern Africa (CAPSA'04) Vol. 12: 16. Woksepp, S. and T. Olofsson (2008). "Credibility and applicability of virtual reality models in design and construction." Advanced Engineering Informatics 22(4): 520-528. Zanen, P. P. A., T. Hartmann, S. H. S. Al-Jibouri and H. W. N. Heijmans (2013). "Using 4D CAD to visualize the impacts of highway construction on the public." Automation in Construction 32(0): 136-144.
144
Chapter 6. Conclusions and discussions The asphalt compaction process relies heavily on the skills and knowledge of roller operators who act alongside other stakeholders involved in asphalt paving. It is essential that these construction specialists: (1) are adequately informed about the initial temperature distribution of the asphalt layer – an essential context factor of asphalt compaction; and (2) have the possibility to improve their knowledge by reflecting on the already-conducted and alternative compaction strategies. Both these challenges can benefit from visualizing sensor readings that characterize trajectories of asphalt compaction equipment in the context of the temperature distribution of the asphalt layer. This thesis concentrates on developing several interconnected methods to acquire, process, and represent these sensor readings. The methods enable visualizing the sensor readings during the compaction process and after its completion. The corresponding visualizations are designed to inform process stakeholders located onsite and distant from the construction site. The methods build on and contribute to the field of construction informatics. These methods incorporate elements that account for known specifics of the asphalt compaction process. The suggested methods aim specifically to inform roller operators about the temperature of the distributed asphalt layer and to provide them with ways to consider conducted (and alternative) trajectories with respect to their context. This chapter starts with a summary of the main findings described in chapters 2–5. Afterwards, it provides reflections on the adopted methodology and suggests practical implications. Finally, it discusses the limitations of the research and concludes by outlining directions for future research.
6.1 Main findings The main findings of this research are described in chapters 2–5. These correspond to published research or academic manuscripts that have been submitted and are under review. These chapters address directly the research questions formulated in the introduction. The chapters describe methods related to specific steps of the data visualization workflow: acquiring, processing, or representing the processed data. The methods were developed iteratively whilst testing their implementation as illustrative information systems. These systems were tested with the help of asphalt paving specialists. The overall structure of this thesis with respect to the developed methods and their illustrative implementations is shown in Figure 1. 145
Figure 1. Arrangement of methods and information systems described in this thesis
This subsection shortly summarizes individual contributions of the chapters and provides overall conclusions of the research.
6.1.1 Conclusions on individual chapters Each chapter in this thesis represents a particular part of the research and is connected strongly with the overall research topic. Chapter two provides the basis for future research of visualizing sensor readings characterizing asphalt equipment trajectories in the context of asphalt temperature distributions. The chapter concentrates on the first step of the data visualization procedure – acquiring sensor readings. One outcome of the research is a framework for supporting distributed data collection and management. This fosters real-time data processing, along with retaining highly precise data for post-process analysis by employing sensor readings with varying levels of detail to inform different levels of decision making (operational, tactical, and strategic). The stakeholders’ needs for information are derived from domain-specific knowledge and discussions with construction specialists. These needs are projected to two information delivery modes: during the construction process; and after the completion of the construction. These modes serve different purposes: while close to real-time solutions can help operators on-site, careful project data analysis could reveal particular within- and across- project 146
interdependencies of process factors. The framework suggests performing real-time data processing with a decreased level of detail of the sensor readings, as well as preserving data at multiple locations. The decrease in the level of details can reduce the demand for transmission bandwidths and avoid the need to process overwhelming amounts of data. At the same time, the documented data remain available for later upload to a warehouse database for future analysis. The third chapter describes a method to process sensor readings to reconstruct the initial temperature distribution of the paved layer – an essential context factor that influences heavily the work of asphalt roller operators. If roller operators do not react adequately to this context factor, then temperature differentials, virtually unavoidable during the paving process, can lead to the reduced lifetime of the constructed road. Though the need to inform roller operators about this context factor was recognized before, no information system previously provided such a possibility. This can be partially explained by the absence of a data processing procedure to reconstruct temperature distribution of an asphalted layer sensed behind the paver. Chapter three aims to overcome this barrier by suggesting how to process readings from temperature and location sensors to reconstruct the initial asphalt temperature distributions. The proposed procedure accounts for known specifics of the asphalt paving process which govern the data processing procedure. The automatically reconstructed geo-referenced model of the deployed asphalt describes the layer’s geometry and the initial temperature distribution. This model can be used during real-time construction activities to inform roller operators about the context of their work. Additionally, the model can inform quality assessment and investigation tasks, as well as allow future reviewing of the conducted compaction processes. Chapter four continues the topic of data processing and suggests a method to filter documented equipment trajectories from eventual outliers. Eliminating outliers in documented equipment paths is an important task as it ensures the adequacy of future analysis, which can lead to better understanding and improved construction processes. Eliminating outliers manually is time-consuming and an error-prone process. Automatic filtering is subject to false positive errors which can lead to filtering out accurate trajectory segments. Accounting for additional information, such as human-generated notes (“soft data”), and the integration of human reasoning into the filtering process, can be of help. However, a method to incorporate these elements was previously lacking. The human-centered approach described in chapter four fills this gap. This chapter suggests how human reasoning (based on the user’s knowledge and understanding of the process at hand) can be incorporated into an information system. In this way, human experts who possess knowledge about construction processes can be involved in filtering equipment trajectories. The expert defines the initial search parameters to find potentially erroneous path segments. Additional information about the construction project informs the expert's decisions if the path segments are 147
potentially prone to outliers within specific spatial or temporarily constraints. The expert’s knowledge about the paving process is outlined as a set of interdependent “general”, “situated”, and “operationalized” rules. Similarly to other methods suggested in this thesis, the method proposed in chapter four was implemented as an illustrative information system. The developed software was applied to filter outliers in trajectories of earthmoving and asphalt paving equipment. The application of two methods suggested in chapters four and three help eliminate outliers in the documented trajectories and reconstruct the context of the asphalt compaction process correspondingly. The processed equipment trajectories and the reconstructed context then can be represented to roller operators (and other construction specialists) who can review the conducted processes and consider alternatives. Chapter five suggests a method to organize a specialized Visualization Environment (VE) for this purpose. Such a VE enables to: (1) represent real-world equipment trajectories with respect to temperature distributions of the asphalt layer; and (2) support the VE users in experimenting with alternative equipment trajectories for the same context. Although several specialized visualization environments were proposed earlier to review or simulate construction activities, those approaches had existed separately and no method was suggested to unite these functionalities. However, bringing these functionalities together in a coherent way is beneficial when considering the interrelations between equipment trajectories and specific context factors. The utilization of such a VE to consider these interrelations is of particular benefit if construction processes are unique, expensive, or dangerous to reproduce. The representation method proposed in chapter five complements the data acquisition and processing methods suggested in chapters two, three, and four. Together, the set of methods addresses how to visualize sensor readings characterizing equipment trajectories in context of asphalt temperature. These data acquisition, processing, and representation methods directly address the two challenges outlined in the introduction, as described next.
6.1.2 Overall conclusions Due to the nature of asphalt compaction operations, roller trajectories take place in specific asphalt temperature context and with multiple stakeholders being involved in the compaction process. The stakeholders are located both on- and off-site and participate in the process in different ways. Information about the equipment trajectories and their context need to be represented to stakeholders according to their needs if it is to benefit them. These needs often demand that information is delivered either in close to real-time mode or after the completion of the project.
148
This thesis particularly concentrates on the needs of roller operators, as their actions during the compaction process have a high degree of influence on the lifetime of the roads constructed. Those needs are concerned with how to apply skills on a construction site and how the professional knowledge of the operators can be improved. This thesis, to a lesser extent, also accounts for other construction specialists who can benefit from the information about roller trajectories in the context of these trajectories. Given this positioning, the methods suggested by this thesis address two specific challenges. The first challenge is related to the question of how to inform roller operators and other construction specialists about the temperature distribution when this is such an important context factor of the compaction process. The second challenge concerns how to provide construction specialists with the possibility to improve their knowledge by reviewing already-conducted and to experiment with alternative roller trajectories within specific asphalt temperature distributions. This thesis approaches the challenges from the visualization perspective. Both challenges were incorporated into the overall research question of this study as follows: “How can visualizations of sensor readings that characterize asphalt roller trajectories in the context of asphalt temperature distributions be organized to inform construction specialists about the compaction process in both close to real-time mode and after the completion of projects?” To answer the research question, this thesis suggests several methods that build on advances from the body of knowledge of construction informatics and also account for known specifics of the asphalt compaction process. In this way, this thesis is concerned with how to apply multiple sensors to track equipment trajectories in the temperature context. The adopted research procedure is described in more detail in section 1.4 “Research design”. This thesis aligns the methods for data acquisition, processing, and representation as typical steps of a data visualization workflow. Chapter two proposes a method for data acquisition, chapters three and four suggest how to process context and trajectories correspondingly, and chapter five introduces a method to represent the processed data. The methods stay independent within the suggested set and concentrate on specific data visualization steps whilst also allowing their combination to address larger data visualization challenges. In so doing, the methods from chapters two and three address the first challenge and enable equipment operators and other construction specialists to be informed objectively about the initial temperature distributions. The second challenge requires application of all four methods described in this thesis. Even though the developed methods primarily aim to support asphalt roller operators, other construction specialists can benefit from them also. Specifically, the developed methods enable delivering relevant information to multiple construction professionals at both on- and off-site locations, such as paver operators, project managers, quality assurance personnel, and project planners. Therefore, the solutions deriving from the 149
suggested methods can assist multiple stakeholders to make well-informed decisions to plan, execute, assess, and improve asphalt paving and compaction processes. Therefore, the suggested methods not only concern with the tasks of equipment operators, but also link operators’ work to a larger organizational setting. It can be expected that the information systems based on the proposed methods can enhance compaction practices and thus contribute to prolonging the lifetime of asphalt roads – a goal for construction companies wishing to maintain a competitive advantage in the marketplace.
6.1.3 Main contributions to scientific literature This thesis proposes how to acquire sensor readings characterizing asphalt roller trajectories in context, process them, and represent the obtained information in realtime and after the completion of the construction project. The representations aim to support multiple stakeholders, who are located both on- and off-site. The suggested methods build on and contribute to the field of construction informatics. Individually, the methods contribute to scientific literature as follows:
150
-
Chapter two suggests a novel framework that is concerned with acquiring and managing sensor readings collected during construction operations. Several ways to meaningfully collect readings from sensors located at construction sites have been introduced earlier (e.g. in [Leung et al., 2008; Chen & Kamara, 2011]). However, these previous approaches did not consider collecting and processing sensor readings in different levels of detail to support operational, tactical, and strategic decision-making. Our proposed framework fills this gap by suggesting a scheme to benefit from exploiting readings from the same sensors in varying levels of detail to inform the different decision-making levels. Information systems arranged according to this framework will inform spatially distributed equipment operators and site managers in close to realtime. At the same time, the information system can inform strategic decisionmakers within construction companies about the details of a construction process after its completion.
-
Chapter three suggests a data processing procedure that reconstructs an essential context factor of the asphalt equipment operators’ work: the initial temperature distribution of the paved layer. Earlier, several suggestions have been developed as to how to acquire [Swaner, 2010; Glee et al., 2012] and represent [Miller et al., 2011; Turkiyyah, 2007] sensor readings characterizing asphalt temperature distributions. However, the connection between these tasks was not elaborated. As a result, some representation solutions implied that the temperature distributions are reconstructed already from real data; while others just simulated this context factor. The chapter bridges the gap of
previous research related to data acquisition and representation tasks. The suggested procedure advises how to process individual sensor readings; how to remove excessive data points; and how to generate the geometry of the paved layer together with the initial temperature distribution of the paved layer. The corresponding data processing steps are governed by rules derived from known specifics of the construction process. -
Thereafter, the thesis continues the topic of data processing and concentrates on eliminating outliers in the documented equipment paths, as described in chapter four. Previous studies on this topic were concerned with either applying statistical techniques, such as moving average methods, or fusing (as suggested in [Caron et al., 2006; Peyret et al., 2000; Herrera et al., 2013]) different input data streams to remove outliers automatically. Though such automated filtering methods often can improve the accuracy of the documented equipment paths significantly, such methods also can remove erroneously path segments related to specific movements of the equipment [Bijleveld et al., 2011]. The chapter extends the literature related to filtering outliers in equipment paths by proposing a human-centered information fusion approach that accounts for both sensor readings and human-generated data that describe expected equipment movements. The chapter suggests a novel hybrid filtering method as a plausible solution and illustrates how human reasoning can be incorporated into information systems oriented towards data processing.
-
Finally, chapter five is concerned with how to arrange specialized interactive simulation visualization environments to represent equipment trajectories in context to construction specialists. Previously, VEs that dealt with construction equipment trajectories were oriented, either to review the conducted trajectories [Teizer et al., 2013; Miller et al., 2011], or to experiment with alternatives [Turkiyyah, 2007; Gonzales & Echaveguren, 2012]. In the first case, specialized environments represent conducted equipment trajectories and their actual context. In the second case, VEs enable experimenting with alternative equipment trajectories within a priori defined contexts). Chapter five proposes how to arrange specialized interactive simulation visualization environments for both review and experimentation with construction equipment trajectories. The context of these trajectories is reconstructed drawing on data from an actual construction project. Visualization environments developed according to the method can be integrated easily into diverse educational sessions, including feedback sessions conducted after the completion of a construction project.
The proposed methods together form a system designed to visualize sensor readings characterizing asphalt roller trajectories in context. Prior to this research, in the domain 151
of construction informatics, the topic of visualizing equipment trajectories in context was addressed normally either at the level of data processing (as e.g. in Behzadan [2008]) or, alternatively, visualizations were studied as elements of other tasks, such as assessing construction safety [Pradhananga, 2014]. The research described in this thesis also concentrates on a procedure of visualizing sensor readings, but pays attention to all aspects of the data visualization workflow (seen within this thesis as steps of acquiring, processing, and representing data). This thesis links knowledge about specifics of the asphalt compaction process with recent advances in construction informatics to develop the methods. The methods suggested in chapters 2–5 are, therefore, the result of unifying these knowledge domains. As a result, by illustrating how the process-specific knowledge can be utilized within data visualization methods, this thesis also contributes to scientific literature as a case study on how to visualize sensor readings characterizing a specific construction process with the help of known specifics of this process.
6.2 Practical implications This thesis addresses practical tasks related to asphalt compaction by building upon and contributing to the construction informatics domains. From this perspective, several implications can be derived that are relevant to both developers of specialized information systems and asphalt paving companies.
6.2.1 Implications for information systems developers Every chapter of this thesis suggests and demonstrates the practicality of a specific method tailored to address a particular task. Developers of information systems can consider using or adopting these methods independently, or as a part of a larger visualization solutions. These following specific implications are forthcoming when considering the data visualization workflow steps – data acquisition, processing, and representation: -
152
Developers might pay more attention to adaptive and integrated ways to acquire and manage sensor readings. They should examine and consider the differences in the specific needs of each type of stakeholder involved with each decision-making level (operational, tactical, and strategic) within construction companies. Such an approach, as demonstrated in chapter two, can provide a ground to move toward multi-functional solutions to overcome existing incompatibilities of different commercial products that complement each other in addressing operational, tactical, and strategic decision making tasks.
-
System developers might benefit from employing and further developing data processing approaches devised with respect to the process-related knowledge, as described in the thesis. Considering the specifics of a construction process can assist in identifying some disturbances (e.g. outliers) in collected data that are not in line with the expectations about the process at hand. For example, developers can interact with specialists in the asphalt paving domain to encode their process-related knowledge as sets of rules suitable to apply within data processing procedures. Additionally, interactive ways of data processing could be considered for tasks that cannot be easily fully automated. The amount of knowledge hard-coded into the systems should be aligned with the needs of practitioners.
-
Developers should consider further exploiting solutions to represent the compaction process in adequate and understandable ways. For instance, sophisticated visualization environments can help training and further diversifying the working skills of equipment operators. Potentially, these environments can be embodied as 3D simulators to train several asphalt equipment operators simultaneously as they collaboratively solve specific tasks. The set of methods suggested in this thesis provides a milestone in this direction. Such an environment might be of particular interest to professional education institutions and to construction companies that search for continuous process improvements.
Essentially, information system developers should consider carefully the needs of construction companies that are interested in advancing their work. In the case of such collaboration, construction companies can enhance their practices by employing novel and efficient solutions; while developers can create useful systems to address directly the specific needs of stakeholders located within the companies.
6.2.2 Implications for construction companies This thesis suggests ways to inform roller operators (and other construction specialists) about roller trajectories with respect to the working context of asphalt temperature. Construction companies interested in improving their working practices should consider adopting information systems with such functionalities. Besides, the companies have the potential to sharpen specialized solutions by communicating with developers. Specifically, the companies should consider several aspects related to: -
How to utilize information systems (including those described in this thesis and others solutions) to document construction processes completely. For instance, the obtained geo-referenced temperature distributions can form an object of reference for linking multiple types of sensor readings. As an example, nuclear density measurements, or data from ground penetrating 153
radars, can be combined directly with the geo-referenced geometry of the paved layer. Such data-rich approaches can foster future data processing. Analysis of these data can inform multiple construction process stakeholders (including operators, construction managers, quality control personnel, and strategic decision makers) situated at different decision-making levels within a construction company.
154
-
How to align the needs of stakeholders involved in the compaction process to information flows obtained by documenting the process. Clearly, additional information can benefit multiple tasks related to tracking, assessing, and analyzing paving projects. In case of real-time tracking of construction processes, analyzing stakeholders’ needs can assist in identifying events or conditions that require special attention. To support close to real-time information delivery, the desired degree of information detail can be devised. Chapter two illustrates the logic of applying such considerations. In the case of assessing construction processes, it is important to consider their final outcomes carefully. For instance, because temperature differentials can lead to the earlier deterioration of the road surface, quality controllers might benefit from having access to localized information about the differentials. If the locations are known, additional asphalt cores can be drilled to better assess the outcome of the construction project. The identified locations of temperature differentials are also valuable for forensic analysis to investigate if identified damages at any particular road locations correlate with the zones of uneven temperature distributions. The suggested method to reconstruct the initial temperature distributions of the asphalt layer can inform these tasks. Finally, analyzing the road construction process can benefit from identifying interrelations between different aspects of the process. For example, the analysis can identify and predict how disturbances in the process of delivering asphalt mixture to a construction site can influence productivity of roller operators. The dependencies derived from analyzing, assessing, and tracking the processes could then assist in planning future road construction projects.
-
How to arrange review sessions to improve knowledge of construction professionals. Our vision envisages new and novel up-to-date possibilities of specialized visualizations, such as the visualization environment described in this thesis. As yet these are underexplored. Review sessions arranged around specialized VEs can assist discussion of the specifics of the conducted operations, as well as considering alternatives. In this way, construction companies can address challenges related to the changes in their knowledge landscape, when more experienced operators retire and new operators start their professional career. Also, construction companies can consider collaborating with professional education institutions that train equipment operators. Within this collaboration, the companies can demonstrate their real-
world cases within their education programs. This would assist in preparing construction specialists to be able to face the practical challenges related to their professional tasks. To advance in these directions construction companies should collaborate with developers of information systems. The companies need to find ways to communicate their requirements with the developers effectively. Such close communications would allow the industry-wide needs to be addressed in an adequate manner. The research illustrates this point as a specific case study, concerned with questions how to acquire, process, and represent sensor readings characterizing equipment trajectories in context. As the conducted research made possible the development and testing of several prototypical information systems within a relatively short timeframe, the idea of collaborating between system developers and construction practitioners appears to be practical. The methodological reflection that illustrates this idea is presented next in more detail.
6.3 Methodological reflection This thesis builds on knowledge from construction informatics and also accounts for specifics of the asphalt compaction process. It uses knowledge of asphalt paving experts (how asphalt paving and particularly how the asphalt compaction processes are performed) and information system developers (how to organize information systems). Within the research trajectory several methods were developed to provide practical means to improve and apply the knowledge of equipment operators (related to how to act in context). The study followed the research design described in section 1.4. to develop the methods. This section reflects on the use of the adopted methodology. The methodology adopted was formed by combining an ethnographic-action research approach with a human-centered distributed information design methodology. By following this methodology several information systems were developed in close collaboration with practitioners. As well as reviewing the corresponding literature, the author visited several asphalt paving projects in The Netherlands to observe compaction teams at work. A number of discussions with practitioners took place to elicit their needs and the solutions they envisioned. These communications took place through the existing collaboration between University of Twente and the industry network ASPARi (Asphalt Paving Research & Innovation) formed by the main Dutch contractors who provided in-kind support to the project and granted access to a number of asphalt paving projects to test prototypes of the developed information systems. Additionally, the author presented research progress and intermediate outcomes to the contractors from the ASPARi network.
155
Without the collaboration of the ASPARi members, this research would not have resulted in the insights and methods derived in this thesis. The collaboration not only made this research possible, but also greatly improved it. In particular, it was the short loop of developing, implementing, testing, and discussing specialized information systems with practitioners that allowed to troubleshoot and improve the systems rapidly, as well as quickly identify the needs of information system users in a structured way. Furthermore, the iterative way of developing and improving prototypes helped facilitate interactions with the practitioners and identify their requirements. These aspects confirm that the ethnographic-action approach combined with human-centered distributed information design methodology is well-suited to supporting the development and implementation of prototypes of specialized information systems. At the same time, it was also noticed that the method has some limitations in relation to its scope and trying to apply the iterative procedure to develop larger systems could be problematic. For instance, several stakeholders expressed their strong interests in studying specific aspects of the compaction process and indicated their desire to investigate particular methods. At times, the desired research directions were misaligned with each other and led to the need to invest additional effort in discussing and aligning the main objectives of the study and establishing ways to reach them. Therefore, if sophisticated information systems were sought by collaboration with multiple different specialists, the need to align a multiplicity of opinions and priorities that can delay the delivery of the solutions must be taken into account. Another aspect related to the use of the methodology concerns the way the author dealt with the complexity of the task at hand. To manage questions related to the complexity and diversity of methods the adopted delineation of data visualization steps was clearly of help. The differentiation between the steps allowed meaningfully discussion of the needs of the information system users. Also, the sequence of steps fostered considerations relating to data storage, logic, and representation aspects of the methods. In this way, the complexity of the task at hand was kept on a level manageable by one researcher. Nevertheless, if more than one system developer were involved in developing specialized solutions, or if larger solutions were to be developed, the iterative reconsideration of stakeholders’ needs could become unfeasible. In this case, carefully documenting design decisions made during the system development would become critical. As a result, at a specific level of complexity the flexibility of the methodology could require following a more structured systems development process than the methodology we adopted provides. For instance, it might be necessary to compare and evaluate several alternative solutions alongside each other. Overall, the chosen approach was adequate for this study as has been demonstrated by the success in developing the methods and the information systems described above.
156
6.4 Limitations and suggestions for future research In spite of the fact that advances in sensing technologies and the construction informatics domain clearly can assist improving the way we can represent construction processes, the methods to inform multiple stakeholders about equipment trajectories in context are not yet fully developed. This research contributes to the domain by suggesting several methods to arrange data visualizations to inform multiple different stakeholders about the construction process based on their needs. These methods enable roller operators and other construction specialists to be informed better about the initial temperature distribution of the asphalted layer. Also, the methods suggest how to arrange a VE to represent already-conducted and also experiment with alternative equipment trajectories in the temperature context. The described methods have their specific characteristics and each holds its own potential for improvement. This section discusses the methods together with limitations of this study and future research directions.
6.4.1 Characterizing the developed methods Chapters 2–5 of this thesis describe several methods that account for different steps of a generic data visualization workflow. These methods have several specific characteristics. Some methods are more suited for automated data processing to support close to real-time information management. Others are more oriented towards interactive data processing that account for human reasoning. Specifics of the suggested methods are summarized in Table 1. As mentioned, in addition to addressing specific data visualization steps, the developed methods also contribute to the understanding of how to tackle larger challenges. For instance, the whole set of methods enables specific visualization environments to illustrate equipment trajectories in context, as demonstrated in chapter five. Thus, the methods to acquire, process, and represent sensor readings complement each other.
157
Table 1. Specifics of the suggested methods Characteristics of the methods
Chapter 2: Method for data acquisition
Chapter 3: Method for data processing (context)
Chapter 4: Method for data processing (trajectory)
Chapter 5: Method for representing context and trajectory
Practical suggestions related to
Organizing data acquisition and management to track compaction processes
Reconstructing asphalt temperature distribution as context of compaction
Refining equipment trajectories
Representing trajectories in context and fostering experimenting with alternative trajectories
Dependence(s) on methods described in this thesis
Data management is aligned with envisioned specific needs of different stakeholders
The methods deal with data collected with the help of the data management framework proposed in chapter two
Suggested VEs rely on data acquired and processed according to chapters 2–4
Degree of user involvement
Automated data collection and management, with possible human involvement to manage data after the completion of the project
The method relies on an automated data processing procedure
The method implies significant involvement of human reasoning into data processing
The method supports humancomputer interactions to represent actual and experiment with alternative equipment trajectories in context
Elements of domain-specific knowledge the methods concern
Understanding needs of stakeholders involved in asphalt compaction
Known specifics of the process how the asphalt layer is constructed
Known specifics of equipment trajectories during construction
Knowledge of equipment operators where to direct their equipment with respect to the project context
Expected conditions to use the methods
In close to real-time mode and after the completion of the project; both onand off-site
In close to realtime; on-site
Primary users of the systems
Equipment operators, managers, strategic decision makers
Equipment operators on-site; quality control personnel
158
After the project is completed; off-site
Data processing experts
Operators and other specialists participating in feedback and education sessions
One main characteristic of the methods concerns the degree to which we involve humans into the interactions with information systems that illustrate the methods. The type and amount of these interactions differ because of the envisioned use of the methods. In other words, the methods were designed to work primary either in close to real-time mode or after the completion of the construction project. As a result, the methods for automated data acquisition and processing described in chapters two and three use some knowledge encoded into data processing procedures. In contrast, the method suggested in chapter four implies a significant degree of user involvements. A human expert filters outliers in documented equipment trajectories by interacting with the software that operates according to the method. Finally, chapter five suggests a method that is oriented explicitly towards interactions with users. Acquired and processed data are represented to paving specialists who can consider real and alternative equipment trajectories for specific contexts. A VE developed according to the method is expected to assist roller operators and other specialists in discussing their understanding about adequate compaction strategies. In some sense, such visualization environment serves as a mediator to support knowledge exchange between the specialists. Although the suggested methods differ in their characteristics, they can be combined in a number of ways and can be tuned to a desired level of human involvement. In other words, the methods can be aligned by adjusting their computation elements and reducing (or increasing) the amount of human involvement. In one example, the path filtering method suggested in chapter four can be implemented in a more automated manner. This implementation, if incorporated within close to real-time systems, can aid roller operators on-site to review their previous trajectories and trajectories of other operators with improved precision. This adjustment is possible because the methods differentiate between the domain-specific knowledge and the knowledge of construction informatics. Altogether, the archival value of this thesis lies not only with respect to individual solutions, but also in systematic coverage of different steps of the data visualization workflow. These steps were covered from different perspectives by considering both the knowledge of construction informatics and domain-specific knowledge. In the case of this thesis, the domain-specific knowledge is related to the asphalt compaction process. At the same time, the proposed methods are applicable not only to asphalt compaction, but also to other construction processes. This was demonstrated by applying the described filtering method to eliminate outliers in trajectories of earthmoving equipment. In more detail, the possibilities to reuse the methods are described next.
159
6.4.2 Envisioned use of methods beyond the scope of asphalt compaction The questions how to address demands of construction processes by applying sensors and information technologies currently are highly relevant within many construction fields. The methods depicted in this thesis are mainly oriented to inform stakeholders involved in the asphalt compaction process. Even though this process is relatively specific, it also highlights some distinctive aspects of construction activities in general. Similar to the compaction process, multiple other construction processes nowadays rely heavily on specialized equipment. Therefore, the outlined methods could be projected on a larger scale. This subsection briefly portrays some possible applications of the developed methods within the asphalt paving in other larger domains. With respect to asphalt paving, the documented trajectories of rollers and pavers onsite may inform quality control tasks. These tasks include aligning on-site processes with the processes at asphalt plants. For instance, an advanced quality assessment procedure built upon the documented initial temperature distribution can evaluate if the chain of asphalt production-transportation-laydown operates in a satisfactory way. In addition to solving this practical task, aligning on-site activities and research conducted in asphalt labs might provide suggestions for a number of future developments in the domain. With this connection established, the information about the processes can assist in improving methodologies to test lab specimens. In a complementary way, such connections can suggest novel working methods of how to operate in the field. Altogether, aligning information technologies, operators' knowledge, and laboratory practices is needed to professionalize the asphalt construction process [Bijleveld, 2015]. On the scale of infrastructure manufacturing, longitudinal construction projects could also benefit from the findings described in this thesis, as some characteristics of the longitudinal projects are similar to the asphalt compaction process. For instance, the tasks of preparing the base for asphalt paving or improving underground communications imply that equipment locations change together with the location of the construction site. Given similarities between these types of construction activities, this thesis can be seen as a case study of developing methods to acquire, process, and represent sensor readings for longitudinal construction projects. The first illustration of employing the methods to other construction processes was demonstrated in chapter four, where the illustrative information system was applied to filter trajectories of earthmoving equipment. The developed methods could be of use, after some modifications, to the needs of the construction industry in general. For instance, the “context-actions-impact” classification framework proposed in chapter five can help quantify both actions and trajectories of workers and equipment. Such classification can contribute to the tasks of acquiring,
160
processing, and presenting sensor readings that characterize the progress of individuals and teams. Finally, the described methods can provide information about the process of road construction to an audience not directly involved in the construction process. For instance, the users of the road network system can benefit from having up-to-date information if the road is opened or closed for traffic. Such information is clearly beneficial for both emergency services and the general public. As one possibility, the corresponding information flows can be organized with the help of specialized infrastructure-to-vehicle communications. In this way, the integration of the construction process-related information can benefit larger systems. Ultimately, the information flows organized with the help of the suggested methods can be integrated into communication channels of large-scale systems. These solutions can operate, for instance, on the level of smart cities.
6.4.3 Limitations and future research This thesis suggests several novel methods to acquire, process, and represent sensor readings to track and analyze construction equipment trajectories in the context of temperature distributions. Several design decision were made to develop these methods and to maintain the level of complexity of the research and its scope at a manageable level. These decisions impose several limitations. The research concentrated on the tasks of roller operators and, to a lesser extent, on tasks of other construction specialists. These asphalt construction professionals act according to the context of the process, which is largely determined by the temperature of the distributed asphalt layer. By concentrating on the asphalt temperature, other important context factors (such as layer thickness and subgrade support) were left out of the scope of this research. The introduction of additional factors will require much greater consideration of the interrelations between the factors. The methods should be elaborated to take into account these interrelations. Also, because research efforts were largely concentrated on developing suggestions as to how to address existing practical needs, the topic of assessing the developed solutions was less studied. Future research can improve the developed methods and provide additional understanding as to how information systems based on the suggested methods can be adopted and used.
Envisioned improvements of the suggested methods Clearly, all steps of the data visualization workflow (including acquiring, processing, and representing of the relevant data) cannot be fully covered by the proposed methods alone. Because stakeholders require diverse information beyond what was considered in this thesis, the outlined methods and systems clearly can be improved. 161
Accounting for additional sources of data and information can be advantageous. In this regard, extra sensors that track the trajectories and context can be integrated together with some additional information sources. For instance, in the case of data acquisition, the incorporation of additional sources could increase the accuracy and precision of the documented process parameters. As one example, additional sensors could document if a roller operator employs special techniques during the compaction process. These sensors can track if the operators compact in a crab-walk manner or apply drum vibrations. This thesis illustrates how data processing methods can benefit from capturing domainspecific knowledge and incorporating this into the data processing procedures. Therefore, deriving data processing rules from the domain-specific knowledge appears to be a rewarding task. Advanced understanding of the experts’ reasoning can be achieved through gathering and formulating specific sets of the rules. The identified sets of rules can ultimately form a “library”, oriented to re-use these sets within diverse specialized information systems. These libraries can assist in solving practical problems in closely-related domains. A structured approach to capture experts’ knowledge could help to differentiate between specific elements of knowledge, highlight causal links within them, differentiate overall and situated knowledge, and facilitate knowledge sharing. As an example, sets of rules addressing data processing needs of the asphalt paving domain can be reused for earthmoving operations or infrastructure manufacturing projects. In terms of a function modeling methodology for integrated computer aided manufacturing (IDEF0), such sets of rules can be seen as mechanisms of data processing tasks. The rules can guide the development of data visualization solutions. The identified rules could improve semi-automated solutions and also move such solutions towards more automated computing, which demands less human attention. Therefore, according to the envisioned benefits, additional research related to the identification and application of specific data processing rules can be suggested. The task of representing the processed data also calls for additional improvements. For instance, during this research project it was noted that roller operators and other construction specialists search for ways to quickly assess long-lasting compaction processes. The construction professionals attempt to relate equipment trajectories to multiple factors to get a brief on how specific parameters change within specific time and spatial frames. This task raises the demand for studying what indicators (or sets of indicators) can assist in prompt analysis of time-consuming construction processes. Additional research might show how these specific needs of the construction process stakeholders might be supported with the help of an adjustable and interactive system of indicators encompassing statistical data analysis.
162
Future research on the use of solutions developed according to the proposed methods According to the reasonable expectations described in the introduction, specialized visualizations can both support everyday work of asphalt compaction operators (and other construction specialists) and assist in studying construction processes. This thesis describes methods to address the corresponding challenges and specially developed information systems to illustrate these methods. However, the developed information systems only demonstrate the practicality of the methods, whilst the study of the practical use of these solutions remains outside of the research scope. Even though providing opportunities for practitioners to get insights into construction processes can indeed lead to re-adjusting their working practices, the adaptation of specialized information systems is not expected to be flawless. One reason that can hamper an adaptation is that roller operators could feel uncomfortable with adopting an innovation. However, the author noticed during this research, that asphalt compaction operators and other construction specialists also are eager to improve their practices. Therefore, the adaptation of novel solutions appears to be a controversial topic. Longitudinally studies could examine the adoption pathways of specialized information systems. Future research is needed to search for the point of balance where the tasks of construction specialists can be supported effectively by ongoing advances in information technologies, in general, and data visualizations, in particular. Clearly, this thesis provides both novel insights and a stepping stone for future research in this direction. This thesis describes several methods how to address practical needs of construction specialists by meaningfully combining knowledge from domains of asphalt paving and construction informatics. In this way, the thesis builds upon and contributes to the domain of construction informatics.
6.5 References Behzadan, A. H. (2008). "ARVISCOPE: Georeferenced Visualization of Dynamic Construction Processes in Three-Dimensional Outdoor Augmented Reality." Ph.D. Dissertation, University of Michigan. Bijleveld, F. R. (2015). “Professionalising the asphalt construction process: aligning information technologies, operators' knowledge and laboratory practices.” Ph.D. Dissertation, University of Twente. Bijleveld, F. R., A. Vasenev, T. Hartmann (2011). "Smoothing GPS data of rollers to visualize asphalt paving operations." in: Proceedings of European Group for Intelligent computing in Engineering (EG-ICE) workshop in June 2011, University of Twente, The Netherlands: 1-8. 163
Caron, F., E. Duflos, D. Pomorski and P. Vanheeghe (2006). "GPS/IMU data fusion using multisensor kalman filtering: Introduction of contextual aspects." Information Fusion 7(2): 221-230. Chen, Y. and J. M. Kamara (2011). "A framework for using mobile computing for information management on construction sites." Automation in Construction 20(7): 776788. Glee, K. C., D. R. Potts, P. T. Corcoran and T. L. Rasmussen (2012). "Paving system and method." US patent, publication number US8099218 B2, publication date Jan 17, 2012. Gonzales, V. and T. Echaveguren (2012). "Exploring the environmental modeling of road construction operations using discrete-event simulation." Automation in Construction (24): 100-110. Herrera, E. P., H. Kaufmann, J. Secue, R. Quirs and G. Fabregat (2013). "Improving data fusion in personal positioning systems for outdoor environments." Information Fusion 14(1): 45-56. Leung, S.W., S. Mak and B. L. Lee (2008). "Using a real-time integrated communication system to monitor the progress and quality of construction works.", Automation in Construction 17(6): 749-757. Miller, S. R., T. Hartmann and A. G. Dorée (2011). "Measuring and visualizing hot mix asphalt concrete paving operations." Automation in Construction 20(4): 474-481. Peyret, F., J. Jurasz, A. Carrel, E. Zekri and B. Gorham (2000). "The computer integrated road construction project." Automation in Construction 9(5–6): 447-461. Pradhananga, N. (2014). “Construction site safety analysis for human-equipment interaction using spatio-temporal data.” Ph.D. Dissertation, Georgia Institute of Technology. Swaner, K. (2010). "The PAVE-IR System: Detecting Thermal Segregation and Much More." HMAT: Hot Mix Asphalt Technology, 15(6): 52 -54. Teizer, J., T. Cheng and T. Fang (2013). "Location tracking and data visualization technology to advance construction ironworkers' education and training in safety and productivity." Automation in Construction 35: 53-68. Turkiyyah, G. (2007). "Final Technical Report TNW2007-03, SIMPAVE: Towards Building Interactive Simulations for Planning." http://www.lib.washington.edu/Msd/norestriction/b60940657.pdf, last retrieved December 2014.
164
Publications produced within this research trajectory Journal articles Vasenev, A., T. Hartmann and A. G. Dorée (2014). "A distributed data collection and management framework for tracking construction operations." Advanced Engineering Informatics 28(2): 127-137. Vasenev, A., N. Pradhananga, F. R. Bijleveld, D. Ionita, T. Hartmann, J. Teizer and A. G. Dorée (2014). "An information fusion approach for filtering GNSS data sets collected during construction operations." Advanced Engineering Informatics 28(4): 297-310. Vasenev, A., T. Hartmann and A. G. Dorée (submitted for review). "A method to inform roller operators about their working context: reconstructing geometries and interpolated initial temperature distributions of asphalted layers." Vasenev, A., S. R. Miller, T. Hartmann and A. G. Dorée (submitted for review). "Organizing interactive visualization environments to represent documented and experiment with alternative construction equipment trajectories in context."
Peer-reviewed conference papers Vasenev, A., T. Hartmann and A. G. Dorée (2014). "An architecture for reviewing conducted collaborative operational strategies and exploring alternatives in virtual environments: the case of asphalt compaction." in: International Conference for Computing in Civil and Building Engineering (ICCCBE), Florida, USA. Vasenev, A., D. Ionita, F. R. Bijleveld, T. Hartmann and A.G. Dorée (2013). "Information fusion of GNSS sensor readings, field notes, and expert’s a priori knowledge. " in: The 20th International Workshop on Intelligent Computing in Engineering (EG-ICE), Wien, Austria. Vasenev, A., T. Hartmann and A. G. Dorée (2013). "Developing a virtual reality tool to explicate tacit knowledge of machine operators." in: The 30th International Symposium on Automation and Robotics in Construction and Mining (ISARC), Montreal, Canada. Vasenev, A., T. Hartmann and A. G. Dorée (2012). "Prediction of the in-asphalt temperature for road construction operations." in: ASCE International Conference on Computing in Civil Engineering, Florida, USA.
165
Vasenev, A., F. R. Bijleveld, T. Hartmann and A. G. Dorée (2012). "A real-time system for prediction cooling within the asphalt layer to support rolling operations." in: Eurasphalt & Eurobitume Congress, Turkey. Vasenev, A., T. Hartmann and A. G. Dorée (2012). "Multi-user interactive visualization of asphalt paving operations." in: 9th European Conference on Product and Process Modeling, Iceland. Vasenev, A., F. R. Bijleveld, T. Hartmann and A. G. Dorée (2011). "Visualization workflow and its implementation at asphalt paving construction sites." in: joint CIB W078-W102 2011 conference, France. Bijleveld F. R., A. Vasenev, T. Hartmann and A. G. Dorée (2011). "Real-time and post processing of GPS data in the field of visualizing asphalt paving operations.” in: European Group for Intelligent Computing in Engineering (EG-ICE) Workshop, Enschede, The Netherlands.
Professional publications Sluer, B. W., D.W. Aalbers and A. Vasenev (2014). "Risico’s van afwijkingen in asfaltproces te kwantificeren?" (On quantifying risks of deviations during asphalt paving process), Congress CROW, Ermelo, The Netherlands. Vasenev, A., T. Hartmann and A. G. Dorée (2013). "Paving in the clouds, development of information systems to support asphalt paving process." ConcepTueel, 21 (5). Bijleveld, F. R., A. Vasenev, A. G. Dorée and T. Hartmann (2012). "Aspari is for paving, network to professionalise the paving industry." ConcepTueel, 21(1).
Other Vasenev, A., T. Hartmann and A. G. Dorée (2013). EU patent application “Real-time method for automated prediction of internal layer temperature of paving material during paving operations”, EP 2666908 A1, publication date Nov 27, 2013. Status: European patent pending, Dutch patent granted.
166
About the author Alexandr Vasenev graduated with MSc-equivalent Diploma specialist degrees as Systems Engineer (with a specialization in Software of Computer Facilities and Automated Systems) and as Electro-Mechanical Engineer (with a specialization in Electrical Engineering). In 2005 he received a Candidate of Engineering Science degree from the State Textile Academy in Ivanovo, Russia. Afterwards, Alexandr lived, worked, and traveled in Russia, China, Germany, and Romania. During that time, Alexandr worked in a large multidisciplinary EU-funded FP6 project and also conducted several individual research projects. In 2011–2015 Alexandr conducted the research described above at the Construction Engineering and Management group at the University of Twente, the Netherlands.
167