Serbian Project Management Journal Volume 6
Issue 1
November 2016
CONTENTS ADAM SOFRONIJEVIĆ, VESNA MILIĆEVIĆ and DEJAN PETROVIĆ Merging Science and Arts for Successful European Projects ABDELNASER OMRAN, OLOJOTUYI BAMIDELE and AMIR BAHARUDDIN Causes and Effects of Incessant Building Collapse in Nigeria
HUSSIN
B.
SAMED KAROVIĆ, GORAN RADOVANOVIĆ and HAJRADIN RADONČIĆ Project Management Approach to Stabilization of Post-Crisis BENEDICT AMADE Barriers to the Implementation of Supply Chain Management (SCM) in the Delivery of Construction Projects SLOBODAN MALBAŠIĆ, LJUBIŠA TANČIĆ and VELJKO PETROVIĆ Technology Risk Assessment as Part of Risk Management Process DRAGAN BJELICA, ZORICA MITROVIĆ and DANIJELA TOLJAGA-NIKOLIĆ Project Portfolio Management Maturity Aspects in Web Based Environment BENEDICT AMADE Application of Akpan’s Method in Optimum Resource Usage in Construction Projects: A Multiple Resource Case MARIJA TODOROVIĆ and MILICA PAVIĆEVIĆ Bridge the Gaps, Retain the Talented Millennials
The Journal of YUPMA - Serbian Project Management Association
SERBIAN PROJECT MANAGEMENT JOURNAL Volume 6, Issue 1 November 2016 Publisher: Serbian Project Management Association -YUPMA Editor in chief: prof. Vladimir Obradović, PhD, University of Belgrade, Faculty of Organizational Sciences; International Project Management Association Education and Training board member Honorary editor: Prof. Petar Jovanović, PhD, Educons University, Faculty of Project and Innovation Management, Belgrade Editor of domestic and international section: Prof. Marko Mihić, PhD, University of Belgrade, Faculty of Organizational Sciences Editor of special issues: Prof. Dejan Petrović, PhD, University of Belgrade, Faculty of Organizational Sciences Editorial board: Prof. Nino Grau, PhD, Fachhochschule Giessen-Friedberg University of Applied Sciences, Germany Prof. Brane Semolič, PhD, University of Maribor, Faculty of Logistics, Slovenia Prof. Vladan Devedžić, PhD, University of Belgrade, Faculty of Organizational Sciences, Serbia Prof. Mladen Radujković, PhD, University of Zagreb, Faculty of Civil Engineering, Croatia Prof. Kevin Kane, PhD, University of Salford, United Kingdom Vladimir Voropaev, Projects Management Faculty, State University of Management Sergey Bushuyev, Kiev National University of Construction and Architecture, Kiev, Ukraine Prof. Živan Živkovic, PhD, University of Belgrade, Technical Faculty in Bor, Serbia Prof. Evica Petrović, PhD, Faculty of Economisc, University of Nis Prof. Radoslav Raković, PhD, Energoprojekt ENTEL, Belgrade, Serbia Prof. Sandra Jednak, PhD, University of Belgrade, Faculty of Organizational Sciences, Serbia Technical editor: Danijela Toljaga-Nikolić
Journal will be available online at www.spmjournal.rs twice a year.
CONTENTS Merging Science and Arts for Successful European Projects Adam Sofronijević, Vesna Milićević, Dejan Petrović Causes and Effects of Incessant Building Collapse in Nigeria Abdelnaser Omran, Olojotuyi Bamidele, Amir Hussin B. Baharuddin Project Management Approach to Stabilization of Post-Crisis Samed Karović, Goran Radovanović, Hajradin Radončić Barriers to the Implementation of Supply Chain Management (SCM) in the Delivery of Construction Projects
13
27
37
Benedict Amade Technology Risk Assessment as Part of Risk Management Process Slobodan Malbašić, Ljubiša Tančić, Veljko Petrović Project Portfolio Management Maturity Aspects in Web Based Environment Dragan Bjelica, Zorica Mitrović, Danijela Toljaga-Nikolić Application of Akpan’s Method in Optimum Resource Usage in Construction Projects: A Multiple Resource Case
51
63
71
Benedict Amade
Bridge the Gaps, Retain the Talented Millennials Marija Todorović, Milica Pavićević
ISSN 2217-7256 (Online)
3
81
WORD OF THE EDITOR
Serbian Project Management Journal is a journal presented by the Serbian Project Management Association – YUPMA, who had launched this publication on the occasion of its 25th anniversary. This specialized journal has been presenting the most recent knowledge and best practice in the field of project management and other management disciplines. So far, many authors from more than 15 countries have recognized Serbian Project Management Journal as a vital reference in their academic or professional career. Most of the articles are based on research undertaken by scholars and specialists in the field. In addition to research articles, the Journal publishes commentaries, researches in brief, and book reviews. The Journal is deposited in the Serbian National Library and is recognized in Serbian Citation Index, Google Scholar, and Research Gate. In the time to come, the editorial team will pay particular attention to indexing Journal in other scientific databases. It is our genuine wish to continue further contribution to the project management development and implementation in Serbia through publishing latest achievements and research in the field.
Editor in Chief Prof. Vladimir Obradović, PhD
2
Serbian Project Management Journal, Volume 6, Issue 1, November 2016
MERGING SCIENCE AND ARTS FOR SUCCESSFUL EUROPEAN PROJECTS Adam Sofronijević1, Vesna Milićević2, Dejan Petrović3 1 University library, University of Belgrade, Serbia 2,3 Faculty of Organizational Sciences, University of Belgrade, Serbia Abstract: The paper highlights various ways in which science and arts are interrelated in contemporary business environment characterized by high competitiveness and dominant importance of creativity for new business ventures. Importances of arts as a capable influencer of a scientific success are depicted along with some examples of science and arts interaction in project environment. Several European projects connecting sciences with arts are presented along with some of the more important aspects of these projects. Key words: Arts, Creativity, European projects, Project management, Science 1. INTRODUCTION Keeping the great pace of science and technology progress inevitably dictates finding shortcuts to foster innovativeness and breakthroughs. One such shortcut that has been looked up to lately is phenomena of serendipity. Fostering of serendipity and creating conditions for it to occur has been high up on agenda of planning of scientific projects and research processes (Murayama, Nirei & Shimizu, 2015; Pallot, Alishevskikh, Krawczyk & Holzmann, 2014). Another technique that is often times implemented is getting inspiration based on works of arts. Inspiration that arise in arts and is applied in science may be also depicted as a kind of serendipitous experience, but also as a special phenomena that besides application of a specific idea in another area calls for a more general approach that arts need in order to invoke inspirational moments that are often so elusive. The relations between the arts and science can also go the other way around and artists may find exceptional inspiration in scientific results, or can use scientific tools, results or processes as artistic tools to express their creativity. Often contemporary projects tend to merge either of these approaches and reach for a useful relation between science and arts that can add value to both processes or increase impact of their results. Although at the first glance very different arts and science share some similarities. J. Schmidhuber even goes so far to claim that Corresponding author. Email:
[email protected] ISSN 2217-7256 (online) © 2016 YUPMA www.spmjournal.rs
scientists are very much like artists because they actively select experiments in search for simple laws compressing the observation history. He claims further that the creativity of painters, dancers, musicians, pure mathematicians, physicists, can be viewed as a mere by-product of our curiosity framework based on the compression progress drive and that all of them try to create new but nonrandom, non-arbitrary data with surprising, previously unknown regularities (Schmidhuber, 2009). An illustrative example of possibilities when merging science and arts is presented in figure 1. A construction plan of the image of a butterfly and a vase with a flower is presented in figure 1 as reprinted from Leonardo. As stated by J. Schmidhuber the plan is based on a very simple algorithm exploiting fractal circles. The frame is a circle; its leftmost point is the center of another circle of the same size. Wherever two circles of equal size touch or intersect are centers of two more circles with equal and half size, respectively. Each line of the drawing is a segment of some circle, its endpoints are where circles touch or intersect. There are few big circles and many small ones. In general, the smaller a circle, the more bits are needed to specify it. The drawing is simple as it is based on few, rather large circles. Many human observers report that they derive a certain amount of pleasure from discovering this simplicity (Schmidhuber, 2009). 3
A. Sofronijević, V. Milićević, D. Petrović
Figure 1: Construction plan of the image of a butterfly and a vase with a flower, reprinted from Leonardo, (Schmidhuber, 2009, 28) J. Schmidhuber also provides an example for his claim on scientists and artist being alike by stating that many physicists invent experiments to create data governed by previously unknown laws allowing to further compress the data and that on the other hand, many artists combine well-known objects in a subjectively novel way such that the observer’s subjective description of the result is shorter than the sum of the lengths of the descriptions of the parts, due to some previously unnoticed regularity shared by the parts (Schmidhuber, 2009). Differences and similarities between artists and scientist have been also analyzed by G. Feist who suggests that differences as well as similarities exist between the thought processes of art and science students during the insight phase of problem solving. By investigating the nature of these thought processes at different time periods throughout the creative process he discovered that half of the subjects solved tasks corresponding to their orientation, and the other half solved problems not of their orientation. This finding suggests that a differentiated view of the thought processes involved in artistic and scientific creativity is needed (Feist, 1991). Having in mind the similarities and differences of artists and scientists and of arts and sciences in general as human endeavors the analysis of complementary powers of these two broad areas of human activities as important influencer of contemporary business environment will be presented. 4
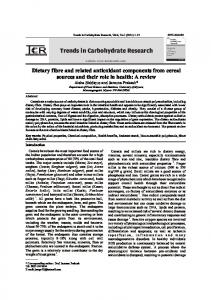
2. SCIENCE AND THE ARTS AS COMPLEMENTARY FORCES IN CONTEMPORARY BUSINESS ENVIRONMENT Importance of arts for general state of mind of scientists has been long observed in practice, both by scientists themselves and by general public interested in this topic. As early as 1878 the first winner of Noble Prize in chemistry J.H. van’t Hoff proposed that scientific imagination is correlated with creative activities outside science. A more recent study (Root-Bernstain, et al., 2008) provide some more concrete evidence on this with art avocations of scientist being positively related to their general success in science as depicted in Figure 1. Even with these relations clearly noticed and studied to some degree often times science and arts are seen as even opposing because of the different approaches to reality. Science deals with our real world and arts deal with possible worlds, i.e. the product of science is an objective result while arts produce subjective accomplishments. Lately this approach has been also challenged on notion that arts and science compose a continuum and that looking at our real world in a different way may be of crucial importance for achieving scientific breakthroughs (RootBernstein, 2003). Many scientists actively engage in arts and the most numerous group are scientists-musicians. Evolution researcher G. Griffin is fronting the world famous rock
Serbian Project Management Journal, Volume 6, Issue 1, November 2016
band Bad Religion, M. Aukerman the plant geneticist is a lead singer for Los Angeles based punk band Descendents and many other scientists around the world are performing either popular, or classical music to find long lasting inspiration and short term satisfaction in playing by themselves their favorite tunes.
Their general experience is that hours even sometimes days after the successful performance inspirational moments come that allow them to approach experiments in a different way, think of a better suited hypotheses or put together a more sensible research project proposal (Kaplan, 2014)
1 0.9
Average Numebr Avocations
0.8 0.7 0.6 0.5 0.4 0.3 0.2 0.1 0 Sigma Xi
US Public
Royal Society
NAS
Nobel
Groups of scientists
Figure 2: Average number of any art and crafts avocation per group: Honored scientists, Sigma Xi members and U.S. public, (Root-Bernstain, et al., 2008, 54) Relations between arts and science have been looked up more closely in recent years and connections allowing arts to influence science have been established in many scientific fields. Relations between neurology and music as well as theoretical physics and general chemistry and various arts have been pinpointed so far (Charyton, 2015). Some more detailed surveys have been conducted for those scientific fields in which results can be more readily applied and even transferred directly to industries. These studies showed that different art forms either being actively preformed or passively consumed by scientists have positive impact on research process and general scientific activities in engineering, sciences, technology and mathematics by increasing creativity in approaching problems and more numerous innovation and advancement of certain specific aspects of scientific work (Charyton, 2015a). It is especially interesting to look into details of relations of arts and science in area
of patents where it has been shown that scientist and innovators who register patents engage in artistic expression or are enjoying arts as spectators more than average citizens and number of patents registered is positively related to innovators’ artistic engagement. On top of this relevant data show that innovators themselves expressed their belief that arts make an important part of their inspiration and that of special importance is long term artistic stance (LaMore, et al., 2013). The relations between science and arts is complex and this may be very well comprehended when one consider boundaries dividing these two areas of human endeavor. It is often times that researchers who looked into this described the boundary as blurry and even same materials can be presented and consumed both as scientific and artistic depending on the audience, context and aims of their presentation (Galison & Jones, 2014). One interesting example of activities that
5
A. Sofronijević, V. Milićević, D. Petrović
combine and mesh up artistic and scientific approach is a decade long program involving presentation of scientific results in artistic form in these areas where it is of special importance to invoke the interest of broad public such as global worming, alternative energy sources or stem cell research (Schwartz, 2014). In line of implementation of this program excellent results in rising general public interest in sciences have been achieved in those areas that are generally considered not too exciting or even plain dull by presenting scientific results and outcomes in the form of theatre play or opera performance. It is important to highlight the value of relations between science and arts in these areas that may be labeled as especially important for society development such as top scientific research and harmonious, productive development of social relations between different social groups. Latest research has shown that productivity in science and embracing of new ideas in the group of top scientist is related to scientific creativity spurred and guided by artistic impressions bestowed upon scientist by artists in different art fields (Charyton, et al., 2014). Relations have also been established between intensity of scientific research and artistic expression and the number of innovations and development of democratic social relations that allow for free trade, transparent markets and free movement of people, capital and business ideas such as the case in most regions of Europe (Carayannis & Campbell, 2014). Educational processes, especially related to institutions of higher education and expert learning are important venue for presenting results of scientific research, but can also be a significant source of data and point of interest of researchers seeking to explain these processes and improve them. In both cases creativity and inspiration are regarded as a must for achieving efficiency in these activities. Creativity steaming from overlapping scientific and artistic activities is of special importance to educational processes and those involved in any way with them. Up to date research shows that if creative methods are applied and creativity in general encouraged in both professors and students 6
independence and autonomy of scientific thinker who solves problems and thinks divergently is fostered and often times achieved (Clements, 2014). In the area of heritage institutions such as museums merging of arts and science can be defined as very fruitful and numerous around the globe. The most recent example is Museum of Tomorrow in Rio de Janeiro opened for public in December 2015. A futuristic shaped museum building worth 59 million dollars provide a hint for sublime mix of art and science that deals with divisive and contentious topic of changes needed in order to avoid climate disaster and social collapse. The main museum exhibition is almost fully digital and is centered arround ideas, not following the usual museum discourse of exhibiting objects. It deals with ultimate questions that science aims for shading light on, but only arts can provide inspiration of solving such as where do we come from and where are headed as a human species. A 200 meters long exhibition hall provides décor and inspiration for castors immersing in specific digital mix of arts and science aimed at providing inspiration, not only education for bringing the best out of visitors in providing long term solutions to ultimate questions we face today. Museum entrance provides masterpiece short movie by famous movie director F. Meirelles dealing with 13.7 billion years of geological history in under eight minutes of pure artistic expression (Watts, 2015). This is followed by master pieces after master pieces presenting individual expressions on flux of matter, connectedness of life within and without our bodies, human relationship and culture, followed by a central exhibition space featuring huge Stonehengelike digital screens displaying artistic work dealing with Anthropocene an era in which mankind has become a geological force able to shape the very planet it inhabits. The museum has partnered with top universities from Brazil and internationally in order to provide sound scientific basis for its exhibitions. Although the one of the newest and one with a specific approach to exhibition design, Museum of Tomorrow in Rio de Janeiro is not the only one, but just one among numerous
Serbian Project Management Journal, Volume 6, Issue 1, November 2016
museums worldwide merging science and arts in order to provide more inspiring approach to both areas of human endeavor to general public. The importance of museums and other heritage institutions in providing inspiration, learning and general basics for developing all kind of human endeavor including business ones, has been always acknowledged by generous donations of those who have been successfully inspired at the beginnings of their careers and who wished to give back a fraction of what they got to future generations of entrepreneurs and business leaders. One of the museums cultivating such an approach with strong emphasis on leraning and creativity is Museum of Applied Arts and Sciences in Sydney, Australia. This museum prides itself being the contemporary museum for excellence and innovation in applied arts and sciences and hosts almost half a million of separate items most of which have been acquired through generous donations of those who have the sensitivity for importance of science and arts providing helping hand to each other in bringing the best out of humanity and playing vital role in creating influential environment for business (Museum of Applied Arts and Sciences, n.d.). Similar to this museum one can marvel also at achievements and inspiration provided to local and global communities by several other museum merging arts and sciences such as The International Museum of Art and Science in Texas, USA that provide opportunities for visitors to participate in hands-on science exhibits and learn original works of art while encouraging creativity and innovation (The International Museum of Art and Science, n.d.). Another USA based museum that provides leadership in providing creative business environment in local community is Museum of Arts and Science from Georgia. This museum perceives its Vision as being a resource for life long learning and enrichment that engages a diverse audiences by presenting objects and experiences designed to evoke wonder, stimulate curiosity and open minds to new world of discovery (Museum of Arts and Sciences, n.d.). Finally it is worth mentioning Artscience museum from Singapore that stands out even among top world heritage institutions. This museum explores creative processes at the heart of art, science, technology and culture and their processes in
shaping contemporary societies. The museum holds blockbuster international exhibits across 6.000 square meters of exhibition floors striving to illuminate the processes merging arts and science and their far-reaching influence in the world we live in (Artscience museum, n.d.). Rich experience provided by exhibitions merging artistic expression and scientific methods and approaches ground basis for more innovative and creative societies. The sheer number of such exhibits and even more importantly their innovativeness and stunning boldness in researching themes and providing relations between these two fields of human endeavor prove the importance of collaboration between scientists and artists in bringing forth more inspiring environment for everyone. Illustrative examples that follow provide insight into range of topics and models of collaborations existing today. This year at Smithsonian Museum of Natural History at Washington, D.C. in USA artist Cornelia Kubler Kavanagh and biological oceanographer Gareth Lawson bring the plight of tiny ocean pteropods—or “sea butterflies” —to light with larger-than-life sculptures. The artworks of 23 artists who were selected from more than 100 entrants from around the world for this year’s scienceinspired exhibition about biodiversity and extinction will be exhibited at New York Hall of Science in New York, USA. Yale dermatologists Jean Bolognia and Irwin Braverman present the celebrated nineteenth century illustrations to a current clinical audience, making a relevant teaching point with each plate as a part of the exhibition Historical Illustrations of Skin Disease: Selections from the New Sydenham Society Atlas 1860-1884 presented at Cushing/Whitney Medical Library Sterling Hall of Medicine at New Haven, USA. Artist and ocean advocate Courtney Mattison creates large scale ceramic installations and sculptures inspired by science and marine biology. Her intricate hand-crafted porcelain works exhibited at Virginia Museum of Contemporary Art in Virginia Beach, USA celebrate the fragile beauty of endangered coral reef ecosystems and promote awareness to conserve and protect our natural world (Monoyios, K, 2015). 7
A. Sofronijević, V. Milićević, D. Petrović
There are also numerous examples of activities and areas of collaboration in which arts and science provide a perfect match or synergy allowing for both artistic expression and scientific reasoning to get pushed ahead by one another. One such example comes from area of pigment identification on manuscripts, paintings or ceramics. This is critical in finding solutions to problems of restoration, conservation, dating and authentication in the art world and gives excellent results in respect of reproducibility, sensitivity, non-destructiveness and immunity to interference from adjacent materials (Clark, 2002). Even such processes as Charcoal Production can suffer from many different views coming from both managers and employees and are prone to improvement by combination of arts and science (Antal, & Grønli, 2003). Specific field of information roams on the intersections of art, science and technology providing interesting insights into each of these fields while preserving the multidisciplinary overreaching capacity in problem solving (Wilson, S. 2002). When contemplating influences between science and arts today it is important not to forget that throughout the human history this subject has been seriously contemplated by some of the most important minds in human history (Kemp, 2006). Influences of art and artistic expression on business directly and indirectly can be analyzed and discussed, but almost of the same importance can be the direct influence of artistic activities on start-ups and creation of local business. R. Phillips defines this as artful business and describes using the arts for community economic development. He claims that this is emerging as a viable approach and that the community development based on the arts is increasingly being recognized as a catalyzing force. He presents a typology of arts-based community development approaches and identifies distinctive forms such as arts business incubators, artists’ cooperatives, development of tourism venues and comprehensive approaches (Phillips, 2004). Finally we will discuss the emergent field of art-science. G. Born and A. Barry propose that this novel field is a part of a heterogeneous 8
space of overlapping interdisciplinary practices at the intersection of the arts, sciences and technologies and assert that the institutions supporting art-science invariably claim that art-science contributes to the ‘contextualization of science’ by rendering scientific and technical knowledge more accessible and accountable to its publics. At the same time G. Born and A. Barry state that such approach fails to capture the ways in which art-science exhibits its own complex trajectories, which cannot be grasped in terms of an epochal transition in the mode of knowledge production. They indicate the heterogeneity of art-science and suggest that art-science is instructive in highlighting radically divergent conceptions and practices of publicness not just simply multiplying the connections between science and its publics finally proposing that art-science can act not so much as a way of assembling a public for science, but as a public experiment (Born & Barry, 2010). 3. SCIENCE AND ARTS FUSION IN EUROPEAN PROJECTS Relations between science and arts in European regions is framed by stance of majority stakeholder groups to science and scientific approach to solving real life problems, but also to artistic representation of scientific process, scientific methods and its outcomes in European cultural framework. Latest results coming from comprehensive social science research projects implemented in numerous European countries show that there is a clearly presented need of wide stakeholder groups to participate in decision making processes related to funding of scientific research, areas of special research interest and other aspects important to streamlining the research process; this comes as no surprise having in mind interest of numerous stakeholder groups for this topic and high level of understanding of problems and possible solutions to them whereas one of needs to keep in mind important aspect to this process that is influence which arts in general have in depicting scientific processes to general public and indirectly influencing wide range of stakeholder groups’ opinions and impulses on this topic (Durant, et al., 2000). Therefore it is only natural that one can notice
Serbian Project Management Journal, Volume 6, Issue 1, November 2016
wide momentum in merging arts and scientific approaches in European projects that among other benefits offer the possibility of presenting scientific results in forms and formats that are perhaps more acceptable to wider audiences. Advantages to establishing fruitful merger of arts and sciences can be achieved in all scientific areas. Some areas are perhaps more in the focus of financing initiatives due to more beneficial return on investment achievements or social needs and infrastructure building potentials. European Union tends to launch general project frameworks providing financing and fostering of fruitful collaborations in many areas and one such initiative in area of fostering collaboration between scientist and artists is START platform. STARTS encourages synergies between the Arts and innovation for technology and society by promoting the inclusion of artists in Horizon 2020 projects as defined at the website of the initiative https://ec.europa.eu/digital-singlemarket/en/ict-art-starts-platform.TheEuropean Commission has launched the STARTS initiative, supporting 'Innovation at the nexus of Science, Technology, and the ARTS. It is a field where boundaries between art and engineering are removed and creativity becomes a crucial factor. Commission has acknowledged that every day more and more high-tech companies assert that scientific and technological skills alone are not sufficient anymore to be competitive in highly globalize markets and that arts are gaining prominence as catalysts for an efficient conversion of science and technology knowledge into novel products, services, and processes. Günther H. Oettinger, Euroepan Union Commissioner in charge of the Digital Single Market stated that in the age of digitisation, art and engineering are no longer contradictory modes of thinking. In order to foster this initiative a new European Union Prize – the STARTS prize has been established. It will provide for higher visibility to the most forward-looking collaborations between companies and artists. One concrete European Union project brining to life general idea of fostering collaboration between artists and scientists in particular area is The European Digital Art and Science
Network. This project implemented by six partnering institutions from 2014 to 2017 within the framework of Creative Europe financing programme is forth 1.1 million euros. It aims to collide the minds of science with those coming from the digital arts in order to achieve a serious, common perception of opposed disciplines. As stated at the project website (http://www.aec.at/artandscience/en/) many innovative and creative activities are realized within this project, one of the more interesting being the Beehive. It is an artistic research experiment and a documentation tool for the European Digital Art and Science Network to collect and contextualize video contents from artists, visitors and partners. In the broadest sense it is a cross-media system for crowdsourced video documentation. The beehive series as the central metaphor: like in a society of bees, registered artists, partners or participants/visitors swarm out, capture footage of a residency, an exhibition or a talk. Another particular project implemented within one of the frameworks of European Union financing that aims at fostering collaboration between scientists and artists is project ArtS. It is a three year project implemented within Erasmus+ programme. It aims at the exploitation of the cultural and Creative Sectors potential for creating growth and jobs and at the enhancement of cultural economy at local, regional, national and transnational levels as stated at the project website (http://arts-project.eu/). Stated aims of the projects are to define and forecast labor market needs in the Cultural and Creative Sectors countries from which participating partner institutions originate, i.e. Greece, Italy and Spain and design appropriate teaching and training methodologies in order to deliver a joint training programme that will respond to these needs. The project will assess the labor markets in areas of craft, performing arts with special emphasis on music, dance and theatre, cultural heritage with focus on archives, libraries and museums, literary arts focusing on books and press, visual arts and multimedia. In the line of the project realization the development of a vocational education and training curriculum will be achieved in accordance to EQF/ECVET standards, that is outcome-oriented and 9
A. Sofronijević, V. Milićević, D. Petrović
responds to specific skill shortages in the creative and cultural sectors’ markets. Also the facilitation of networking and labor mobility will be analyzed along with the design and delivery of a novel training programme. One great example of establishing positive outcomes in combining arts and science comes from the project that advances collaboration among artists and European Space Agency (ESA). Within the scope of this project several levels of collaboration among scientist and artists have been established in order to foster and broaden humanistic and culture aspects of space exploration. Several models of collaboration have been envisioned starting with individual collaboration where individual artists used infrastructure and other ESA resources in their artistic process. Next level of collaboration has been described as bilateral collaboration between a scientist and an artist who used their respective complementary skills and experiences to add to each others’ work. Cluster level in collaboration has been depicted as a framework for collaboration among artistic groups and appropriate number of scientist with use of ESA infrastructure. Finally, strategic level of collaboration is a model in which artists have been include on a long term basis in ESA scientific teams in order to bring in their specific approaches that might be more rich in culture layers and with artistic expression and inspiration in order to enhance scientific planning process, execution of research and presentation of results for stakeholder groups (Pell et al., 214). In line of this project several forms of artistic expression have been used: art in space that is visible from Earth, art in space for audience that is in space, applied arts such as design and architecture related to space exploration, artistic expressions that come about as an extension of scientific activities related to space exploration and finally art that embodies expressions of the new era through experiences and philosophy related to space exploration. Such complex examples of collaboration between artists and scientists are possible in frameworks of extensive projects realized by relevant research organizations such as ESA, the outcomes of such projects
10
are long lasting and their relevance for wide stakeholder groups is extraordinary. Several projects realized in Europe that involve collaboration between scientists and artists come into being in the framework of non-governmental organizations’ activities that merge social sciences related research and various forms of artistic expression supported by relevant interactive technologies. Such form of artistic expression can be a good base for achievement of relevant results in social science research process because it can lead to higher levels of commitment in research participants and increase their willingness to participate in the research and provide relevant input (Bach & Stark, 2002). European Commission project named ''The European Art-Science-Technology Network'' that is a part of Creative Europe program (http://www.eastn.eu/) is especially inspirational. Within this project there is a chance for artist to apply with specific projects and based on strict process best candidates are offered the possibility to realize their long term ideas about artistic expression that is based on collaboration with scientists. In the framework of the project several forms of artistic expression by means of digital technologies are realized: interactive arts, digital music and sounds, digital design, digital architectural installations, computer animations, film, photography and visual effects, digital communities and social networks, hybrid arts, performance and choreography. By application of such approach collaboration between scientists and artists is fostered and bi-directional positive results that encompass both influences of scientist, scientific approaches and scientific tools and techniques on artistic expression that is by this influence enriched and broadened and also influence of artists on scientist that is mostly in areas of increasing creativity and grounding basis for long term inspiration are realized. The collateral benefit that is also of high importance in this project is increased influence of scientific processes on general population that is achieved by intervention of artists who in their artistic expression provide different and perhaps better and easier venues for understanding scientific results, but also scientific process as a whole with its specific
Serbian Project Management Journal, Volume 6, Issue 1, November 2016
needs and long term approaches that may be so important in both everyday life and for long term prospect of a society and humanity in general. 4. CONCLUSION Collaboration between scientists and artist obviously provide much needed synergy that may foster both scientific and artistic process, but may also be of high importance in business environment as a shortcut to a more inspired and thus more efficient research and development. In a broader sense artists and scientist working together may provide better insight for general public into their sometimes secluded areas of interest and activities and thus ground basis for a more productive societies. European projects that encompass both scientist and artists and foster their collaboration are especially relevant for networking and merging these often times divergent fields of human endeavor enabling by this positive effects of this collaboration to be available for European communities. LITERATURE Artscience museum, (n.d.). About Artscience museum, accessed on June 20th 2016 at http://www.marinabaysands.com/museu m.about Antal, M. J., & Grønli, M. (2003). The art, science, and technology of charcoal production. Industrial & Engineering Chemistry Research, 42(8), 1619-1640. Bach, J., & Stark, D. (2002). Innovative ambiguities: NGOs’ use of interactive technology in Eastern Europe. Studies in Comparative International Development, 37(2), 3-23. Born, G., & Barry, A. (2010). Art-science: From public understanding to public experiment. Journal of Cultural Economy, 3(1), 103-119. Carayannis, E. G., & Campbell, D. F. (2014). Developed democracies versus emerging autocracies: arts, democracy, and innovation in Quadruple Helix innovation systems. Journal of Innovation and Entrepreneurship, 3(1), 123.
Charyton, C., DeDios, S. L., & Nygren, T. E. (2014). Scientific productivity and idea acceptance in Nobel laureates. The Journal of Creative Behavior. 0 (0), 1-20. Charyton, C. (2015). Creativity and Innovation Among Science and Art. Springer-Verlag, London. Charyton, C. (2015a). Creative engineering design: The meaning of creativity and innovation in engineering. In Creativity and Innovation Among Science and Art (pp. 135-152). Springer-Verlag, London. Clark, R. (2002). Pigment identification by spectroscopic means: an arts/science interface. Comptes Rendus Chimie, 5(1), 7-20 Clements, M. (2014). Promoting Creative Development: A View into Arts-Science Integrations. A research paper proposal submitted in conformity with the requirements for the degree of Master of Teaching, Department of Curriculum, Teaching and Learning Ontario Institute for Studies in Education of the University of Toronto. Durant, J., Bauer, M., Gaskell, G., Midden, C., Liakopoulos, M., & Scholten, L. (2000). Two cultures of public understanding of science and technology in Europe. In: Dierkes, M. & von Grote, C. (eds.) Between understanding and trust: The public, science and technology, Routledge, 131-56. Galison, P., & Jones, C. A. (Eds.). (2014). Picturing science, producing art. Routledge. Feist, G. J. (1991). Synthetic and analytic thought: Similarities and differences among art and science students. Creativity Research Journal, 4(2), 145155. Kaplan, K. (2014). Science and the arts: Rock and research. Nature, 510 (7503), 177179. Kemp, M. (2006). Seen| Unseen: Art, Science, and Intuition from Leonardo to the Hubble Telescope. LaMore, R., Root-Bernstein, R., RootBernstein, M., Schweitzer, J. H., Lawton, J. L., Roraback, E., ... & Fernandez, L. (2013). Arts and crafts: Critical to
11
A. Sofronijević, V. Milićević, D. Petrović
economic innovation. Economic Development Quarterly, 0891242413486186 Monoyios, K. (2015). Science Art Exhibits in 2016: The Early Edition, Scientific American, accessed on June 20th 2016 at http://blogs.scientificamerican.com/symb iartic/science-art-exhibits-in-2016-theearly-edition/ Murayama, K., Nirei, M., & Shimizu, H. (2015). Management of science, serendipity, and research performance: Evidence from a survey of scientists in Japan and the US. Research Policy, 44(4), 862-873. Museum of Arts and Sciences. (n.d.) Our Mission, accessed on June 20th 2016 at http://www.masmacon.org/our-mission Museum of Applied Arts and Sciences. (n.d.). About museum, accessed on June 20th 2016 at http://maas.museum/about Pallot, M., Alishevskikh, A., Krawczyk, P., & Holzmann, T. (2014). Exploring the Feasibility of an Online Serendipity Service in the Context of Open Innovation within the EU Horizon2020 Research Program. In Proceedings of the ISPIM’2014 Conference, Dublin, Ireland. Pell, S. J., Imhof, A. B., Waldvogel, C., Kotler, J. M., & Peljhan, M. (2014). Towards a cooperation between the arts, space science research and the European Space Agency–Preliminary findings of the ESA Topical Team Arts and Sciences (ETTAS). Acta Astronautica, 105 (1), 181-191.
12
Phillips, R. (2004). Artful business: Using the arts for community economic development. Community Development Journal, 39(2), 112-122. Root-Bernstein, R. S. (2003). The art of innovation: Polymaths and the universality of the creative process. In International handbook of innovation, 267-278. Root-Bernstain, R.S., et al. (2008). Arts Foster Scientific Success: Avocations of Nobel, National Academy, Royal Society and Sigma Xi Members. Journal of Psychology of Science and Technology, 1(2), 51-63. Schmidhuber, J. (2009). Simple algorithmic theory of subjective beauty, novelty, surprise, interestingness, attention, curiosity, creativity, art, science, music, jokes. Journal of SICE, 48(1). Schwartz, B. (2014). Communicating Science through the Performing Arts. Interdisciplinary Science Reviews, 39 (3), 275-289 The International Museum of Art and Science. (n.d.). Welcome to IMAS, accessed on June 20th 2016 at http://theimasonline.org/welcome Watts, J. (2015). Museum of Tomorrow: a captivating innovation to imagine a sustainable world, The Guardian, online edition 17th December 2015. Wilson, S. (2002). Information arts: intersections of art, science, and technology. MIT press.
Serbian Project Management Journal, Volume 6, Issue 1, November 2016
CAUSES AND EFFECTS OF INCESSANT BUILDING COLLAPSE IN NIGERIA Abdelnaser Omran1, Olojotuyi Bamidele2, Amir Hussin B. Baharuddin3 1,3
School of Economics, Finance and Banking, College of Business, University Utara Malaysia, Malaysia 2 In-Situ Holmes Ltd, Abuja, Nigeria
Abstract: In consideration of the enormous importance of construction industry to the economy of any nation, Nigeria not exempted, the quest to achieve sustainable development across the country requires a healthy construction industry devoid of incessant building collapses. Unfortunately, the incessant occurrence of collapse of existing buildings, abandoned buildings and buildings under construction in the country appears not to be encouraging, thereby calling for urgent attention of all stakeholders. The aim therefore of conducting this study was to determine the remote causes of incessant building collapse in Nigeria, and to proffer solutions to checkmating the menace. A questionnaire survey was carried out to extract opinions from built environment professionals in relation to the study. The findings indicated that the remote causes of building collapse in the country is attributed to; use of quacks, use of substandard/inadequate material, poor workmanship, lack of adherence to design specifications, lack of proper supervision by professionals, failure of client to pay for professional services, proliferation of market with sub-standard material, professional negligence/compromise, corruption in governance and lack of government concern. The study recommends that various built environment professional should form an alliance to stamp out “quacks” from carrying out design and construction supervision in the country, town planning units and standard organization of Nigeria (SON) must ensure that existing development laws are strengthened, empowered and invoked, and finally, government must work towards improving the economy to ensure that the common man can access and afford professional services and adequate building materials. Key words: Building, Collapse, Quacks, Supervision, Substandard, Material, Nigeria 1. INTRODUCTION Buildings and infrastructural construction are crucial inputs to economic activities, resulting to economic growth and improved incomes at the short term level, and a resultant national development in the long term level (Anthony, 2011). Considering the importance of the construction sector to the nation’s economy and as the yearnings to achieve sustainable development progresses, the built environment industry deserves unwavering attention from all stakeholders. Unfortunately, the questionable rate of collapse of existing buildings and the ones under construction appears not to be encouraging and needs to be addressed (Anthony, 2011). Structural failure relation to buildings comes in various degrees and forms of severity - the worst of which is a collapse. Decay and deterioration especially of
vigor or usefulness of a building can be categorized as a failure of some sort but a loss of bearing strength resulting in a sudden breakdown, physical depletion and/or falling apart is termed a collapse. Falobi (2009) reveals that; incompetence; greed; corruption, poor enforcement of building codes, poor planning, inadequate education and public awareness, and limited technical and financial are among the factors resulting into cases of collapses. Structural system are expected and designed to meet required needs and safe to avoid loss of life, damage to the environment and property. But due to the fact that human actions are characterized by occasional mistakes coupled with the existence of other external factors which influences the safety of building and structures, failures do occur (Ede, 2010). Generally, Anthony (2010) attributed failure of structures to negligence, design
Corresponding author. Email:
[email protected] ISSN 2217-7256 (online) © 2016 YUPMA www.spmjournal.rs
13
A. Omran, O. Bamidele, A.H.B. Baharuddin
flaws, ageing, material fatigue, extreme operational and environmental conditions, accidents, terrorist attacks and natural hazards. In the case of Nigeria, the causes of building collapse can be traced to abnormal factors not obtainable in many other nations, Anthony (2010) submitted. Ekundayo A. Adeyemi, a Nigerian and Africa first Professor of Architecture said; “In fact, the issue of collapse of buildings in Nigeria is quite saddening and need not recur anymore. You know that building is an interdisciplinary thing. The architects do the drawings and we also have the construction people. So we have some contractors who do not buy the required materials to get the job well done. Therefore, the engineers and the contractors have to be more faithful in their jobs so as to curb the menace of the unnecessary collapse of building in our environments. Though, we have come of age but we can still do better if we can put in more honesty and dedication to the discharge of our duties because building work is a continuous thing” (Abdulazeez, 2011). Building failure, according to Ayininuola and Olalusi (2004), is an unacceptable difference between expected and observed performance of building components. They identified two types of failure in building, which are cosmetic and structural types. Cosmetic failure occurs when something has been added to or subtracted from the building, thus affecting the structures' outlooks. On the other hand, structural failure affects both the outlook and structural stability of the building. Incidences of distressed or collapsed buildings are global phenomenon and are not limited to Nigeria. At the international level, a number of building collapses were reported; (1) Ronan Point apartments collapse in UK (1968), resulting into the crumbling of the 25-storey building after kitchen gas exploded on its 18th floor; (2) 2000 Commonwealth Avenue Tower collapse in Boston (1971); (3) Civic Center of Pavia (1989); and (4) collapse of Murrah Federal Building in Oklahoma city (1995), due to air blast; (5) a four-storey commercial building at 14th and 2nd Avenue in Brooklyn, USA (2000); (6), partial collapse of vacant building at 124th Street, North of Manhattan, New York; and (7) a five-storey vacant apartment building (Manhattan, 2008). Researchers like (Falobi, 2009; Badejo, 2009; Bamidele, 2000)
14
attributed common causes of collapse of buildings in Nigeria to defective design, poor/faulty construction, foundation failure, extraordinary loads, use of unqualified contractors and poor project monitoring, and lack of enforcement of relevant building codes by town planning officials. The cost of these collapses in terms of loss of human lives and enormous economic waste, loss of investments, job, income, etc, cannot be over emphasized. The combined environmental impact and the disgrace it brings to the professionals involved in the building industry must be tackled accordingly (Anthony, 2010). The trend of this saddening event cannot continue untamed, hence the urgent need to dig deep into determining the remote causes of these continuous collapses aiming at proffering strategies for lasting solution to the menace. 2. LITERATURE REVIEW The related history of the past three decades reveals that, collapse of buildings has been on the increase in most Nigerian cities drawing global attention and prompting various written academic journals and newspaper articles about this national embarrassment. The situation seems not to be relenting either because the true causes are yet to be identified or because those in charge have not taken the appropriate actions to put the situation under control. Salau (1996) articulated the first cases of building collapse in Nigeria, their possible causes and suggested among other things the involvement of professional engineers in the different phases of building construction process and the review of academic programs to enhance the capacity of workmen and technologists in the building industry. Olajumoke et al. (2009), on his part assessed the causes and possible solutions to building failure in Nigeria. The summary of their research showcased that the presence of unqualified professionals in the industry was the principal cause of building collapse and they therefore called on the professional bodies to step up their surveillance of building sector so as to exterminate the usurpers. Adeniregun (2010) also reviewed all the relevant and available data on building collapse in Nigeria over the past 30 years. The research recorded complete list of collapsed buildings in Nigeria
Serbian Project Management Journal, Volume 6, Issue 1, November 2016
(56 cases) with information on the date of occurrence, type of buildings, addresses, casualties and possible causes. 2.1 Overview of Building Collapse across the Globe In November 2010, a five-storey residential building collapsed in India’s capital, New Delhi, killing about sixty people. The building crumbled into a heap trapping an unknown number of people beneath heap of stone and irons. About 400 people were confirmed to be living in the building at any given time (The New York Times, 2006). The cause of the collapse was suspiciously attributed to the heavy monsoon rains experienced in the year, poor and shoddy construction. Many Indian buildings do not conform to safety regulations with owners building extra floors or structures without approval. Poor construction material and inadequate foundation are often blamed for collapse of buildings in India. On December 11th 1993, Highland Towers Apartment building n Taman Hillview, Ulu Klang, Selangor, Malaysia collapsed killing no fewer than 48 people and leading to the total evacuation of the other two blocks because of safety reasons and concerns. The collapse occurs after 10 days continuous rainfall led to a landslide causing the failure of the retaining wall behind the Tower's car park. (Wikipedia Article: Highland Towers Collapse). It was observed a month before the collapse that active cracks appeared on the road around the Highland Towers, according to residents in the area. The BBC Online Network published on November 12 2011, the collapse of six-storey apartment blocks in southern Italy killing at least 34 people. Research suggests that, the homes of more than three million Italians may be at risk, two-thirds of them because of poor building materials or modifications made without authorization. The collapse reduced the apartment building into a pile of rubble of which the cause was suspected to be due to structural failure or suitability of the ground on which the flats were built. The report equally has it that, a similar tragedy struck in December 1998, killing 27 people. The trend of the collapse prompted the Italian government to announced plans to enforce a survey of all buildings put up in the last three
decades, listing their date, modifications and condition. The Sampoong Department Store collapse was a structural failure that occurred on June 29, 1995 in the Seocho-gu district of Seoul, South Korea. The collapse is the largest peacetime disaster in South Korean history recording 501 death and 937 varying injuries. The historical background of the building has it that, the construction commenced sometimes in 1987 on a tract land used initially as landfill. The SDS was originally designed as office building but was changed to a large department store during construction which resulted in cutting away a number of columns to make way for installation of escalators. The building was completed in late 1989 and opened for business in July 1990, attracting about 40,000 people per day. Due to selfishness of the owner, flagrant disobedience to design specification, and unauthorized modifications, the building's south wing pancaked into the basement trapping 1,500 people and killing 501. A 1970s constructed archive building in Cologne, Germany was reported collapse on Tuesday, 3 March, 2009. Four people are suspected to have been killed by the collapse which equally caused a nearby building to subsequently collapse. The archive building contained 65,000 original documents, some of them dating back more than 1,000 years. The Newstime Africa of Sunday, January 10th, 2010 reports that, at least seven people were feared trapped in a collapsed building in Kiambu Township, in the outskirts of Kenya capital Nairobi raising questions on architectural and planning standards in Kenya. Three people have been confirmed dead and four seriously injured after a six-storey building under construction caved in, rambling on adjacent shanties after a heavy downpour. It is common practice that property developers in Kenya collude with planning officials at the local authorities to get approval of building plans that are never implemented. Impunity in Kenya has been a trend that has seen the mushrooming of buildings that flout the building code and later collapse, killing innocent people. Kenyan laws require that any person or company wishing to put up a building must have the structure designed by a qualified architect and engineer. In Kenya, Construction of sub-standard buildings is attributed to the developers move to cut costs by not following
15
A. Omran, O. Bamidele, A.H.B. Baharuddin
the architectural plans, the report concluded. The Nigerian Tribune of Thursday, 30 June 2011 reports that, a two- storey building under construction, on Wednesday 29 June, 2011, collapsed, leaving about four persons dead and 11 others with varying degrees of injury at Mararaba, Karu, Nasawara State, off the nation’s city centre, Abuja. The construction work on the two-storey building was said to have commenced in March 2011). The sound of the collapsed building attracted members of the community living around there and that about 10 of the victims were manually rescued from the rubble before the arrival of National Emergency Management Agency (NEMA) officials who came on emergency rescue. 2.2 Building Collapses in Nigeria In reference to the historical data collected for this research, it was observed that the incidence of collapse has been on the increase in Nigeria from 1985. In spite of the commendable research works written on the phenomenon, from Salau (1996) to Oke (2011) and numerous newspaper, conference, workshop, seminar articles all high-lighting some of the causes and possible solutions, the phenomenon does not show any sign of abating due to the incessant occurrences reported almost on daily basis. Fagbenle and Olabosipo (2010) submitted that 70% of the cases of building collapse in Nigeria are associated with the informal sector of which private buildings accounts for 70% while public and corporate organization shared the balance in 23.3% and 6.7% respectively. This view was concurred to by Ayodeji and Joseph (2009). Famoroti (2005) cited in Oke (2011) indicated that Nigeria has been reported to be the “world’s junk-yard” of collapsed buildings worth billions of Naira. Oke (2011) reiterates that with such a quantum of potentials in the construction industry in Nigeria, it is quit unimaginable that monumental site of building collapse scattered across the landscape of the country. Fagbenle and Olabosipo (2010) posited that the occurrence of building collapse in the nation has become a major concern, as the magnitudes of the incident are becoming alarming by the day. In fact, building collapse has now become a familiar trend even to a layman on the street in Nigeria, they concluded. Sodare and Usman
16
(2000) cited in Ayodeji and Joseph (2009) affirms that building collapse, though a common phenomenon across the globe is more rampant and devastating in the developing countries. Many cases of building collapse as recorded in Nigeria scenario were observed to cut across private, corporate and public building categories (Ayodeji and Joseph, 2009). They revealed that private buildings are more prone to building collapse than all other category of building ownership in the country. According to Oyewande (1992), causes of building failures in Nigeria are attributed to 50 per cent of the causes being owing to design faults, 40 per cent to fault on construction site and 10 per cent to product failure. Building failures could be as a result of defects under any or all of the stages in design approval of drawings and the supervision/construction stage. Almost all the tragic incidents recorded in Nigeria have been blamed on either the developers for failure to comply with building regulations, or professional builders, architects and engineers, as well as government agencies whose duty is to ensure compliance. Fredericks and Ambrose (1989) suggested that the overturning of structures due to heavy wind-loads, sliding of structures due to lateral-loads are major types of failures of buildings. In addition, Akinpelu (2002) categorized the major causes of structural failures as environmental changes, natural and man-made hazards, improper presentation and interpretation in the design. Richard (2002) opined that deterioration of reinforced concrete could occur as a result of: corrosion of the reinforcement caused by carbonation and chloride ingress, cracking caused by overloading, subsidence or basic design faults, and construction defects. 2.3 Causative Factors of Building Collapse: The Nigeria Scenario The possible causes of building collapse in Nigeria are reported to be numerous, and can be complex depending on the type and complexity of the building. According to Folagbade (1997), the inability of the engineer to carry out proper site investigations, inability to calculate design loads accurately, inability to prevent the use of substandard
Serbian Project Management Journal, Volume 6, Issue 1, November 2016
building materials, inability of the engineers/planning authority to have good design layout and inability of the engineers to understand structural analysis and design principles lead to structural failures. Rowland (2009) submits that it is somewhat surprising that lessons are never learnt and more embarrassing cases continue to occur. Many analysts argue that collapse happen in Nigeria because of flagrant disobedience to the outdated rules and regulations guiding the building industry, or the lack of will to enforce the appropriate building regulations, or poverty, and the need to unnecessarily “manage” the building cost. The sudden collapse of buildings in Nigeria is due to ignorance of the owner, builder and gross professional negligence; it has little to do with government, he concluded. Taiwo and Afolami (2011) articulated the following as possible causes of building collapse in Nigeria; the absence of soil test report, structural designs and details handled by quacks, absence of coordination between the professional bodies and the local town planning authority, lack of adherence to specifications by the unqualified and unskilled personnel, poor and bad construction practices, the use of substandard building materials. Others includes: lack of proper supervision by professionals, inadequate enforcement of the existing enabling building regulations, illegal conversion of buildings which often lead to structural deficiencies, flagrant disobedience of town planning regulations by developers/landlords, the compromising attitude of some workers of the town planning authority, lack of sanctions against erring professionals and building owners, impunity, fire, excessive loading, decay, foundation failure, structural failure, quackery, cutting corner by contractor, and lack of government concern. Regrettably, the professional bodies such as Nigerian Institute of Architects, the Nigerian Society of Engineers, the Nigerian Institute of Builders and appropriate planning and regulatory authorities, who stand in for government, share in the blame of the causes of collapse of buildings in Nigeria (Taiwo and Afolami, 2011). The Building Contractor Secrets posted an article titled “Causes of Building Collapse” on Friday September 28th, 2007; the article highlighted the following as
the causes of repeated building collapse in Lagos; boycotting the professionals, contractors cutting corners, human activities on building, and inadequate foundation, ageing building. Cherono (2011) adduced that, poor structural design, faulty construction and poor workmanship, foundation failure, extraordinary loads, and unexpected modes of failure. He concludes that building could collapse due to more than one of the above reasons, hence a combination of causes. In general terms, earlier studies have identified a number of factors that are responsible for building collapse in Nigeria. Yussuf (2006) classified the causes as physical factors, ecological status of the site, composition of technical components, social factors, economic factors, engineering factors, human factors, government policies, and political factor. Hall (1984) ascribed faulty design, faulty execution of work, and use of faulty materials as major causes of structural failures; while Merritt and Ambrose (1989) were of the opinion that sliding of structures due to high wind, overturning of structures due to heavy wind loads, roof uplift or sliding, and building sway due to lateral loads were major factors of failures in buildings. Oyewande (1992) also identified additional factors responsible for building collapses in Nigeria as design faults, faults on construction site and product failure, with design fault contributing most significantly to such collapses. Other studies by Akinpelu (2002), and Richards (2002) found that structural failures, environmental changes, natural and human-induced hazards, improper presentation and interpretation in design, deterioration of reinforced concrete occasioned by the corrosion of reinforcement caused by carbonation and chloride seepage, cracking resulting from overloading, basic design faults, and on-site construction defects are causes of building collapses in Nigeria. Ayininuola and Olalusi (2004) opined that as a result of high cost of modern building materials, use of local methods of construction were employed without design codes. The compositions of the construction methods included structural slabs and all-round lintels of hollow sandcrete blocks of low compressive strength that sometimes resulted in sagging of slabs and crushing of blocks underneath the slabs resulting into eventual collapse.
17
A. Omran, O. Bamidele, A.H.B. Baharuddin
Furthermore, Ahmad (2004) found additional causes different from earlier studies which are fungus stain and harmful growth, erosion of mortar joints, defective plastered rendering, cracking and leaning of walls, defective rainwater goods, decayed floor boards, insect or termite attack, dampness and penetration through walls, and unstable foundations. Global Corruption Report (2005) and Ozerdem (1999) posited that, corruption has been identified as a factor that is responsible for high cost of building materials and reduction in standard of construction works in developing countries. They affirms that corruption may be at different stages of construction (contract award, planning and design stage, construction stage, and when the building is completed) and that it may take different forms (bribery, deception and collusion}; the end products of its existence are lowering of construction standard, increasing cost of repair and maintenance, defects in building that may not be discovered until eventual collapse. Jayakumar (2008) listed leakage/seepage/dampness in buildings, misuse/wrong use of building for which it is not designed, attitude to house-keeping/regular maintenance, and indiscriminate renovations as factors responsible for building collapses. In the case of Oke (2011), building collapses in Nigeria is attributed to; inadequate brief, design deficiencies, foundation problems, natural occurrences, quality management, material and testing variability, contractor’s variability, poorly skilled workmen, inadequate maintenance, and unprofessional conduct. Fagbenle and Olabosipo (2010) was of the submission that building collapse stem principally from hasty construction, low quality workmanship, poor supervision, use of inexperience hands, ignorance, evasion/noncompliance with building regulations, nonenforcement of building quality, standard and control. The research undertaken by Ayodeji and Joseph (2009) also added to the long list of the causes of building collapse in Nigeria to include; inadequate/inappropriate material usage, inefficient supervision of workmen, poor quality of materials, and poor workmanship contribute significantly to the occurrences of building collapse in the country. Oloyede et al. (2010) sought public view and academia opinions on the causes of incessant
18
building collapse in the country. From the public view, they reported that; noncompliance with specifications/standards by developers and contractors, employment of incompetent contractor and use of substandard materials/equipment were the three prominent causes of building collapse occurrence in the country. Others are; improper design, faulty construction methodology, poor town planning approval/development monitoring process, inadequate supervision or inspection/monitoring, economic pressure, incompetent conversion, change of use of building, aged buildings, and poor maintenance culture. On the opinion of the academia, they reported that falling standard of education, lack of continuing professional development, non-enforcement of existing laws, endemic poor work ethics, and bribery/corruption are remote causes of building collapse in the country. The high cost of building material in the country especially cement has been attributed to increasing occurrence of building collapse in the country. Stella (2011) reported that “we have experienced several cases of building failure in the form of collapse both during and postconstruction stages; some of the cases investigated and some found to be associated with poor concrete mix-ratio. The high cost of cement cannot be ruled out as a contributory factor”. This statement was credited to the president of The Nigerian Institute of Architects (NIA), Arc. Olatunjibolu. 2.4 Possible Solutions to Building Collapse in Nigeria Chinedu and Fidelis (2011) stated that when problems exist in building development as regards failure, abandonment or collapse, everybody looks up to the engineers who in their professional ego and personality pride accept the blame but could not checkmate the menace. The efficient project management is the answer to project success, failure, abandonment, and collapses. Rowland (2009) contributed to the growing propositions to the solutions of the unacceptable building collapse cases in the country. Amongst his proposals are; (1) Building design must be carried out by registered and qualified professionals – Architects and Engineers, (2) Certified
Serbian Project Management Journal, Volume 6, Issue 1, November 2016
Builders must be fully integrated and take active roles in the construction stage, (3) Town Planners must demonstrate high level professional competence in inspection and approval of building plans, and (4) No profession in the built environment should be considered as “jack of all trade”. Oloyede et al. (2010), Fagbenle and Oluwunmi (2010) are of the view that, (1) Adequate enlightenment of the public by the press on the danger inherent in building collapse coupled with the use of unqualified hands – quacks, must be radically implemented, (2) Building neglect must be tackled by government at all levels using legislation, enforcement, support/assistance, and publicity/public education, (3) Effective oversight functions of regulatory authorities such as Town Planning Authority must be embarked on proactively, (4) Legal framework should be put in place to check activities of corrupt professionals and stamping out of quacks, and (5) Stiffer penalties in form of long jail or death, most especially where there is loss of life due to the collapse should be passed into law against owner and supervisor of any collapse building; will go along ay to nip the scourge of building collapse in the bud. Ayodeji and Joseph (2009) and Oke (2011) extend their proposal to solving the menace which are not limited to: (1) The Federal Government should involve members of NIOB and NSE in sanitization of building materials process including attachment of Material Engineers to large project site, and (2) Effective supervision of workmen and checking of materials before converting them into work on site must be a top level priority of the site management team. The Chairman of NITP, Catherine George maintained that extermination of quacks from the industry by enforcing existing regulations and byelaws will go a very long way in curbing the rapidity of the occurrence of building collapse in the country. The President of Nigerian Institution of Structural Engineers, Engr. Kunle Adebajo, at the opening of a 3-day national workshop on collapse of buildings and engineering structures held on July 21, 2005, joined forces with the teeming population of those proffering solutions to the inglorious spate of building
collapse in Nigeria by asserting that; (1) since Structural Engineers are the only people trained to do structural engineering jobs, only them should be entrusted with the responsibility for executing structural engineering projects – most especially site supervision of construction works, (2) appropriate planning authorities must not compromise on the standards established for the approval of drawings, (3) government must, through the appropriate standard organizations, ensure availability of only good quality materials for the construction market (4) suppliers in poor quality construction materials and culprits of building collapse should be prosecuted, (5) adequate geotechnical soil investigation must be carried out before embarking on any project, to ensure proper foundation design, and (6) the public should be alert and assist in reporting to appropriate authorities of any construction project they may consider to be dangerous to the safety of the citizenry. Taiwo and Afolami (2011) proposed the following measures to reduce the problems of collapsed buildings to a manageable proportion; (1) Continuing professional development should be emphasized by both the professional bodies and the government on modern trends in the building industry so as to keep members of the building industry abreast with new trends in construction. (2) Clients should obtain approvals before they begin construction, work with the approved drawings and specifications and approve all alterations before execution and, (3) Regular audit of ongoing construction and defective structures must be carried out and if found wanting, it must be recommended for demolition before it causes havoc on lives and properties. 3. RESEARCH METHODS The data for the study were collected from two sources; primary and secondary sources. The primary data for this study were collected through the questionnaire survey carried out in Abuja, Lagos and Port-Harcourt, Nigeria. The questionnaire survey was used to investigate causes and effects of incessant building collapse in Nigeria cities of Abuja, Lagos and Port-Harcourt.
19
A. Omran, O. Bamidele, A.H.B. Baharuddin
The questionnaires were distributed to ninety (90) respondents, who are of built environment background and are actively involved in construction and consultancy in the private sector and those at strategic management level in public sector. Fifty-one (51) were returned, yielding a response rate of 56.663%. The responses by profession are: Architects (4), Engineers (31), Quantity Surveyors (12), Project Managers (2), Consultants (1) and, Regulatory Bodies (1). The questionnaire contained both open and close ended questions. It was comprised four (4) sections was designed to extract data and relevant information from respondents on their knowledge of the subject of the research in Lagos, Abuja, Port Harcourt cities of Nigeria. A Likert scale of 1-5 was used in the questionnaire to assess the causes and effects of incessant building in Nigeria, where ‘1’ represents the least effect and ‘5’ the highest effect. Section “A” of the questionnaire sought to know the general background of the respondents which is aimed at giving credence to the validity of the data obtained. Section “B” focused on factors responsible for building collapse which is aimed at identifying the causes of incessant building collapses in the 3 locations chosen for the research. Section “C” focused on effects of building collapse in Nigeria which is aimed to identify the degree of various effects associated with the collapses, while section “D” focused on obtaining first-hand personal comments of the respondent on the research. The sources of secondary data consist of journals articles, unpublished thesis, and proceedings of conferences, symposiums and extracts from newspapers, books, relevant internet websites and other related reports from government documents. The data extracted from the sources were subjected to descriptive analysis using Statistical Package for Social Sciences (SPSS) and thereafter tested for relative importance index (RII).
20
4. RESULTS ANALYSIS AND DISCUSSION 4.1 Political Factors Responsible Building Collapses in Nigeria
for
The descriptive and relative importance index analysis of the political factors suggested to be responsible for the incessant building collapse reflected that Corruption in Governance is adjudged the most prominent cause of building collapse in the political factor category having a RII of 0.792. Lack of Government Concern is adduced second factor having a RII of 0.702, while Impunity/God-fatherism fell in third position having a RII of 0.620. The result of the analysis as indicated in (Table 1) also shows that Government Policy on Infrastructure and Lack of Political Willingness scored 0.604 and 0.506 respectively. This finding is corroborated by Rowland (2008) when he posited that “it is ironical that the issues of building collapses in Nigeria are usually ever hardly taken serious by the government or even the law enforcement agents. Nigeria is a country where corruption looms large and continues unabated. These have brought the country to her kneels and renders all constituted institutions worthless. Construction Industry is not immune from the societal decadence and corruptive tendencies in every sector of governance in the country. The product of the extension of corruption in governance to construction industry is the endless occurrence of building collapse especially in the country and most especially in the study areas of the study. Secondly, lack of government concern and commitment to ensure safety of life and properties in the country have contributed in no small measure to the occurrence of building collapse in the country. The government at all levels in the country have played and are playing lip services to matters that concerns common citizens of their respective domain and such attitude is extended to the continuous issue of building collapse. As it is today, these two factors are still there unattended to and will continue to be significantly responsible for building collapse in the country and study areas except cogent steps are taking to tackle them.
Serbian Project Management Journal, Volume 6, Issue 1, November 2016
Table 1. Political Factors Responsible for Building Collapse in Nigeria Political Factors Mean RII Lack of Political Willingness 2.53 0.506 Government Policy on Infrastructure 3.02 0.604 Corruption in Governance 3.96 0.792 Lack of Government Concern 3.51 0.702 Impunity and God-fatherism 3.10 0.620 4.2. Socio-Economic Factors Responsible for Building Collapses in Nigeria The Socio-Economic factors suggested to be responsible for incessant building collapse in Nigeria were subjected to descriptive and relative importance index analysis and the result obtained is indicated in (Table 2). Inability of client to pay for professional services came first with RII of 0.832, followed by proliferation of market with substandard material (RII=0.804). High cost of construction/material came third at 0.752 RII while the fourth and fifth position were occupied by poverty (0.718) and Inability to Access Loan/High Interest Rate on Loan (0.658). The result indicated that, in order of significance, Failure of Clients to Pay for Professional Services and Proliferation of Market with Sub-standard Material are the most prominent socio-economic factors responsible for building collapse in the three study areas of the country. This is supported by the Chairman of Nigerian Institute of Architecture when on October 26, 2009 he said “the clients are at the center of the collapses because many of them are looking for cheaper options thereby ignoring professional advice”. The finding that Inability of Clients to Pay for Professional Services tops the socio-economic factors responsible for building collapse in Nigeria is not a coincidence in that it has
Ranking 5 4 1 2 3
become the habit of individual home owners or property developers to jettison professional services in terms of design, construction and supervision largely because they do not want to pay professional fees for providing such services by competent professionals in the industry. This singular act usually described or termed “cutting cost” is here justified as the most significant socio-economic factor causing incessant building collapse in the study areas. Proliferation of Market with sub-standard building material was rated second most significant socio-economic factor causing incessant building collapse in the study areas. This was supported by Onuoha (2012) when he posited that “What are the issues that are involved in the collapse of buildings? They are poor workmanship and poor material. You can bring every other thing under those two categories”, he submitted. The building material market in Nigeria have over the years witnessed influx of sub-standard building material especially materials required for structural stability of buildings of which reinforcement bar size/quality and cement weight are major target of the building material supplier. The danger inherent in the use of these sub-standard materials in such an important area of the building as structural member is catastrophic and unexpected collapse whether during construction or on completion.
Table 2. Socio-Economic Factors Responsible for Building Collapse in Nigeria Socio-Economic Factors Mean RII Ranking High Cost of Construction/Material 3.76 0.752 3 Poverty Proliferation of Market with Sub-standard Material Failure of Client to pay for Professional Services Inability to Access Loan/High Interest Rate on Loan
3.59 4.02 4.16 3.29
0.718 0.804 0.832 0.658
4 2 1 5
21
A. Omran, O. Bamidele, A.H.B. Baharuddin
4.3 Techno-Environmental Factors Responsible for Building Collapses in Nigeria The result of the analysis of TechnoEnvironmental factors is indicated in (Table 3). Use of Quacks was adjudged the most important factor having the highest RII of 0.920. Three factors came second with the same RII of 0.862; they are Poor workmanship, Use of Sub-standard/Inadequate Building Material and, Lack of Adherence to Design Specifications. Lack of Proper Supervision by Professionals and Professional Negligence/Compromise were scored third and fourth factors having 0.854 and 0.804 respectively. Structural failure came fifth at 0.784 while, flagrant disobedience to Town Planning and Development Laws (0.764) and Lack of detailed structural drawings (0.722) occupied sixth and seventh position. Natural Hazard was voted the least factor with RII of 0.502 Of the suggested factors in this classification, the analysis reflected that Use of Quacks, Use of Sub-standard/Inadequate Building Material, Poor Workmanship, Lack of Adherence to Design Specification and Lack of Proper Supervision by Professionals are the 5 most prominent techno-environmental factors responsible for building collapse in the three study areas of the country. This is corroborated by Oloyede et al. (2010) when he submitted that “going by reasons adduced, the use of low quality building materials ranked first coupled with employment of incompetent craftsmen and artisan under very weak supervision on site”. The respondent adjudged through the analysis of the data that Use of Quacks tops the techno-environmental factors responsible for building collapse in the chosen areas of the study. The common causes of building collapse in Nigeria is attributed to defective design, poor construction, extraordinary loads, foundation failure, use of unqualified contractors and poor project monitoring, and lack of enforcement of relevant building codes by the town planning officials (Bamidele, 2000; Falobi, 2009; Badejo, 2009). The practice of quackery in Nigeria cut across board in all the sector of economy of which construction industry is not an exemption. There has been increase in the engagement of quacks and semi-baked persons
22
in construction residential homes for individuals and property developers in recent time of which the consequential result is the unending cases of collapses all over the areas this study covers. In Nigeria, as soon as you can interpret the simplest building drawing and have a stint of experience probably with not a registered construction company, you automatically become an Engineer or a builder to teaming population of clients who needs their houses constructed at a reduced cost; the consequences are uncounted cases of collapse in the country. Reports of so many committee set up either by government or relevant professional bodies to probe into cases of collapse indicated that, of the most cases of building collapse, the man-in-charge (Engineer/Builder) are usually quacks. Use of Sub-standard/Inadequate Material was equally confirmed as the second most important factor under this category. This was corroborated by Onuoha (2012) when he posited that “What are the issues that are involved in the collapse of buildings? They are poor workmanship and poor material. You can bring every other thing under those two categories”, he submitted. It is not surprising in that, if sub-standard material dotted the nooks and crannies of the building material market in the country, the contractors or developers are at the mercy of what is available to do their work and as such, collapse is aided by the use of these materials. It has been in the news as reported by various concerned professional bodies in the built environment that the practice of inadequate use of building material have taken over most private development in the country especially in the accelerated mass housing development policy of most state government and the Federal Capital Territory. The combination of use of sub-standard and inadequate material is like a time bomb ready to explode. Poor Workmanship found its way into the third position as the most important factor causing building collapse in this category and truly it has been confirmed even on visit to some of the collapse sites that it is a character of any occurrence of collapse in the study areas. This is supported by Keino (2011) when she posited that during actual construction, collapse may arise from use of inexperienced site engineer (quacks), lack of proper supervision, use of substandard building materials such as sand
Serbian Project Management Journal, Volume 6, Issue 1, November 2016
blocks with improper cement/sand mix, and engaging improper constructional methods such as not mixing concrete in correct proportions and improper curing of concrete”. The existence of poor workmanship in execution of construction work in relation to building collapse can be likened to “adding petrol to fire. The help that poor workmanship contributes to collapse building is in no small measure especially in areas that relates to structural stability of the building. Conclusively, Cherono (2011) stated that a number of reasons have been given to explain
why these buildings are collapsing and these include reasons like, the concrete mix ratio was not right, there was not enough planking and strutting in place to uphold excavations in place, the column spacing was too wide, the reinforcement was not adequate, the slenderness ratio was too high, the contractor was cost cutting by changing recommended concrete mix or reducing the amount of reinforcement recommended, addition of illegal structures to approved plans and a multitude of other reasons are amongst what is fronted for these collapses.
Table 3. Effects of Building Collapse in Nigeria
Effects of Building Collapse Death Loss of Investment Economic Waste Loss of Shelter or Place of Abode Trauma/Stress/Shock/Psychological Problem Displacement Tears/Sorrow Loss of Trust/Dignity Fear of Starting over again Disgrace/Shame - Parties Involved Suicide/Suicide Attempt Injuries Loss of Job/Incomes Environmental Disaster Disunity between Stakeholders Decline in Socio-Economic Growth Destroys National Re-branding Effort
Mean 4.33 4.53 4.20 4.10 4.16 4.06 4.24 3.78 3.59 3.75 2.73 4.33 4.06 3.92 3.35 3.76 3.45
RII 0.866 0.906 0.840 0.82 0.832 0.812 0.848 0.756 0.718 0.750 0.544 0.866 0.812 0.784 0.670 0.752 0.690
Ranking 2 1 4 6 5 7 3 9 12 11 14 2 7 8 15 10 13
23
A. Omran, O. Bamidele, A.H.B. Baharuddin
5. CONCLUSION AND RECOMMENDATIONS The revelation of this study in relation to remote causes of unending building collapse is Nigeria can be traced to abnormal factors not obtainable in many other nations (Anthony, 2010). These collapses are deemed avoidable having considered the factors adduced as the prominent causes and that the built environment professionals, regulatory agencies and the government have a major role to play in bringing the enemy called building collapse to its knees and save Nigerians from continuous grief. The unending, shameful and rapidity with which building collapse in Nigeria most especially in Lagos, Abuja and Port Harcourt cities which represent commercial hub and administrative base of the country has in no small measure dented the image of the country within the continent and world at large significantly because the factors identified for the occurrences are “man-made” and therefore avoidable. Having been confronted with the challenges and identified factors responsible for incessant building collapse in the country; it is my candid recommendation that the various built environment professional should form an alliance to stamp out “quacks” from carrying out design and construction supervision in the country. The town planning units and standard organization of Nigeria (SON) must ensure that existing laws are invoked and adhered to henceforth including certification of building materials. Instance response by National Emergency Management Agency (NEMA) and associated institutions responsible for rescue operation must be guaranteed and lastly, the government must work towards improving the economy so as to ensure that the common man can access and afford professional services and adequate building materials. LITERATURE Abdulazeez, A. (2011). Building Collapse in Nigeria is Saddening. 234NEXT Newspaper Article, Published on June 24.
24
Adeniregun, A.O. (2011). Study of Building Collapse in Nigeria; Effects of Poor Construction Materials and Poor Workmanship (Unpublished Student Thesis), Department of Civil Engineering, Covenant University, Ota, Nigeria. Ahmad, A.G. (2004). Understanding Common Building Defects - The Dilapidation Survey Report, Majalah Akitek, 16(1), 19-21. Akinpelu, J.A. (2002). The Need for Code of Conduct, Building Regulations and By-laws for the Building Industry in Nigeria. The Professional Builder, Nigeria Institute of Building, 2 (1), 11-14. Anthony, N. E. (2011). Measures to Reduce the High Incidence of Structural Failures in Nigeria. Journal of Sustainable Development in Africa, 13(1), 153-161. Anthony, N.E. (2010). Building Collapse in Nigeria: The Trend of Casualties in the Last Decade (2000 – 2010). International Journal of Civil and Environmental Engineering, 10 (6), 32-42. Ayininuola, G.M., and Olalusi, O.O. (2004). Assessment of Building Failures in Nigeria: Lagos and Ibadan Case Study. African Journal of Science and Technology Science and Engineering Series, 5(1), 73-78. Ayodeji, O., & Joseph, A. (2009). Relationship between Building Collapse and Poor Quality of Materials and Workmanship in Nigeria. RICS Research Conference, University of Cape Town, September 10-11. Badejo, E. (2009). Engineers, Others Urge Multidisciplinary Approach to Curb Building Collapse. The Guardian Newspaper, Retrieved from http://www.naijaproperties.com/news-95php [13th July 2014]. Bamidele, O.T. (2000). Building Collapse: Stakeholders Proffer Solutions on Way Forward. Chenoro, D.S. (2011). Understanding the Causes of Collapse of Building. The Kenya Engineer Online, June 17.
Serbian Project Management Journal, Volume 6, Issue 1, November 2016
Chinedu, C.N., and Fidelis, I.E. (2011). Building Construction Management Success as a Critical Issue in Real Estate Development and Investment. American Journal of Social and Management Sciences, 2(1): 56-75. Daily Sun Newspaper, Retrieved from http://www.dailysunngr.com [18th February 2014]. Ede, A.N. (2010). Structural Stability in Nigeria and Worsening Environmental Disaster: The Way Forward. Proceedings with the West African Built Environment Research Conference Accra, Ghana, July, 26-28th. Fagbenle, O.I., and Olabosipo, A.O. (2010). Building Failure and Collapse in Nigeria: The Influence of Informal Sector. Journal of Sustainable Development, 3(4): 268-276. Falobi, F. (2009). Nigeria: Tackling Disaster at Grassroots in Lagos. Daily Independent Newspaper, Retrieved from http;//www.dailysunnewspapers.ng [20th July 2013]. Famoroti, F. (2006). Before the Next Building Collapse. The Punch Newspaper, Nigeria, March 30, pp. 9. Folagbade, S.O. (1997). Structural Failures in Domestic Buildings in Nigeria: Causes and Remedies. Proceedings of a National Symposium on the House in Nigeria, Ile-Ife: University Press. Fredricks, M., and Ambrose, J. (1989). Building Engineering and Systems Design. Vol. 2, New York: Van Nostrand Reinhold. Global Corruption Report (2005). Corruption in Practice [Online] Transparency International. Available. Retrieved from at: http://www.transparency.org/ publications/gcr/gcr_2005#download [23rd April 2012]. Hall, G.T. (1984). Revision Notes on Building Maintenance and Adaptation. Butterworts, England. Jayakumar, J.S. (2008). Can Structural Audit Alone Stop Collapse of Buildings? The Indian Concrete Journal, 17-18.
Merritt, F., and Ambrose, J. (1989). Building Engineering and Systems Design, 2nd Edition. New York: Springer. Oke, A. (2011). An Examination of the Causes and Effects of Building Collapse in Nigeria. Journal of Design and Built Environment, 3747. Olajumoke, A.M., Oke, I.A., Fajobi, A.B., and Ogedengbe, M.O (2009). Engineering Failure Analysis of a Failed Building in Osun State, Nigeria. Journal of Failure Analysis and Prevention, 8-15. Oloyede, S.A., Omoogun, C.B., and Akinjare, O.A. (2010). Tackling Causes of Frequent Building Collapse in Nigeria. Journal of Sustainable Development, pp. 66-72. Oni, A.O. (2010). Analysis of Incidences of Collapsed Buildings in Lagos Metropolis. International Journal of Strategic Property Management, 14(4): 332-246. Onuoha, R. (2012). Building Collapse: Town Planning Authorities contravene Insurance Law. The Vanguard Newspaper of Nigeria, March 5. Oyewande, B. (1992). A Search for Quality in Construction Industry. Builders Magazine, June/July Edition, Lagos, Nigeria. Ozerdem, A. (1999). Tiles, Taps and Earthquakeproofing: Lessons for Disaster Management in Turkey, Environment and Urbanization, 11(2): 177-180. Richard, R.L. (2002). Leading the Way in Concrete Repair and Protection Technology. Vol. 1 Costa Rica: Concrete Repair Association. Rowland, A. (2009). Why Buildings Will Keep Collapsing In Nigeria. Retrieved from www.rowland-adewumi.com. [8th November 2014]. Salau, M.A. (1996). Structural Failures in Collapsed Buildings - Causes and Prevention. (Unpublished Report). Nigerian Society of Engineers, Lagos, 10 pages. Stella, O. (2011). Nigeria-Security: Rising Prices of Cement and Building Collapses. Daily Independent Africa News, Retrieved from
25
A. Omran, O. Bamidele, A.H.B. Baharuddin
http://www.afriquejet.com. [23rd April 2014]. Taiwo, A.A. and Afolami, J.A. (2011). Incessant Building Collapse: A Case of a Hotel in Akure, Nigeria. Journal of Building Appraisal, 241-248.
26
Yussuf, S.A. (2006). Planning Strategies for Stemming Building Collapse in Lagos. Paper presented at CPD seminar organized by the Nigerian Institution of estate surveyors & Valuers Lagos state Branch on 30th August 2006.
Serbian Project Management Journal, Volume 6, Issue 1, November 2016
PROJECT MANAGEMENT APPROACH TO STABILIZATION OF POST-CRISIS Samed Karović1, Goran Radovanović2, Hajradin Radončić3 1 Project Management College, University Educons, Serbia 2 The Ministry of Defence of Republic of Serbia 3 Military Academy, University of Defence, Serbia Abstract: The paper describes the process of stabilizing the post-crisis situation and the implementation of the project approach to resolving the situation. The project approach is essential from the point of achieving the objective of stabilizing the situation, monitoring the process of its basic stages which have effects on the process of meeting deadlines and spending resources. At the same time, it is evident that the only successful way to stabilize the situation after the resolution of the crisis is to define the process as the project of execution phases, which leads to an efficient organization recovery. Key words: Crisis stabilization, Crisis resolution, Project 1. INTRODUCTION Crisis management covers different types of qualitative areas related to the particular type of crisis. It is a multidisciplinary approach to solving any crisis and the level of occurrence. This means that the crisis management involves a large number of people, the organization, the ability of unified action, etc. Notwithstanding event the best frameworks, plans, and preparations, unfortunately, there is still the fact that not all the crises can be prevented. This proves to be true also for those crises which are likely to happen with almost absolute certainty. However, the impact of all crises may be reduced if those who deal with them fully know the basics of crisis management. Although it is not possible to predict all crises or prevent every single one, all of them can be effectively managed, if they are understood and addressed in the best possible way within the limits of human abilities. Post-crisis stabilization is a phase of the cycle of crisis resolution that begins with stabilization of events and ends with the recovery of the organization from the crisis. The term stabilization refers to a point in time
in which the problem of direct threats to the security of people and property caused by physical influences and primary and secondary hazards of agents has not been resolved. Crisis projection is a bridge between the current and the desired state of the organization and the way to overcome the crisis it is faced with. Without projection, its operation is left to chance. Projection is an intellectually demanding process because it requires clearly defined directions of action and decisions based on reason, knowledge and precise estimates. The paper describes the elements of recovery from the crisis through a project-based approach with clearly defined phases of recovery. The emphasis is on the processes at every stage with monitoring the progress of implementation. 2. SETTLEMENT OF CRISIS AS A PROCESS FUNCTION OF CRISIS MANAGEMENT Nowadays, crises are inevitable in almost any organization. Various managers are aware that the duration and consequences of crises could
Corresponding author. Email:
[email protected] ISSN 2217-7256 (online) © 2016 YUPMA www.spmjournal.rs
27
S. Karović, G. Radovanović, H. Radončić
be significantly diminished if an organization is prepared for a crisis. Ensuring a certain level of readiness of the organization for a potential crisis is the task of crisis management. Every crisis is characterized by multidimensional aspects, and the typology enables analysis of certain aspects and their deeper understanding (Boin and Hart, 2003). For the purpose of a comprehensive understanding of the crisis, this paper will primarily address the following criteria for crises differentiation: - Cause of the crisis: externally and internally caused crises, - Number of causes of the crisis: one or more causes of the crisis, - Duration of the crisis: short-term and long-term crises, - Degree of detection: potential, latent and acute, - Resolution of the crisis processes: finally tractable, temporarily tractable and intractable crises, - Types of consequences: crises with predominantly destructive or predominantly constructive effects, - Localization of consequences: crises with predominantly internal or predominantly external effects, - Goals of the organization: strategic crisis, crisis of success and crisis of operation, - Stages of the crisis: crisis threatening the survival of the organization and crisis that destroys the organization but it does not exist in a previously known form, and - Predictability of crisis: predictable and unpredictable. Due to the complex, uncertain and changing nature of crises, we can say that there are two general types of crises: "a crisis managed by the organization" and "a crisis which manages the organization." By applying proactive planning, crisis managers facilitate control and resolution of the crisis and avoid the possibility that the crisis follows its inertia, taking an undesirable course. Crisis management is not a unique and strictly defined activity, but it represents a theoretical 28
concept of a group of (crisis) events that have certain common patterns or great mutual differences (Boin and Hart, 2003). There are certain phases to pass in a crisis and its resolution. These phases are conditional and continuous. Work on the successful resolution of the crisis is reflected in the duration of the crisis and its consequences. Successful resolution of the crisis involves the availability of tools, methods, and instruments to timely identify and resolve the crisis so that it takes less time and the consequences are less severe. (Karovic and Komazec, 2009) Crisis management is normally carried out in the conditions of organizational confusion, under pressure from the media and the lack of accurate information. There are two dimensions – the technical and the political ones. The technical dimension refers to the capacity of organizations and the established strategy to address the potential threats, while the political dimension of crisis management is deeply controversial and highly politicized activity. The combination of these dimensions implies five key principles of crisis management: defining the context, making critical decisions, shaping the meaning, crisis resolution end of the crisis and learning from the crisis. (Luecke, 2005) 2.1. Defining the context The crisis poses an open challenge: once the crisis manifests itself, the decision-makers must ensure measures to fight against its consequences. The reality is, however, much more complex. Many crises do not manifest themselves suddenly and clearly; they are the product of escalation of other or secondary processes. From vague, ambivalent and contradictory signals, the decision makers must be able to realize that something unusual is happening and act proactively. They must identify and name the threat and define what the crisis is about (Osmanagic, 2003). The persons in charge of all activities are crisis managers, and it is the hardest task for them and for the decision-makers to respond
Serbian Project Management Journal, Volume 6, Issue 1, November 2016
to a challenge. The confusing nature, ambiguity, and complexity of the crisis can easily overpower the normal modalities of assessment of the situation. Stress can further affect the ability to understand what is happening. Organizational pathology also creates barriers to recognizing the crisis. Some categories of people are characterized by the ability to remain calm and "level headed" under pressure. They have developed the ability to analyze the data which allows them to competently perform the tasks in crisis conditions. Officers, journalists, police commanders or fire chiefs possess such characteristics. Some organizations have developed a proactive culture of "searching for problems" in their environment. (Luecke, 2005) These organizations, so-called organizations "of high reliability" have developed the capacity for a comprehensive but quick processing of information under stressful circumstances. 2.2. Making critical decisions During the crisis, organizations must make decisions about critical issues, which may be varied regarding place, time and complexity. Scarce resources may be the priority. It resembles an ordinary policy, but in the crisis, the disparities between the needs for public resources and their availability is significantly higher, the situation remains unclear and volatile, and the time for thinking, consultation and the provision of support for the decisions is very limited. During crises, organizations and leaders also face problems which they do not encounter every day, such as, for example, the involvement of the military, using of weapons or radical restriction of civil liberties. Crisis decisionmaking entails difficult choices, including changing priorities of the values and great political risks. An effective response requires interorganizational and inter-agency co-ordination. Any decision must be implemented by different organizations so that effective implementation of the decision means that these organizations work together. (Luecke, 2005) Most public organizations were
originally designed to perform routine tasks in accordance with values such as fairness, legality, and efficiency. However, crisis management requires flexibility, improvisation, creativity and violation of rules. Making quality decisions in a crisis situation is very difficult because they depend on the accuracy and types of available information as well as realistic and rational analysis of the situation. However, during the crisis, there is a lack of information and time, which certainly should not prevent a rapid response if the contingency planning is well done. An effective crisis response is largely the result of the natural process of evolution. It cannot be driven in a linear, gradual and comprehensive manner from a single crisis centre, no matter how well equipped it is with cutting edge information technology, which unites the top-level decision-makers. Simply, there are a number of obstacles that separate the critical decision-making from the timely implementation of decisions in the field (Boin and Hart, 2003). 2.3. Shaping of Meaning In a crisis, the leadership is expected to reduce uncertainty and to provide authoritative information on what is happening, why it is happening and what to do. Once they have realized the meaning of the event and formulated a strategy, the leaders must persuade others to accept their definition of the situation. If they are not successful, their decisions will most likely be not understood or followed. Public officials are not the only ones who are trying to shape the crisis. At the same time, along with their messages, there are messages of others that have different positions and interests, and who will, accordingly, offer alternative definitions of the situation and advocate different courses of action. If other actors manage to prevail in the process of shaping the meaning, the ability of the current leaders to decide and maneuver will be seriously curtailed.
29
S. Karović, G. Radovanović, H. Radončić
It is often difficult for the authorities to immediately provide the correct information. They struggle with a mass of raw data (reports, rumors, pictures), which are created as soon as something extraordinary happens (Boisvert and Moore, 2003). It is a major challenge in itself to convert this information into a coherent picture of the situation. Presenting this picture to the public in the form of precise, clear and practical information will require significant efforts regarding public relations activities. These efforts are further hampered by the state of the public: people whose lives are severely affected are excited, i.e. under stress. They often do not see the leaders as their allies. Previously existing distrust towards leaders does not disappear in a moment of crisis. 2.4. Crisis resolution The extinguishing crisis has a two-sided nature. This refers to restoration from crisis to a routine way of functioning. In that respect, it implies some form of reduction of crisis operations. At the strategic level, it also requires analysis and drawing conclusions about what happened and provision of support for the final conclusion. These two aspects of extinguishing the crisis are different, but in practice, they are often very closely interconnected. The management system – its rules, organizations (institutions), public authorities – must be stabilized; it must restore the necessary legitimacy for exercising its normal functions. Leaders cannot do this by unilateral orders even if they have a formal legal authority to declare the end of the crisis in the legal sense. Poorly-estimated moment of ending the crisis may even bring about a boomerang effect since the affected values are still being under the influence of the crisis consequences. Discussions about liability can be easily converted into a "blame game" which is focused on identifying and punishing the culprit rather than on rational analysis of the entire sequence of causes and effects. The challenge for leaders is to cope with the political aspects of the liability for the crisis without recourse to sordid and potentially 30
self-defeating defensive tactics to avoid the blame. Leaders in the crisis must be aware and conscientious, but this in itself says little about how their actions will be assessed once the crisis ends. (Luecke, 2005) Decisionmakers and organizations that have not fulfilled their tasks before or during the crisis can successfully manage the events and their perception after the crisis and thus prevent the loss of reputation, autonomy, and resources. After the crisis outbreak, despite the measures taken for prevention, the focus is on its resolution. This implies activities aimed at mitigating the crisis and damage reduction. The experiences that should be singled out from the process of crisis resolution include certain facts about the characteristics of the crisis and its actual consequences. Crisis resolution is the specific part of the crisis that relates to basic questions of identifying the crisis, its strength, and consequences. (Karovic and Komazec, 2009) From the aspect of considering the crisis resolution, one should bear in mind a broader encompassing the whole range of activities focused on the crisis: from prevention before the onset of the crisis, through resolving the crisis in a narrower sense, to gaining new experiences in the process of resolving the crisis. Activities related to the process of crisis are considered crisis resolution. Crisis resolution takes place through certain phases that are characteristic of the process of crisis management. (Karovic and Komazec, 2009) An essential element in recognizing and resolving the crisis should be to define a specific place and role of a particular organization. This is primarily conditioned by the environment and stability of such environment, in which the organization exists, as well as its competences and, finally, its identity in terms of a specific task. 2.5. Learning from the crisis Crises provide a basis for potential lessons for contingency planning and training of personnel for future crises. It could be expected that the lessons learned be translated
Serbian Project Management Journal, Volume 6, Issue 1, November 2016
into organizational practice, policy and laws. However, this is not a standard practice. Drawing lessons are one of the least developed aspects of crisis management (Boisvert and Moore, 2003). In addition to cognitive and institutional obstacles to learning, drawing lessons is also limited by the role that these lessons have in determining the impact that the crises have on the organization. Crises become a part of the collective memory, a source of historical data for future leaders. Presenting the crisis as a product of failure in the prevention and prediction will force people to re-analyze the assumptions underlying the policies and rules of functioning of the system (Boisvert and Moore, 2003). Other stakeholders can use the lessons learned to advocate the measures and policy reform that the current leaders rejected. In this regard, the leaders have a major stake in the monitoring of the process of drawing the lessons in the political and bureaucratic arena. A key challenge is in achieving the decisive influence on the feedback generated by the crisis, the earlier policies, networks, and organizations. Learning from the crisis requires patience, institutional memory and low-conflict atmosphere, which leaders usually cannot provide. (Pomjan, 1987) Special emphasis should be put on the approach that is typical for the Armed Forces, primarily relating to learning from the experience. It is necessary to learn whatever is possible from any combat action and turn this knowledge into practical advice to implement it through the process of training the soldiers and units. Learning from experience should be part of every crisis ending operation. Direct stakeholders should meet and determine what was done well and what was bad. It must be done immediately after the crisis, while the memories are still fresh; make a list of own successful things, own failures, own misconceptions and everything that could have been done better. The list should become an integral part of the documentation on the crisis.
Questions are asked not to punish someone or establish who is to blame, but rather to assess the functioning of the crisis team and to prepare the organization for the future. It is important to receive information from everyone who participated and had a greater role in resolving the crisis. Particular attention should be paid to information from people who are experts in relevant areas. After collecting responses to the posed questions, it is necessary to draw lessons. Most of the lessons should be concrete and classified by topics (pre-crisis preparedness, warning signs, communication, verification, etc.). 3. POST- CRISIS STABILIZATION Regardless of the various types of crises that are mutually different, they still have something in common: first, they are always linked to the processes of life, whether of organic life (illness) or the life and coexistence of people in its various dimensions; second, they are characterized by the absence of a normal situation, i.e. what is usual and routine or healthy. In both cases, it is about permanent categories, or more precisely: the constants of the concept of crisis. This leads to a conclusion that crisis management and defining and clarifying the perceptions of crisis and behavior in crises and toward crises are universal categories. It should be noted that crises are disorganized, unstructured events, to which responses will not be completely adequate and brought up to the highest possible level. Predicting the onset of the crisis, where, when or how it will happen is a matter of skill rather than science. Regarding this statement, projecting, as a basis for any further action including elements of the worst case scenarios and ways to respond in such a situation, arises as a possible solution. Crisis management in the process of resolving the crisis can be understood through certain phases that characterize this process. The process is basically a dynamics that includes certain phases and they form the unity of continuous operation towards resolving the 31
S. Karović, G. Radovanović, H. Radončić
crisis. This results from the properties of the crisis manifested in the fact that the crisis "largely leaves time and the possibility of action to the subject; it requires action in order to survive''. In that sense, ''any subject that perceives some kind of its state, which is manifested as an apparent weakening of its mechanisms of regulation, as a threat to its own existence, is in crisis''. (Karovic et al, 2015)
be reflected only in leaving it to chance or undertaking contingency decision-making activities.
To restore these regulation mechanisms, crisis management precisely seeks to find objects that will act towards returning the functions to the subject that found itself under ''suffering'' at a given moment because there was no object that to affect it.
Reduction in a phase or process activity of crisis management is characterized by identifying early warning signals about the possible outbreak of a crisis. The key to crisis management lies in identifying potential crisis and putting efforts to reduce its impact (Karovic et al, 2015). The leadership should create inner strength of the organization, identify its weaknesses and external opportunities and threats. The essence of the reduction lies in the assessment of the "impact'' of a certain type of crisis on the organization and the implementation of the plan in order to reduce the effects of the crisis.
No matter how different various types of crises are, so we can speak about the concepts of regional crises, they have two things in common: first, they are always linked to the processes of life, whether of organic life (illness) or the life and co-existence of people in its various dimensions; second, they are characterized by the absence of a normal situation, i.e. what is usual and routine or healthy. In both cases it is about permanent categories, or more precisely: the contexts of the crisis concept. The second of these constants, the deviation from the normal situation, particularly clearly manifest itself in a crisis that occurs in the sphere of law or legal order. (Pomjan, 1987) To understand the essence of crisis management, it should be noted that the effects of the crisis management most often occur where potential crisis had been detected and where the action had been taken before the crisis actually occurred. In this case, the lines of communication are clear and the plan prepared in advance will prove to be effective. In this case, leadership and organizations without the crisis management system will inevitably have to deal with an unexpected crisis, i.e. they will expect what is unexpected, as a specificity resulting from such situation. Where a crisis is unexpected, poorly planned or imminent, it will quickly attract the attention of key people and the media. In this case, the possibility of resolving the crisis will 32
It is important to emphasize that crisis management in a situation of crisis resolution has four phases that are characteristic as process functions. They can be represented as ''four R’s'' of crisis management (Reduction, Readiness, Response, Recovery).
Readiness is a feature that is directly related to the preparation of the plan and its implementation in the case of crisis resolution. Every successful example of crisis management is shaped by precise execution of the operational plan and superior management of communication objectives (Karovic et al, 2015). An operational response saves lives and property. A communication response safeguards the personality and business. Preparedness in immediate operations and communications is essential. ''To be prepared'' includes more than making a plan and starting with occasional practicing. The organization must assess its level of exposure to crisis and development of a strategy of tactical and communication plans (Osmanagic, 2003). The response is the practical execution of operational and communication plan in crisis situations. The leadership should regularly control the plans, monitor crisis response exercises and continually improve skills for crisis situations. They have to be
Serbian Project Management Journal, Volume 6, Issue 1, November 2016
psychologically and physically prepared for the shock and stress that a crisis may cause. Recovery is the final phase in the process of implementation of the crisis resolution that should return the organization to its normal functioning after the crisis. The effects of the crisis management system are constantly updated and revised in the first two phases of the preparations for the other two which practically constitute the crisis management system. (Hamblin, 1958) In order to be able to talk about stabilizing the situation after the crisis, it is necessary to focus on the real causes of the crisis, not exhausting oneself with raising the charges and finding someone to blame for the current situation (Katancevic and Karovic, 2016). The need for constructive attitude focused on the future rather than wasting the necessary energy on the past is highlighted. This is exactly the point where the following question arises: Is it possible to get out of the crisis and how? The recovery phase contains numerous types of activities (actions) undertaken in response to the consequences of crises and contingencies. The recovery activities include official announcement of the end of the crisis, staying in contact with the media and collaborative organizations providing support to the staff of the organization and assessment of the level of training of the organization (lessons learned). Return to normal activities requires an official announcement that the effects of the crisis no longer exist. Although the situation has gradually disappeared, it is necessary that the command remains in contact with the media and collaborative (partner) organizations (Osmanagic, 2003). This allows the realization of a long-term programme for solutions identified during the response phase. Individual attention should be focused on supporting the employees in the organization who may suffer from stress or extreme exhaustion as a result of the crisis. Finally, the recovery phase should include a process of organizational learning, to assess
the lessons learned from the experience. Crises and contingencies can have positive and negative effects on the professional and public image of the organization. In any respect, organizational interest may bring about failures that reflect the components in crisis – crisis management. An organization that has successfully recovered from the crisis may believe that it is now ready to overcome any similar situation. In contrast, another organization that has hardly survived the crisis may realize that it is very difficult to go back and look back and try to overcome what was a painful lesson from experience. Sensitive organizations will try to block the opportunity to make a formal review and careful investigation without pinning the blame for what was poorly done. Such organization will emphasize an increase in its organizational capabilities to prepare for other crises and contingencies in the future. Each management process begins with the projection, which can be defined as the process of setting future goals, assumptions about the environment in which specific activities need to be implemented, selection of the course of action, means and method of achieving goals. Projection implies an analysis of opportunities and possibilities for the organization in a changing environment, the overall potentials, strengths and weaknesses, alternative development trends, etc. The projection here does not mean the precise and formal short-term and long-term projects, but a long-term strategic orientation of the organization which implies the diagnosis of the security environment, determining courses of action, the objectives to be achieved thereby, strategy to be chosen for pursuing those goals, and managerial decision-making through all these stages. In that sense, we can speak about the projection of stabilizing the situation after the crisis, which includes certain processes: rehabilitation, normalization, and expansion. 4.1. Rehabilitation Rehabilitation means taking a set of measures to restore and return the system and 33
S. Karović, G. Radovanović, H. Radončić
organization to their previous functional and working condition. The essence of crisis management in this situation lies in specific measures connected with the actions that an organization takes with a view to overcoming the consequences of a crisis. (Lindell et al) This paper is not intended to address the concrete measures but to define actions through a project in order to overcome the consequences of the crisis. This is closely connected with reactive crisis management since it practically goes close to the heart of the future organizational restructuring and creation of the primary values with clear and defined efficiency goals. The main goal of rehabilitation is to alter the strategic position of the organisation by way of abandoning the position it used to have or by maintaining the position in the form of systemic withdrawal from certain activity domains with simultaneous achievement of a positive position for particular activity areas significant for the society or some other line of industry. Rehabilitation means building a model of the future. Assumptions relevant to the future are attitudes that should be perceived using general consequences and consequences affecting the operation of an organization (Osmanagic, 2003).
4.2. Normalization Normalization of the situation has both physical and social dimensions that stem from physical and social impacts. Accordingly, recovery from a crisis includes actions taken so that persons affected by the crisis could deal with the victim situation. The population must find the strength focused on a strategy of facing the loss of the effective support of their loved ones and the strategy to face the problem of the loss of physical resources needed for income generation in existential development. Likewise, companies have to deal with the problem of a lack of trained personnel that try to find a place to transfer their households to and continue to lead an illusion of a normal life. Normalization includes actions taken to deal with material damage as well. Decisions on a timely rehabilitation are effective only if they make up an integral part preventive planning and if they are simply implemented concurrently with the process of a Contingency Plan implementation (Figure 1). The position that it is accepted today is that the settlement of a crisis includes a series of activities – some are conducted in sequences, other ones are synchronized. Attempts to precisely define the differentiated stabilization phases are limited due to the very significance of the recovery process and the crisis exit.
Crisis events Emergency preparedness reduction
Reduction
Urgent Response
Short-term recovery Reparedness for stabilization
Comprehensive design To mitigate the project the Design for stabilization: - Getting Support - Organization - Defining goals - Development policy - Start implementation
Long term recovery / reconstruction
Day 0
Day 3
Day 21
Figure 1: Ratio of rehabilitation to other leadership activities in the project (Lindell et al) 34
Serbian Project Management Journal, Volume 6, Issue 1, November 2016
Normalization phase implies that certain activities are to be carried out, i.e. that the areas with main issues that require immediate attention are to be identified. This primarily refers to the damage assessment process, short-term recovery, long-term reconstruction, stabilization, and management.
addition to consideration of errors and deficiencies, repeated crises cannot be excluded, especially in the circumstances of increased uncertainty and rapid changes. (Karovic, 2014)
4.3. Expansion
The paper highlights the most important elements of the project approach to stabilization of the situation after the crisis. Developing a project is essential for any organization and the described phases of recovery are necessary to achieve a defined objective.
Bearing in mind the typology of crises and their identification, it is very important to determine the type of crisis, as it is another thing which defines the mode of work in the post-crisis period. Probably the oldest and the simplest typology differentiates between the crises caused by natural factors and those caused by a human factor (technological ones). (Rosenthal and Kouzmin, 1993). The expansion of this classification also includes the third sub-group – social crises. (Rike, 2003) The expansion occurs suddenly and causes a very rapid development, as the previous two phases have been successfully completed. In this regard, the organization becomes stable and functional. The critical developmental domains and issues that emerge as priorities at this stage are different in relation to the previous one, and this change needs to be recognized in the organization as a whole. This requires timely recognition of the onset of the next phase which depends on the development and establishment of solid change management mechanisms stated in the project. Most often it is a set or complex of criteria by which one can recognize the onset of the second phase and refers to the scope of activities that are performed. The tasks of crisis management at this stage are turned to resources and functionality of the system. At this stage, survival is not called into question, but complete stability and development are considered. Finally, the project approach to stabilisation of the situation after the crisis should be seen as an essential and integral part of a responsible management of an organization in which the risks and opportunities are assessed in a multitude of decisions, whereby, in
4. CONCLUSION
In the entire process of stabilization of the situation after the crisis, defining the precise activities in each phase has effects on its successful implementation, and it is very difficult to differentiate between them. The line between crisis-response and stabilization is not clear because some sectors of the community can be engaged within a project of the public authorities, while others are to be engaged in the stabilization of the situation, and some organizations will be responsible for both types of activities at the same time. Special emphasis was put on the importance of functioning of the elements of relations between the rehabilitation activities and other activities of the leadership in the process of recovery from the crisis. The structure of the project of stabilization of the post-crisis situation encompasses a phased approach of virtually all vital elements necessary for its purpose and thus ensures the successful operation of the organization in the process of stabilizing the post-crisis situation. LITERATURE Bedenik Osmanagic, N. (2003). The crisis as an opportunity. Zagreb: School books. Boin, A,. Hart., P. (2003) “Public Leadership in Times of Crisis: Mission Impossible?” Public Administration Review, Vol 63, No.5, pp. 544-553. Boisvert, Patrick., Moore, Raphaël. (2003). Crisis and Emergency Management: A
35
S. Karović, G. Radovanović, H. Radončić
Guide for Managers Public Service of Canada, Canadian Centre for Management Development. Karovic, S, Radoncic, H, Radovanovic, G. (2015) Crisis project: Basis of crisis resolution. Belgrade: Serbian Project Management Journal, vol. 5, No. 1, p. 6775. Hamblin, R., L.: (1958) Leadership and Crisis, “Sociometry 21”. p.322. Katancevic, V., T., Karovic, S. (2016). Identifying hazards assessment and risk monitoring as a form of early warning. Belgrade: Vojno delo, vol. 68, No. 2, p. 84-107. Karovic, S. (2014). Crisis management. Belgrade: Media Center '' Defence ''. Karovic, S., Komazec, N. (2009). Crisis and crisis management. Beograd: Novi glasnik, No 2.
36
Luecke, R.. (2005). Crisis management, Zagreb: Zgombic&Partneri. Michael K. Lindell, Carla S. Prater, Ronald W. Perry. Fundamentals of Emergency Management, p. 314, (http://training.fema.gov/EMIWeb/edu/fe m.asp). Pomjan, K. (1987). The crisis in the future, an article published in ''O-crisis'', prepared by Christopher Michalski. Novi Sad: Literary Cooperative Novi Sad. Rike, B. (2003). "Prepared or Not ... That is the Question Vital," The Information Management Journal, Vol. 37, No. 6, pp. 25-33. Rosenthal, U. and Kouzmin, A. (1993). "Globalizing an Agenda for Contingencies and Crisis Management: An Editorial Statement" Journal of Contingencies and Crisis Management, Vol 1, No 1, pp. 1-12.
Serbian Project Management Journal, Volume 6, Issue 1, November 2016
BARRIERS TO THE IMPLEMENTATION OF SUPPLY CHAIN MANAGEMENT (SCM) IN THE DELIVERY OF CONSTRUCTION PROJECTS Benedict Amade Federal University of Technology, Owerri, Nigeria Abstract: This study sought to identify and evaluate the barriers to the implementation of SCM in the delivery of construction projects in Owerri, Imo State. The study adopted an explorative research design and a snow balling sampling technique in the selection of its respondents. 112 professionals responded out of which 67 valid responses were returned. 24 barriers to SCM implementation were identified from the literature. Findings from the study using factor analysis and the analytical hierarchy process (AHP) reveals the following as barriers to the implementation of SCM; lack of understanding of SCM concepts, deficiency of procurement system/process, inability to develop measures for monitoring alliance, deficiency of mutuality, failure to broaden the supply chain vision beyond procurement or product distribution, dearth of the appropriate information technology application, improper scheduling requiring flexibility in operations, lack of the appreciation of others performance, fear of loss of control and resistance on greater contribution. Key words: Barriers, Supply Chain Management, Analytical Hierarchy Process, Factor Analysis, Construction Projects services normally involves the mix of the independent entities, several organizations are 1. INTRODUCTION usually involved in the supply chain. Most organizations are of the view that the value they provide to the end users of their Supply chain management (SCM) is a concept product is as a result of the totality of all the that originated and was developed by the value adding activities ensuing along the manufacturing industry (Vrijhoef & Koskela, supply chains (SC). In the same vein, some 1999). Its emergence originally was from the organizations are aware of the need to just-in-time (JIT) delivery system as part of identify, understand and manage their SC the Toyota Production System. The JIT within their organization as well as co-operate system was used to regulate supplies to the with other sister organizations in the chain in Toyota Production System in a right-smalla bid to successfully manage all issues within amount at the right time with the sole aim of their SC (Charter, Kielkiewicz-Young, decreasing inventory, while also regulating Young, & Hughes, 2001). Supply chain supplier’s interaction with production according to Tiwari, Sheperd and Pandey facilities efficiently and effectively. (2014), is defined as a network of According to Akintoye, McIntosh and organizations or entities that are tied through Fitzgerald (2000), SCM is defined as the an upstream and downstream linkage via the delivery of enhanced end user and economic different processes and activities with a view value through the synchronization of the to producing valuable products or services for flow/movement of physical goods and their end users. Wiig (2001), opined that information from the source node to supply chain is made up of activities and consumption node. Akintoye et al. (2000) information that are associated with the further opined that the individual definitions processing of goods and services from the of SCM hinge on organizational restructuring crude stage of production until it gets to the and the achievement of company-wide final consumer. In as much as the collaborative culture. SCM embraces different transformation of the individual products and business units, processes, as well as firms Corresponding author. Email:
[email protected] ISSN 2217-7256 (online) © 2016 YUPMA www.spmjournal.rs
37
B. Amade
which are of importance to service end users, order fulfillment, customer service management and product development while also promoting the integration of firms belonging to an SC. This results in an increase in the overall SC performance, overall business-business growth and end user satisfaction, resulting to one of the most relevant aspects for competitive advantage (Hernandez, Poler, Mula, & Peidro, 2008). As a result of the benefits derived from the application of SCM principles by the manufacturing and production sectors (Akintoye et al., 2000) few construction firms are beginning to see the need to adopt and inculcate SCM principles and ideas into their activities and help address problems associated with adversarial, interorganizational purchaser-supplier relationships as evident in most construction project related activities. According to Akintoye et al. (2000); Amade 2016; Saad, Jones and James (2002), SCM in the construction industry is still in its infancy stage, and its importance to the construction industry and projects are unquantifiable. SCM can be adduced to be an epitome of evolutionary and cumulative innovation which is said to have emanated from the internal programmes of an organization by reducing waste and adding value with the sole aim of improving the overall effectiveness of the entire SC. The construction industry in any country plays a key and dominant role in uplifting the economy of such a country (Djokoto, Dadzie, & Ohemeng-Ababio, 2014). Activities of the industry include procurement of goods and services as well as the erection of various physical infrastructures. The industry has also contributed to the growth of the nation’s gross domestic product (GDP), gross fixed capital formation (GFCF) and the provision of employment opportunities (Ayangade, Wahab, & Alake, 2009). In advanced countries of the world, the construction sector contributes about 22 percent to GDP and provides 12 percent of the jobs for the nation. While in Nigeria, the contribution to GDP is about 16 percent and job creation 20 percent. Delays and cost overruns according to Ayodele and Alabi (2011) has dealt heavily on and affected the construction industry in Nigeria where the investments account for 38
over 50 percent of the gross fixed capital formation. These consequences emanated as a result of the temporary nature of the sectors SC and short-term nature of most construction projects. In as much as it has become necessary to unravel the reasons behind the inability of construction projects to benefit from the ensuing benefits of modern day innovations the SCM has brought, this study becomes eminent. A critical assessment of the ubiquitous construction activities in Nigeria with its attendant future prospect as envisaged by the Global Forecast for the Construction Industry (Betts, Robinson, Burton, Leonard, & Sharda, 2013), it behooves on all and sundry to come up with means of enhancing the productivity of the Nigerian construction industry which according to Hope (2012) is still taking the back seat in comparison with the manufacturing and service industries. The Nigerian construction sector is under global pressure and needs to catch up with their counterparts. The contribution of the construction industry via its performance and potentials has been affected by a compendium of issues ranging from waste emanating from construction materials, re-works, scraps and stakeholder’s dissatisfaction amongst others (Nawaz & Ikram, 2013). The majority of the tools and techniques currently deployed in a bid to address some of the envisaged problems are obsolete and have outlived their main essence of existence. A handful of the construction firms within the industry are bedeviled with difficulties mainly in the areas of delivering value to the end users of their products and on schedule (Ayodele & Alabi, 2011; Amade, 2012; Ayangade et al., 2009). Cases of customer dissatisfaction stemming from the inability of end products and services to meet the needs and expectations of customers. One of the prevalent problems facing the Nigerian construction industry according as opined by Aibinu and Jagboro (2002) is the rate of delays bedeviling project delivery. In China, for instance, the construction industry is still being faced with issues bordering on low productivity, poor quality projects, and lack of profit (Pheng & Shang, 2011). The industry is so large and unstable as well as susceptible to fluctuating demand cycle, uncertainty in
Serbian Project Management Journal, Volume 6, Issue 1, November 2016
production and most specifically has a myriad range of skills and personnel. These and other attendant issues have affected the industry to a greater extent thus leading to problems. While in Ghana, for instance, delays according to Fugar and Agyankwa-Baar (2010) often gives rise to schedule and cost overruns, disputes, litigation and subsequent abandonment of projects which often than not culminates into one of the major problems confronting the construction industry in Ghana. The construction industry is characterized by complexity (Aloini, Dulmi, Mininno, & Ponticelli, 2012) and constrained by time. The complex nature makes the industry prone to decentralization of its activities and functions which invariably makes it prone to conflicts among the various stakeholders. According to Ayangade et al. (2009), the Nigerian procurement system has been bedeviled by the lack of compliance with the principles of tendering amongst the different public agents which resulted in huge loss of public funds to the tune of billions of naira. A myriad of problems affects the construction industry most specifically during the bidding phase. An incompetent contractor may tend to introduce a cover price or lower his/her cost in order to be favorable and win the contract. Such an unholy act could undermine the integrity of the entire and subsequent phases of the contract leading to awarding the contract to an incompetent contractor which most often than not affects the entire SC linkages leading to failure of the project. A lot of waste associated with the delivery of construction projects via the traditional method as exemplified by (Amade, 2012; Ayangade et al., 2009) in the Nigerian construction industry precipitates into a high cost of construction, poor quality projects delivered to the end user. These are a direct consequence of the traditional method of delivering construction projects as against the present day collaborative strategies inherent in most value adding, waste reduction principles associated with SCM, total quality management (TQM), six sigma, lean, etc. This study was designed to identify and evaluate barriers to the implementation of SCM in the delivery of construction projects in Nigeria, and to draw conclusions as well as make necessary recommendations on the
incorporation of SCM in the delivery of construction projects in Nigeria. 2. LITERATURE REVIEW SCM according to Hope (2012) is considered an “umbrella term” encapsulating areas like partnering, lean manufacturing and as such could be the ultimate reason why its meaning is still shrouded in controversy. Different organizations define SCM in different ways thus reflecting the nature of their business inputs and outputs. For some, SC is related to purchasing and procurement, while others see it as a warehousing, distribution and transportation venture. To clear the ambiguity about the meaning of SCM, a clear definition of the term is eminent. Xue, Li, Sheng and Wang (2005) opined that "SCM can be considered as the coordination of distributed decision making of organizations or participants on material flow, information flow, human flow, cash flow in SC from the systems perspective." SCM according to Akintoye et al. (2000) is "the process of strategically managing the movement and storage of materials, parts, and finished inventory from suppliers, through the firm and to customers." According to CuttingDecelle et al. (2007), SCs exists in both service and manufacturing organizations. The complexity inherent in the chain does vary greatly from one industry to the other. They further stated that a realistic SC has multiple end products with shared components, facilities, and capabilities which give rise to a situation where the flow of materials does not lie within the arborescent network while considering the various modes of transportation and possessing deep, large bill of materials at the tail end. 2.1 The Emergence Construction
of
SCM
in
SCM according to (Hai, Aminah, Syuhaida, & Wei, 2012; Wirahadikusumah & Abduh, 2010) emerged as an important concept in the construction industry in the mid-1990s. Furthermore, (Hai et al., 2012; Saad et al., 2002; Venkataraman, 2007; Viswanadham & Kumar, 2006) opined that the acceptance of the concept of SCM in the construction sector has been slow. In as much as the construction sector contributes significantly to the 39
B. Amade
economic growth of any country, (Hai et al.,2012), it contributes between 3 to 6 percent of GDP while employing more than 111 million construction workers worldwide. Latham and Egan in their respective reports recommended how the construction sector can change its tide towards the most efficient destination of efficiency in the SC through partnering arrangements and innovative approaches (Egan, 1998; Latham, 1994). Construction supply chain (CSC) according to Wang and Xue (2004) is made up of all the businesses and organizations that are involved in the construction process from the extraction of raw materials to the eventual demolition of a facility and subsequent disposal of its components. Wang and Xue (2004) further opined that CSC exists in three different forms viz; the primary SC, that delivers materials that are incorporated into the final construction deliverable; the support chain, which makes provision for equipment, expertise, and materials that, propels the construction process and finally, the human resource SC which involves the supply of labour. In a nutshell, Hai et al.(2012) conclude that CSC consists of firms that are involved in the upstream and downstream contractual relationships whose sole aim is to deliver a commodity, products, and services that are related to the business of construction. They further stated that the key individuals not only vary from one another but that they are linked to achieving the aims and objectives of the project. SCM according to Petrovic-Lazarevic, Matanda, and Worthy (2006) is seen "as a network of organizations in delivery channels that produce value for and contributes to achieving and sustaining a competitive advantage." Petrovic-Lazarevic et al.(2006) further opined that SCM in the building and construction industry deals with the management of construction materials in a relationship with contractors, suppliers, and distributors. Within the construction industry, the SC can be construed to be first, the client at the top followed by the designers, contractor, specialistcontractors/subcontractors/suppliers making up the various levels of the chain (Ahmed, Azhar, & Ahmad, 2002). Demands are meant to flow down the link regarding 40
information in the form of project briefs, drawings, schedules, work orders, etc. while the flow of goods and materials moves in the opposite direction. Ahmed et al.(2002) further stated that the management of the CSC had been characterized by a lot of problems stemming from the series of fragmentations inherent in the industry. And as such, the emergence of the problems has created opportunities for stakeholders to be more involved in project life cycle issues. 2.2 Barriers to the Implementation of Supply Chain Management in Construction Project Delivery There exists a dearth of research on the barriers to the implementation of SCM in the literature. Although few authors were able to carry out some work in this area as discussed. Different scholars have tagged the construction industry of being too slow in the application/deployment of SCM techniques which has been adduced to have worked perfectly within the manufacturing and service sectors (Akintoye et al., 2000; Saad et al.,2002; Viswanadham & Kumar, 2006). In as much as the Egan’s report clearly spelled out that the SCM techniques have shown evidence of a rewarding outing in the construction industry via the improvement of the quality and efficiency of a project if properly applied. A lot of factors appear to be responsible to the slow and the nondeployment of the technique. Benton and McHenry (2010) identified the following barriers to construction supply chain management (CSCM) as; fear of loss of control, inability to share information on project, extent of the project’s complexity, lack of understanding of the client, deficiency of mutuality, myopic strategies. Akintoye et al.(2000) in a study found the following barriers to the nonapplication of SCM in the construction industry. They include; the dearth of top management commitment, unclear strategic benefits, partners low level of commitment, lack of understanding of the SCM concept, the dearth of appropriate information technology, lack of the appropriate organizational structure for supporting the system. While Ahmed et al.(2002) identified the following reasons as responsible for the slow application of SCM in construction. They include; inability to
Serbian Project Management Journal, Volume 6, Issue 1, November 2016
develop measures for monitoring alliances, failure to broaden the SC vision beyond procurement or product distribution to include other business processes, the dearth of trust within and outside a firm. Wong, Tsoi, and Cheung (2004) identified obstacles impeding the implementation of SCM in construction as; lack of appreciation of other’s performance, discouraged innovation, deficiencies of the procurement system, lack of common standard for collaboration, ignorance on the contributions and needs of subcontractors and suppliers, resistance on greater contribution, high cost amongst others. Viswanadham and Kumar (2006) on the other hand stated that certain impediments do exist as barriers to SCM implementation in the construction industry. The notable ones include; differences in work cultures of stakeholders, improper scheduling requiring flexibility in operations, short-term project thinking. 3. RESEARCH METHODOLOGY The instrument for primary data collection was a structured questionnaire and a semistructured interview. The study adopted the descriptive research design comprising both the quantitative and qualitative analysis. As opined by Kothari (2004), descriptive research consists of surveys and fact findings bordering on the issues in question. A total of one hundred and twelve (112) professionals responded out of which 67 returned valid and usable questionnaires representing a response rate of 59.82%. The target populations were professionals within the construction industry which comprises of architects, builders, civil/structural engineers, estate surveyors, project managers, and quantity surveyors who are currently engaged in the execution of construction project within Imo state, Nigeria who either as corporate members or fellows of their respective professional institutions participated in the study. The non probabilistic sampling technique termed "snow ball" was deployed in the selection of the respondents. The reason for deploying this sampling technique was as a result of the nonavailability of a sample frame of the of sphericity from which a reliable sample size could be drawn from. The questionnaire used for the survey included (among other items) twenty-four (24) responses to choose from. In as much as the responses did not represent a
total inventory of the barriers to the implementation of SCM, they constitute the most cited from the literature. This study was part of a pilot study of an ongoing Ph.D. study where interviews with academic and industry experts was carried out to improve the validity and content of the questionnaire from where the list of 24 variables was selected and after that adopted for this study. The professionals were asked to indicate the extent to which certain responses pertinent to barriers to the implementation of SCM in the delivery construction projects were observed in their firms. The 24 barriers were identified from the literature review earlier conducted in the course of the study. Each of the respondents was asked to rate each of the barriers to SCM implementation on a scale of 1 (strongly disagreed) to 5 (strongly agreed). Data collected for the study were analyzed using both the descriptive and inferential statistical tools. The descriptive tools used are frequency, percentages, tables, etc. In this study, principal factor extraction with varimax rotation was carried out using SPSS 17.0 on the 24 items of the barriers to the implementation of SCM to construction project delivery for a sample of 67 valid responses. There after analytical hierarchy process (AHP) was used to calculate the pairwise and constrained matrices, weighted scores and Eigen values using a Microsoft Excel programmed software. In analyzing the responses using the AHP, findings from the outcomes of the opinions of eight professionals interviewed in this study were adopted in determining the priorities of the ten (10) main criteria relative to the pair-wise comparison which served the basis for the analysis using AHP after the factor analysis was carried out. The next stage of the iteration was to find the relative priorities of criteria or alternatives implied by the comparisons. The relative priorities are usually computed using the theory of eigen vector and the consistency check carried out at the stage of selection. In order to evaluate the consistency of the results, three (3) vital components were required. The vital components are; Consistency Index (CI), Random Index (RI), and Consistency Ratio (CR). For a consistent reciprocal matrix to of the, the largest eigenvalue must be equal to the number of comparisons. If the value of the CR is smaller 41
B. Amade
or equal to 10 percent (0.1), the level of consistency is within the acceptable threshold, and the decision is accepted. But, if the CR is
greater than 10 percent, the outcome of the subjective judgment should be revisited and reviewed.
4. RESULTS AND DISCUSSIONS Table 1: Demographic Responses Respondents Designation Frequency Percentage Project Managers 9 13.43 Engineers 14 20.90 Architects 10 14.93 Builders 11 16.42 Quantity Surveyors 23 34.33 Total 67 100% Academic Qualification Frequency Percentage OND/ND 8 11.94 HND/B.Sc/B.Tech/B.Eng 38 56.72 MBA/M.Sc/M.Eng 17 25.37 PhD 4 5.97 Total 67 100% Years of Experience in the Industry Frequency Percentage 1-5 years 8 11.94 6-10 years 12 17.91 11-15 years 18 26.87 16-20 years 29 43.28 Total 67 100% Type of Construction Project Involved in Frequency Percentage Buildings 25 37.31 Roads 18 26.87 Bridges 14 20.90 Others 10 14.93 Total 67 100% OND=Ordinary National Diploma, ND= National Diploma, HND= Higher National Diploma. Table 1 shows the respondents designation, the majority of the respondents are quantity surveyors with the highest percentage of (34.33%), this is followed by engineers (20.90%), builders (16.42%), architects (14.93%), etc. The majority (56.72%) of the respondents have first degree equivalent as qualification, 25.37% master’s degree equivalent, followed by respondents with OND/ND (11.94%), and lastly the respondents with Ph.D. (5.97%). The majority (43.28%) of the respondents have between 16-20 years in the construction industry, followed by respondents with 1115 years experience (26.87%), 6-10 years 42
experience (17.91%) and lastly the respondents with 1 – 5 years experience (11.94%). The types of construction projects previously involved by the respondents were identified, wherein building related projects had the majority of the share with (37.31%), followed by road projects with (26.87%), bridges at (20.90%) and lastly others like public utilities, etc. with (14.93%) respectively. The public utilities consist specifically of tourism and recreational related projects. The response from the findings indicates that since the
Serbian Project Management Journal, Volume 6, Issue 1, November 2016
majority of the respondents have spent 16-20 years in the industry, it implies that the respondents must have understood the technicalities as well as gained ample experience in dealing with issues bordering the industry. Hence they are fit to contribute their wealth of experience in the survey. The findings demonstrate that majority of the respondents possesses the requisite educational/academic qualifications to
practice and provide the needed information in supporting the findings of this research. On the types of construction projects the respondents were involved in, the findings show that the respondents possess vast experience and the requisite knowledge in the execution of different types of projects. The experiences gained from these projects gave them the opportunity to aptly provide more insightful and valuable information for purposes of this study.
Table 2: KMO and Bartlett's Test KMO and Bartlett's Test Kaiser-Meyer-Olkin Measure of Sampling Adequacy. Bartlett's Test of Approx. Chi-Square Sphericity df Sig. The following tests are required for the appropriateness of the factor analysis for the factor extraction, including the KaiserMeyer-Olkin (KMO) measure of sampling adequacy, anti-image correlation, the measure of sampling activities (MSA) and Bartlett's test of sphericity. The results of these tests are shown in Table 2. The 24 factors is not to factor analysis with principal component analysis and varimax rotation. The first stage of the analysis is to determine the strength of the relationship among the variables, based either on correlation coefficients or partial correlation coefficients of the variables. The Bartlett's test of sphericity tests the hypothesis that the correlation matrix is an identity matrix. In our case the value of the test statistic for
.475 438.171 276 .000
sphericity is not too large (Barlett test of sphericity =438.171) and the associated significance level is small (p=0.000), suggesting that the population correlation matrix is an identity matrix. Observation of the correlation matrix of the barriers to the implementation of SCM in construction project delivery indicates that they all have the significant correlation at the 5% level, indicating that there would be no need to eliminate any of the variables from the principal component analysis. The value of the KMO statistic is 0.475, which according to Pallant (2005) should be within 0.6 or above for a satisfactory result. The value is somehow satisfactory for factor analysis. In a nutshell, these tests indicate that factor analysis is appropriate for the analysis.
Table 3: Barriers to the Implementation of SCM in Construction Project Delivery Component Matrixa
Barrier s to SCM
DEARTH OF TOP MGT COMM UNCLEAR STRATEGIC BENEFITS
Component ABBREV COMMU IATION NALITI S ES EXTRA CTED 1 DTM .686 USB
2
3
4
5
6
7
8
9
.694
43
B. Amade
PARTNERS LOW LEVEL
LLC
.581
INABILITY TO SHARE INFORMATION
SIP
.734
FAILURE TO BROADEN SC VISION
FSV
.752
DEFICIENCY OF MUTUALITY
DOM
.628
FEAR OF LOSS OF CONTROL
FLC
.743
LACK OF LUS UNDERSTANDING
.761
EXTENT OF PROJECT COMPLEXITY
PRC
.605
LACK OF LUC UNDERSTANDING OF CLIENT
.660
LACK OF LOS ORGANISATIONAL STRUCTURE
.680
DIFFERENCES IN DWC WORK CULTURES
.607
DEARTH OF IT APPLICATION
DIT
.747
RESISTANCE ON CONTRIBUTION
RGC
.717
INABILITY TO DEVELOP MEASURES FOR MONITORING
DMA
.598
IMPROPER SCHEDULING
ISO
.715
SHORT TERM PROJECT THINKING
SPT
.635
LACK OF APPRECIATION
LOP
.584
DISCOURAGED INNOVATION
DIN
.769
DEFICIENCIES OF PROCUREMENT PROCESS
DPS
.643
LACK OF COMMON LSC STANDARD
.707
IGNORANCE ON CONTRIBUTION AND NEEDS
.724
ISS
DEARTH OF TRUST DTO
.833
HIGH COSTS
.703
44
HIC
.716
.556 .648 .568
.695 .594 .595
.619
.564
.565
Serbian Project Management Journal, Volume 6, Issue 1, November 2016
% OF VARIANCE
11.79 10.42 9.294 9.004 7.16 6.258 5.314 5.067 4.455 2 7 4
CUMMULATIVE %
11.79 22.22 31.51 40.51 47.6 53.94 59.254 64.321 68.776 2 0 3 8 82 0
Extraction Method: Principal Component Analysis. a. 9 components extracted.
1st Component: Table 3 shows that fear of loss of control in the opinion of the respondents should be the most critical barrier to implementing SCM in the delivery of construction projects. This is followed by improper scheduling. The combined effect of the above barriers is 11.792%. 2nd Component: Table 3 shows that inability to develop measures for monitoring in the opinion of the respondents should be the most critical barrier to implementing SCM in the delivery of construction projects. This is followed by lack of understanding, lack of appreciation and deficiency of mutuality. The combined effect of the above barriers is 10.427%. 3rd Component: Table 3 shows that failure to broaden SC vision in the opinion of the respondents should be the most critical barrier to implementing SCM in the delivery of construction projects. This is followed by the dearth of its application. The effect of the above barrier is 9.294%. 4th Component: Table 3 shows that deficiencies of the procurement process in the opinion of the respondents should be the
most critical barrier to implementing SCM in the delivery of construction projects. The effect of the above barrier is 9.004%. 5th Component: Table 3 shows that resistance on contribution in the opinion of the respondents should be the most critical barrier to implementing SCM in the delivery of construction projects alone. The effect of the above barrier is 7.164%. The AHP was after that deployed to analyze the ten (10) factors earlier identified from the five (5) components using the factor analysis. Findings from the outcomes of the opinions of the professionals interviewed in this study were adopted in determining the priorities of the ten (10) main criteria relative to the pairwise comparison which served the basis for the analysis using AHP after the factor analysis was carried out. Details of the analysis using AHP are shown in Tables 4 and 5. Reasons for the deployment of AHP in the analysis is that AHP aids in capturing both the subjective and objective evaluation measures by providing a useful mechanism for checking the consistency of any evaluation thereby reducing bias in decision making (Dalalah, Al-Oqla, & Hayajneh, 2011).
Table 4: Pairwise comparison matrix of the barriers to the implementation of SCM in construction project delivery LUS DPS DMA DIT DOM FSV ISO LOP FLC RGC
LUS 1 0.33 0.33 0.2 0.5 0.2 0.33 0.25 0.33 0.33
DPS 3.01 1 0.5 0.5 0.5 0.33 0.33 0.33 0.5 0.33
DMA 3 2 1 0.5 0.5 0.5 0.33 0.33 0.33 0.2
DIT 5.03 2.01 2.01 1 2.01 1 0.51 0.51 0.51 0.33
DOM 2.01 2.01 2.01 0.5 1 0.5 0.5 0.33 0.33 0.5
FSV 4.98 2.98 2 1 2 1 0.5 0.5 0.33 0.33
ISO 2.98 2.98 2.98 1.98 1.98 1.98 1 0.5 0.33 0.5
LOP 4 3 3 2 3 2 2 1 0.33 0.5
FLC 3 2 3 2 3 3 3 3 1 0.33
RGC 3 3 5 3 2 3 2 2 3 1
45
B. Amade
Table 5: Synthesized matrix of the barriers to the implementation of SCM in construction project delivery λ max = 10.85 , CI= 0.094 , RI= 1.51 , CR= 0.063 < 0.1 OK. LUS
DPS
DMA
DIT
DOM
FSV
ISO
LOP
FLC
RGC
PRIORITY VECTOR
LUS
0.262
0.409
0.345
0.337
0.207
0.319
0.173
0.192
0.129
0.111
0.2484
DPS
0.087
0.136
0.230
0.135
0.207
0.191
0.173
0.144
0.086
0.111
0.1500
DMA
0.087
0.068
0.115
0.135
0.207
0.128
0.173
0.144
0.129
0.185
0.1371
DIT
0.052
0.068
0.057
0.067
0.052
0.064
0.115
0.096
0.086
0.111
0.0768
DOM
0.131
0.068
0.057
0.135
0.103
0.128
0.115
0.144
0.129
0.074
0.1084
FSV
0.052
0.045
0.057
0.067
0.052
0.064
0.115
0.096
0.129
0.111
0.0788
ISO
0.087
0.045
0.038
0.034
0.052
0.032
0.058
0.096
0.129
0.074
0.0645
LOP
0.065
0.045
0.038
0.034
0.034
0.032
0.029
0.048
0.129
0.074
0.0528
FLC
0.087
0.068
0.038
0.034
0.034
0.021
0.019
0.016
0.043
0.111
0.0471
RGC
0.087
0.045
0.023
0.022
0.052
0.021
0.029
0.024
0.014
0.037
0.0354
Table 5 shows the weights of the barriers to the implementation of SCM in the delivery of construction projects in the study area. The
barriers were ranked according to their weights from highest to lowest as described in Table 6.
Table 6: Weights of the Barriers to the Implementation of SCM in construction project delivery based on AHP S/N Abbreviation Barriers Weights 1 LUS Lack of understanding of SCM concepts 24.84%. 2 DPS Deficiency of procurement system/process 15%. 3 DMA Inability to develop measures for monitoring alliance 13.71%. 4 DOM Deficiency of mutuality 10.84%. 5 FSV Failure to broaden the supply chain vision beyond 7.88%. procurement or product distribution 6 DIT Dearth of the appropriate information technology 7.68%. application 7 ISO Improper scheduling requiring flexibility in operations 6.45%. 8 LOP Lack of the appreciation of others performance 5.28%. 9 FLC Fear of loss of control 4.71%. 10 RGC Resistance on greater contribution 3.54%. ∑=100% The results in Table 6 indicates that the main/key barriers to the implementation of SCM includes; lack of understanding of SCM concepts; deficiency of procurement system/process; inability to develop measures for monitoring alliance; deficiency of mutuality; failure to broaden the supply chain vision beyond procurement or product distribution; dearth of the appropriate information technology application; improper scheduling requiring flexibility in operations; lack of the appreciation of others performance; fear of loss of control and resistance on greater contribution. Thus, it 46
could be concluded that these ten (10) barriers are important and should be accorded the necessary attention when confronted with the decision to implement SCM in the delivery of construction projects in the study area. It is also obvious from the findings that the lack of understanding of SCM concepts had a weight of 24.84% and that agreed to some extent with previous studies conducted by Akintoye et al.(2000). The researcher attributed the relatively high weight of the lack of understanding of SCM concepts to the need for an understanding of what SCM
Percentage 24.84 15.00 13.71 7.68 10.84 7.88 6.45 5.28 4.71 3.54
Serbian Project Management Journal, Volume 6, Issue 1, November 2016
entails as this will go a long way in educating professionals within the industry with a view to enabling them to achieve competitive advantage in their construction businesses. Moreover, the weights of the other criterion are reasonable and anticipated by the researcher. The deficiency of procurement systems/processes also has a weight of 15% which indicates to a greater extent its importance in the whole process and also agreed with Wong et al.(2004) findings as the wrong procurement procedure would affect the end product (deliverable) to a greater extent. Inability to develop measures for monitoring alliance has weight equals 13.71%, and that agreed to some extent with Ahmed et al.(2002). Alliance with other parties in any consortium is essential for successful delivery of the envisaged project. The inability to put this in place spells an impending doom in the long run. Deficiency in mutuality also has a considerable weight 10.84% as the barrier to SCM, and this agreed with the findings of Benton and McHenry (2010). Failure to broaden the supply chain vision beyond procurement or product distribution followed suit with a weight equals 7.88% and thus agreed with Ahmed et al.(2002). The tendency of recognizing SCM activities as merely product distribution and procurement still shows a lack of awareness of what present day SCM entails. The need to separate these terminologies, the better for the Nigerian construction industry to appreciate its benefits. Finally, these results represent the opinion of eight (8) professionals who were interviewed in this study via the second part of the questionnaire and not necessarily taken as default values. 5. CONCLUSION 1) The majority of the projects consists of building, roads, bridges as represented by the majority of implemented projects by the construction firms in Owerri, Imo State. 2) It was found that 34.33% of the respondents consist of quantity surveyors, 20.90% engineers, builders, etc.
3) The results of Bartlett's test of sphericity was found to be not too large with a value of 438.171 with a significance level of p=0.000. While the Kaiser-Meyer-Olkin (KMO) measure of sampling adequacy is 0.475, which was confirmed the results of the analysis to be satisfactory for factor analysis to some extent. 4) The results of the twenty-four (24) factors identified from the literature were subjected to factor analysis with principal component analysis and varimax rotation. After the analysis, ten (10) factors from the five (5) components were identified as barriers to the implementation of SCM; the AHP was after that deployed to analyze the factors earlier identified from factor analysis. 6) Based on the findings from the AHP, the followings were identified as barriers to the implementation of SCM in construction project delivery with their corresponding weights; lack of understanding of SCM concepts (24.84%); deficiency of procurement system/process (15%); inability to develop measures for monitoring alliance (13.71%); deficiency of mutuality (10.84%); failure to broaden the supply chain vision beyond procurement or product distribution (7.88%); dearth of the appropriate information technology application (7.68%); improper scheduling requiring flexibility in operations (6.45%); lack of the appreciation of others performance (5.28%); fear of loss of control (4.71%) and resistance on greater contribution (3.54%). Accordingly, the lack of understanding of SCM concepts represents the overriding criterion that should be accorded adequate attention if the Nigerian construction industry is ready to deploy the SCM concept in the delivery of their construction projects. In addition, deficiency of procurement system/process, inability to develop measures for monitoring alliance, deficiency of mutuality, failure to broaden the supply chain vision beyond procurement or product distribution, dearth of the appropriate information technology application, improper scheduling requiring flexibility in operations, lack of the appreciation of others performance, fear of loss of control and resistance on greater contribution represent
47
B. Amade
key barriers to the implementation of SCM in construction project delivery. RECOMMENDATIONS The researcher recommends that professionals within the Nigerian construction industry should in a bid to deploy SCM in the implementation of their construction projects, should give more attention to the following barriers that may tend to hinder them from applying the SCM principles. They include; lack of understanding of SCM concepts; deficiency of procurement system/process; inability to develop measures for monitoring alliance; deficiency of mutuality; failure to broaden the supply chain vision beyond procurement or product distribution; dearth of the appropriate information technology application; improper scheduling requiring flexibility in operations; lack of the appreciation of others performance; fear of loss of control and resistance on greater contribution. ACKNOWLEDGEMENTS This research is partly supported by the FUTO study fellowship and other construction firms who in one way or the other provided valuable information towards the realization of this study. LITERATURE Ahmed, S. M., Azhar, S. & Ahmad, I. (2002). Supply chain management in construction. Scope, benefits, and barriers. Delhi Business Review, 3 (1), 16. Aibinu, A. A. & Jagboro, G.O. (2002). The effects of construction delay on project delivery in Nigerian construction industry. International Journal of Project Management, 20, 593-599. Akintoye, A., McIntosh, G. & Fitzgerald, E. (2000). A survey of supply chain collaboration and management in the UK construction industry. European Journal of Purchasing and Supply Management, 6, 159-168. Aloini, A., Dulmi, R., Mininno, V. & Ponticelli, S. (2012). A conceptual model for construction supply chain 48
management implementation. In: S.D. Smith (Ed.) Proceedings 28th Annual ARCOM Conference, Association of Researchers in Construction Management. (pp 675-685) 3-5 Sept 2012, Edinburgh, U.K. Amade, B. (2012). An evaluation of factors constraining the implementation of public-private partnerships in construction infrastructure projects in Nigeria. International Journal of Science and Engineering Investigations, 1 (9), 106-117. Amade, B. (2016). Development of supply chain management framework for successful construction project delivery in Nigeria. (Doctoral Dissertation of the Federal University of Technology, Owerri), Nigeria. Ayangade, J. A., Wahab, A.B. & Alake, O. (2009). An investigation of the performance of due process mechanism in the execution of construction projects in Nigeria. Civil Engineering Dimension, 11 (1), 1-7. Ayodele, E. O. & Alabi, O.M. (2011). Abandonment of construction projects in Nigeria: Causes and effects. Journal of Emerging Trends in Economics and Management Sciences, 2 (2), 142-145. Benton, W. C. & McHenry, L.F. (2010). Construction purchasing and supply chain management. U.S.A.: Mc GrawHill Companies, Inc, ISBN:978-0-07154886-1, MHID:0-07-154885-8. Betts, M., Robinson, G., Burton, C., Leonard, J. & Sharda, A. (2013). Global construction 2025. A global forecast for the construction industry to 2025. A Report by the Global Construction Perspectives and Oxford Economics, Broadwall House, 21 Broadwall, London SE1 9 PL, U.K. www.globalconstruction2025.com. ISBN:978-0-9564-2078-7 Charter, M., Kielkiewicz-Young, A., Young, A. & Hughes, A. (2001). Supply chain strategy and evaluation. The SIGMA Project, R and D Report, January 2001. Cutting-Decelle, A. F., Young, B.I., Das, B.P., Case, K., Rahimifard, S., Anumba, C.J. & Bouchlaghem, D.M. (2007). A review of approaches to supply chain
Serbian Project Management Journal, Volume 6, Issue 1, November 2016
communications: From manufacturing to construction. Journal of Information Technology in Construction, 12, 73-102. Dalalah, D., Al-Oqla, F. & Hayajneh, N. (2011). Application of the analytical hierarchy process in the multi-criteria analysis of the selection of cranes. Jordan Journal of Mechanical and Industrial Engineering, 4 (5), 567-578. Djokoto, S. D., Dadzie, J. & OhemengAbabio, E. (2014). Barriers to sustainable construction in the Ghanaian construction industry: Consultants perspective. Journal of Sustainable Development, 7 (1), 134-143. Egan, J. (1998). Rethinking construction. A Report of the Construction Task Force (The Egan Report) Department of the Environment, Transport and the Regions, London: HMSO. Fugar, F.D.K. & Agyakwah-Baar, A.B. (2010) Delays in building construction projects in Ghana. Australasian Journal of Construction Economics and Building, 10 (1/2), 103-116. Hai, T.K., Aminah, M.Y., Syuhaida, I. & Wei, L.F. (2012). Reviewing the construction supply chain challenges and construction supply chain management strategic management. International Journal of Civil Engineering and Structures, 1 (1), 8-18. Hernandez, J. E., Poler, R., Mula, J. & Peidro, D. (2008). A collaborative knowledge management framework for supply chains. A UML-based model approach. Journal of Industrial Engineering and Management, 1 (2), 77-103. Hope, R. (2012). A vision for the future of construction: Supply chain management and integration (A Nottingham Trent University JCT Student Essay Competition). Retrieved from http://www.googlescholar.com. Kothari, C. R. (2004). Research Methodology: Methods and Techniques. Second Ed. New Age International Publishers, New Delhi, India. Latham, M. (1994). Constructing the team. A Final Report of the Government/Industry Review of Procurement and Contractual Arrangements in the U.K Construction
Industry. Retrieved from http://www.googlescholar.com. Nawaz, T. & Ikram, A.A. (2013). Benefits and impediments in implementing total quality management in Pakistani construction sector. European Journal of Business and Management, 5 (4), 205227. Pallant, J. (2005). SPSS survival manual: A step by step guide to data analysis using SPSS. Allen and Unwin, Sydney. Petrovic-Lazarevic, S., Matanda, M. & Worthy, R. (2006) Supply chain management in the building and construction industry: Case of Australian residential sector. Working Paper 21/06 Department of Management Working Papers Series, Monash, University. 1-10. ISSN:1327-5216 Pheng, L. S. & Shang, G. (2011). The application of the just in time philosophy in the Chinese construction industry. Journal of Construction in Developing Countries, 16 (1), 91-111. Saad, M., Jones, M. & James, P. (2002). A review of the progress towards the adoption of supply chain management relationships in construction. European Journal of Purchasing and Supply Management, 8, 173-183. Tiwari, R., Sheperd, H. & Pandey, R.K. (2014). Supply chain management in construction: A literature survey. International Journal of Management Research and Business Strategy, 3 (1), 728. Venkataraman, R. (2007). Project supply chain management: Optimizing value, the way we manage the total supply chain. In P.W.G. Morris, and J.K. Pinto, (Eds) The Wiley guide to project technology, supply chain, and procurement management. Published by John Wiley and Sons, Inc Hoboken, New Jersey. Viswanadham, N. & Kumar, V. (2006). Design of competitive Indian construction supply chain networks. 153-192. Vrijhoef, R. & Koskela, L. (1999). Roles of supply chain management in construction. Proceedings of IGLC-7, 2628 July 1999 at the University of 49
B. Amade
California, (pp 133-146) Berkeley, CA, U.S.A. Wang, Y. & Xue, X. (2004). Improving construction performance through supply chain management. Journal of Harbin Institute of Technology, 11.(5), 528-532. Wiig, A. (2001). Supply chain management in the oil industry: The Angolan case. CMI Working Papers, WP2001:6, Chr Michelsen Institute, Norway. Retrieved from http://www.cmi.no. Wirahadikusumah, R.D. & Abduh, M. (2010). Reinforcing the role of owners in the supply chains of highway construction
50
projects. Proceedings of the First Makassar International Conference on Civil Engineering (MICCE 2010) (pp 1321-1328) March 9-10. Wong, P.S.P., Tsoi, J.N.Y. & Cheung, S.O. (2004). Identifying obstacles against implementation of supply chain management in construction. Hong Kong Surveyor, 15 (2), 12-22. Xue, X., Li, X., Sheng, Q. & Wang, Y. (2005). An agent-based framework for supply chain coordination in construction. Automation in Construction, 14, 413-430.
Serbian Project Management Journal, Volume 6, Issue 1, November 2016
TECHNOLOGY RISK ASSESSMENT AS PART OF RISK MANAGEMENT PROCESS Slobodan Malbašić1, Ljubiša Tančić2, Veljko Petrović3 1,3
2
Ministry of Defence, Republic of Serbia Project Management College, University Educons, Serbia
Abstract: Risk management process should include “comprehensive analysis of technology, cost and schedule risk” as well as recommendation “the adequate scrutiny is undertaken by responsible body or PM on technology feasibility, maturity and overall technical risk.” Technology Readiness Levels (TRLs) is an accepted way to describe and measure technology maturity of components, subsystem and of the complex system itself. Through its development complex system with its components need to reach essential technology readiness levels. Technology Readiness Assessment (TRA), as one of the aspects of risk management process, trough the process of defining Critical Technology Element (CTE) and its needed TRL to be included into system, helps us to assess overall technology risk of a complex system. The paper provides overview of TRLs, pros and cons for using it and measures to overcome it, explain how to define CTE and impose the need to include other readiness levels in risk management process, for example, manufacturing or integration readiness levels. In addition, the paper presents a process of assessing hardware technology maturity for EWI components (Explosive Waste Incinerator for the incineration of ammunition elements), which should be a useful tool for application in “technology readiness assessment” driven approach for risk management. Key words: Risk Management, Technology Maturity, Technology Readiness Levels, Technology Readiness Assessment. 1. INTRODUCTION Project management concept was developed with the aim of rational alignment of resources, coordination of the performance of individual activities and realization of the objectives within the planned time, cost and resources. Furthermore, the concept of project management is considering the environment in which the project takes place and reach planed goals and adapts to different users and varying surroundings. Project management process is professionalized and standardized through development of books of knowledge and standards, research in the fields of projects, competencies and project organizations and publishing of results in academic papers. The most respectable association are IPMA International Project Management Association, PMI - Project Management
Institute, and in the Republic of Serbia it is YUPMA – Serbian Project Management Association. Project Management Body of Knowledge (PMBOK), the product of IPMA, is a collection of processes and knowledge areas accepted as the best practice for the project management profession. As an internationally recognized standard, it provides the fundamentals of project management, irrespective of the type of project either construction, software, engineering or automotive, etc. PMBOK (4th Edition) recognizes five basic process groups (initiation, planning, executing, controlling, closing) and nine knowledge areas (integration management, scope, time, cost, quality, human resources, communication, risk and procurement management) typical of almost
Corresponding author. Email:
[email protected] ISSN 2217-7256 (online) © 2016 YUPMA www.spmjournal.rs
51
S. Malbašić, Lj. Tančić, V. Petrović
all projects. Processes overlap and interact throughout a project or phase. 2. PROJECT RISK MANAGEMENT The risk is immanent to every project and hence risk management process is an integral part of project management concept. Figure 1 shows the risk as a function of the probability
and the consequences of risky events (with its impact) will have on the project's objectives (certainty that the project is completed) trough the project phases. It is clear that at the stages of initiation and planning of the project, to the risk must be given special attention. For this purpose, a different methodology for determination of project risks were developed.
PROJECT MANAGEMENT PROCESS GROUP INITIATING PROCESS GROUP
PLANNING PROCESS GROUP
EXECUTING PROCESS GROUP
MONITORING & CONTROLING PROCESS GROUP PROCESS GROUP
CLOSING PROCESS GROUP
RISK IMPACT RISK PROBABILITY
UNCERTAINITY CERTAINITY
Figure 1: Risk components level during project management process It is worthwhile to mention YUPMA methodology for risk management, which consist of the four very comprehensive phases: risk identification, risk analyze and assessment, risk avoidance planning and reaction, risk control measurement (Petrovic, Jovanovic, & Rakovic, 2010).
KNOWLEDG E AREAS
Another methodology for risk management in the project was proposed by PMI in its manual PMBOK. According to PMBOK, risk management process (risk planning, risk assessing, risk mitigation, risk monitoring and documentation) is a part of project planning phase (figure 2).
PROJECT MANAGEMENT PROCESS GROUP INITIATING PROCESS GROUP
PLANNING PROCESS GROUP
EXECUTING PROCESS GROUP
RISK -PLAN RISK MANAGEMENT MANAGEMENT -IDENTIFY RISK -PERFORM QUALITATIVE RISKA ANLYSIS -PLAN RISK RESPONSE
MONITORING & CONTROLING PROCESS GROUP PROCESS GROUP
CLOSING PROCESS GROUP
MONITOR AND CONTROL RISK
Figure 2: Project management process and risk management knowledge areas cross-section RM is event-driven approach, and through using technical, cost, schedule or supportability information channels, ensures that each milestone in 52
development/acquisition process, demonstrates achievements of engineering design to meet user requirements (or have adequate and supportable information to
Serbian Project Management Journal, Volume 6, Issue 1, November 2016
proceed to the next phase) (Wright, 2011, p. 90). The key to successful risk management is a development of risk management plan – RMP, as early as possible in project planning phase. Later this plan will be reviewed and updated, through project management process. RMP is a documented source of risk information inherent to designated project or program. Basic information that each RMP should have are: description of project/program, roles and responsibilities for people included in process, tools and techniques used for identifying, assessing, monitoring and mitigation risks,
separate sections addressing each risk management phase, documentation system, database information, etc… However, RMP should be tailored to specific situation (Wright, 2011). 3. SOURCE OF RISK A different source of risk can be found as it presented in figure 3 (The Orange Book, Management of Risk – Principles and Concepts, 2004). Speaking of technological risk does not mean that in project planning process other risk sources should be avoided or not consider.
OPERATIONAL RISK
CHANGIES
EXTERNAL RISKS
Relating to existing operations – current delivery and building, maintaining capacity and capability
Change programs, New projects, New policies, New strategy
Political, Economic, Sociocultural, Technological, Legal/regulatory, Environment
EFECTED PROJECT OBJECTIVES Time, Cost, Performance, Safety, Sustainability
Figure 3: Internal and external risks and their influence to project objectives The picture above shows more common categories of grouping risk, intended to help organisations check that they have considered the range of potential risks which may arise. Whatever the purpose of organisations may be (deliver the service, manufacturing process, maintenance process, research and development), the delivery of its objectives is surrounded and effected by risk or uncertainty which both poses treats to success or from another side, can offer opportunity for increasing success. In addition to this, it is useful to mention a different view of risk. There are government and contractor views of risk. The government view of risk is particularly focused on defence acquisition budget, while the contractor view coverage two main categories: program risk, which primary focus is on performance matters (technical issues, design risk), and business risk who focuses on profit (Wright, 2011, p. 6). In this paper, w--e are considering
technology risks: the risk that project will not achieve its objectives due to an underpinning technology not maturing in required timeframe (Technical Risk Assessment Handbook - TRAH Version 1.1, 2010). A mature technology is a technology that has been in use for so long that most of its initial faults and inherent problems have been removed or reduced by further development. In some contexts, it may also refer to technology which has not seen widespread use, but whose scientific background is well understood. These explanations introduce us into the world of Technological Risk Levels (TRL), explained later in the paper. The paper will present necessary maturity levels of technology for EWI (Explosive Waste Incinerator for the incineration of ammunition elements or small arms ammunition) together with TRA process as part of risk management process. Aspect of technological risk (introduced trough TRL) can provide leverage in
53
S. Malbašić, Lj. Tančić, V. Petrović
development/acquisition process for making a final decision, for various reasons: Risk assessment is conducted in specific milestones, point were designated authority decides is sufficient technology maturity is obtained to meet criteria to enter the next phase, or to ensure that technology maturity reaches the requirements for the upcoming phase. In a case of buying equipment on market, TRL can help project managers in better technology selection process. This is just one important side of the problem; different costs associated with acquisition process can also influence the final decision. TRL is a useful tool for measuring maturity of evolving technologies through their development or acquisition phases. Also, TRL provides a good resource of information of exposure to risk, and hence how to manage risk. 4. INTRODUCTION TO DEMILITARIZATION PROCESS Last two decades have been very disturbing in the Balkans region. Wars, new countries were born and many things related to that, like downsizing and restructuring of armed forces. One of the results is the existence of surplus ammunitions (different caliber, type) to country requirements. Most of the surplus ammunitions are obsolete, in unstable condition due to the deterioration elements or degradation factors with high risk of selfignition, too sensitive for handling, near the end of its life cycle and stockpiled in warehouses or open spaces. The contractor will demilitarize the ammunition and dispose of the residues following established industrial standards for the processes to be performed. Demilitarization is considered complete when all the residues from the demilitarization process have been destroyed or recycled (R3 concept: recovery, recycling and reuse of
54
ammunition components). As describe in (Gobinet, Burning the Bullet - Industrial demilitarization of ammunition, 2013) and (International Ammunition Technical Guideline - IATG, 2011) demilitarization process consist of the following process (figure 4): Transportation of ammunition from army storages to destruction facility (sometimes destruction facility has a storage for temporary use), Pre-treatment and preparation for disassembly (ammunition is received at demilitarization line, unpacked, nonexplosive elements removed and recycled if possible), Disassembly of ammunition (separation of ammunition elements – cases from shells, unscrewing fuses from shells and primers from cases, extracting buster elements, elimination of rotating bands, etc), Treatment of ammunition elements (selecting of scrap metal for recovery, energetic materials are being removed from their cases), Disposal of waste (waste management: destruction of energetic materials, utilization, selling scrap metal). Each of these stages can generally use one or several associated process or techniques. For processes of disassembling and treatment of ammunition, there are different types of equipment that have been produced by different companies. It is important to explain that singly equipment does not form a complete demilitarization line, one is complement to another and most of these technologies have reached their maturity levels (NIAG, 2010). Other processes in demilitarization cycle are part of main logistical support function (transportation, stockpiling and maintenance) and are not mentioned here or further elaborated.
Serbian Project Management Journal, Volume 6, Issue 1, November 2016
REMOVAL FROM STORAGE
TRANSPORTATION AND INTERMEDIATE STORAGE
PREPARATION AND PRETREATMENT
DISASSEMBLY OF AMMUNITION
RECOVERY OF SCRAP MATERIAL
TREATMENT
RECOVERY OF ENERGETIC MATERIAL
DISPOSAL OF WASTE
Figure 4: Demilitarization cycle 5. PROBLEM DEFINITION Strict international, regional and national legislations has led to the development of industrial technologies for disassembly, incineration and contained detonation of conventional ammunition together with the use of complex and expensive pollution control system. Incineration of all materials was covered by EU Directive 2000/76/EC but now it is substituted with EU Industrial Emissions Directive 2010/75/EU, with an obligation to the nation to embed in national legislation by January 2013. The strict environmental regulations imposed companies which are dealing with ammunition destruction, to introduce the environmental friendly technology in demilitarization process (EWI or other similar technology). Decision makers are facing with huge challenges in this regard, how to introduce the environmentally friendly technology in the demilitarization process with minimal risk for them. For example, at the market potential buyers can find various levels of technological readiness of EWI machines. These things bring many problems in the process of selecting appropriate system
and we have to approach to this very cautiously. EWI can, through incineration or heat treatment, handle a wide variety of explosives (TNT, hexogen - RDX, octogen - HMX), propellants (single, double and composite) waste and ammunition elements small from delaboration process. Ammunition elements include small caliber cartridges (up to around 20 mm), disassembled components from artillery shells, fuses, primers, boosters, etc. Incineration process performs in either static chamber or rotary kiln machine. Inside the kiln machine process of deactivation or incineration of energetic elements are applied the ammunition elements. Beside the previously mentioned part for incineration, this type of equipment usually (figure 5) consists of: feed system to feed machine, discharging system located after incineration kiln, pollution abatement system (PAS) which consists of an afterburner, bag house and filter system and automated control equipment to monitor process and environment parameters (Hay, Sihn, Brent, Trimble Dunstan, & Schiler, 2007).
55
S. Malbašić, Lj. Tančić, V. Petrović
PROCESS CONTROL SYSTEM AMMUNITON ELEMENTS
DESTRUCTION PROCESS COMPONENTS
ABATEMENT POLLUTION SYSTEM
WASTE
Figure 5: Basic scheme of equipment for incineration process 5.1. Research and outcomes Pursuing for best possible and practicable solutions (one of the countries was using the acquisition solution instead of their own development since it was more affordable to them), different reasons were uncovered that busted different project teams to develop EWI solution or buy that type of equipment, like: relatively big amount of surplus ammunitions in some countries, strong environmental regulations. In the process of upgrading existing demili technologies, a team of experta from MoD Republic of Serbia team have receantly done a market research for obtaining new information pertaining the adoptin of a solution for EWI. Team visited four site locations in Europe and spoke with lead project managers responsible for developing demilitarization installations (with EWI installed inside). Also, the team participated in MEAD conference dedicated to Mobile Equipment for Ammunition Demilitarization, held in Luxembourg. The main objective of the conference was to present available scientific and technology activities for incineration, also to assess and compare techniques (available at the market). The main findings from MEAD conference are: Some EWI installation are in research and conceptual design, undergoing development or prototype phase or still waiting for contractual funding for subsequent development. Few systems presented have actually proven truck records or have been widely used.
56
Three instalations are at TRL 9, two are at TRL 6, one is at TRL 3. It has become obvious that manufacturer or contractor had combined various configuration and levels of technological and operational readiness (Gobinet, Dynamic disposal Introduction to mobile and transportable industrial demilitarization equipment, Januar 2012). Conference also showed several things: existence of some “breakthrough” technologies for demilitarization, at that time several large R&D projects were being developed in parallel, clear evaluation of industry in this direction, reluctant of some manufacturer to further develop their projects if they do not see commercial advantages, technologies are mainly available in industrial countries. The team has concluded that less developed country in Balkans, or a country in transition period like Serbia, have enough technologies and knowledge to develop and run demilitarization projects, but being involved in the R&D project for EWI or buying it can be very demanding and expensive. In addition, various problems of a unique approach in defining TRL were encountered and a great deal of efforts are still needed in this regard. Most of the projects run under cost-sharing agreements mainly conducted by a private company. Great amount of technological risk is inherent to this technology. So, everyone who is interested in this technology should be familiar with Technology Readiness Level (TRL) Concept.
Serbian Project Management Journal, Volume 6, Issue 1, November 2016
6. TECHNOLOGY READINESS LEVEL (TRL) CONCEPT New ideas or concepts can`t be used immediately after being initiated. They need to undergo different stages from a conceptual design through development, manufacturing and verification before they can be released to the operational environment. During this process, the level of their “readiness” has to be measured whether they are sufficiently proven for inclusion in a system as subcomponent, deciding about further investments, acquisition, etc. Originated from the National Aeronautics and Space Administration (NASA) in the 1980s, TRL approach consists of nine levels, from the earliest stages of scientific investigation (Level 1) to a successful use in operation or “mission” proven (Level 9). There are actually several versions of the original NASA-developed TRL scale
depending on the application (software, manufacturing, etc.), but all rate a technology based on the amount of development completed, prototyping, and testing within a range of environments from lab to operationally relevant. Later this approach has been adopted with minor modifications by USA Department of Defense DoD and some other industries like US Department of Energy (DOE), American Petroleum Industry, Electric Power Research Institute (EPRI) and NATO organization (North Atlantic Treaty Organization). Identifying technology readiness has been defined as a key factor in successful product development or in decision-making process and can be very helpful in assessing technological risk. TRL is a gap assessment between the current technology maturity and the maturity needed for a successful acquisition or inclusion in development (as subcomponent), Table 1.
Table 1: TRLs with explanations Technology Readiness Explanation Levels TRL 9 System ready for full scale deployment TRL 8 System incorporated in commercial design TRL 7 Integrated pilot system demonstrated TRL 6 Prototype system verified TRL 5 Laboratory testing of integrated system TRL 4 Laboratory testing of prototype components or process TRL 3 Critical function: proof of concept established TRL 2 Technology concept and application formulated TRL 1 Basic principles observed and reported Once we understand TRL concept, contracts can be awarded to entrepreneurs with precommercial innovations (the innovation that has already achieved TRL between 7 and 9). Trying to avoid all kind of risks as much as possible, buyers should look for Commercial Off-The-Self system (COTS) already operationally proven i.e. TRL-9. 6.1. Advantages and disadvantages of TRL concept Some of the characteristics of TRLs that limit their utility according to (MITRE
Corporation) (Mankins, 2009) (Valerdi & Kohl, 2004) are: Advantages of TRLs: o Provides a common understanding of technology status. o Helps better carrying out risk management process. o Used to make decisions concerning technology funding and transition of technology. o Ability to describe a series of development stages that almost every technology should pass through before it is regarded as commercially deployed. 57
S. Malbašić, Lj. Tančić, V. Petrović o TRL system applies an easily
understandable naming scheme so that it is very effective to simply describe a technology being at for instance TRL3 or TRL6. Limitation of their utility: o Numerous factors must be considered, including the relevance of the products’ operational environment to the system at hand, as well as the product-system architectural mismatch. o Various industries and entities have adapted the primary framework to their own specific definitions, terminologies or stages in order to make the level definitions to fit their particular needs. o Some Institutes (for example EPRI) criticizes the TRL framework for not having the ability to communicate the level of effort, or difficulty required to achieve, the next TRL rank in a development stage. o Current TRL models tend to disregard negative and obsolescent factors. There have been suggestions made for incorporating such factors into assessments (Valerdi & Kohl, 2004) (Hamiredza & Myhrvold, 2013). 7. TECHNOLOGY RISK ASSESSMENT PROCESS Decision making process is very important in order to decide in which direction the project manager should carry on a process. Maybe the best description of this process was given by Former Director of the USA Defense Information Systems Agency, Lt Gen Charles Croom. He explained this as new philosophy or ABC Concepts. In the "ABC" concept, "A" stands for Adopt existing technology, "B" stands for Buying option and "C" stands for Create it yourself (Technology Readiness Assessment Deskbook, 2015). Further explanations in this paper will follow this philosophy, explaining options for using “B” and “C” options. 58
Option B: Off-the-Shelf options (OTS) are a system or equipment that have been already established in service or are currently in production and require only minor modifications to deliver projected outcomes. OTS options may be either military (MOTS) or commercial (COTS). Avoiding technical risk, using already proven technology, we should have in mind other risks elements that will emerge after making decision to buy particular equipment. Different type of risks are inherent to options called OTS which can be used in the buying procedure. There is a range of requirements and expenditures buyers should also pay attention to, like operations and support (O&S) cost. O&S cost tends to be a large part of total life cycle cost. Some information (Taylor & Murphy, 2010) say that costs can go up to 60% or 80% of total life cycle costs. Depends on the programs, normally O&S cost starts when first end-item or unit is delivered and ends during decommissioning phase or withdrawing items from inventory. Option C or “create it yourself”: This option leads us to project development and role of TRL in it through TRA. Some programs use TRAs as an important component of their risk assessment. This approach is very important in research and system development process. “Create it yourself” or developmental options pose alternatives where a significantly better outcome and advantage may be gained, starting from research and development all the way to the final production. TRA developed by United States of America Department of State (USA DoD) is a systematic, metrics-based process and accompanying report that assesses the maturity of certain technologies (called Critical Technology Elements – CTEs) used in systems. This assessment does not assess future performance of the technologies/system, design, quality of the system architecture, plan for integration. A
Serbian Project Management Journal, Volume 6, Issue 1, November 2016
Technology Readiness Assessment examines program concepts, technology requirements, and demonstrated technology capabilities in order to determine technological maturity. The TRA results in a recommended readiness level (TRL) for the Critical Technology Elements (CTEs) being evaluated. If in the process of assessing maturity some element are found as critical due to its immaturity, a project manager can ask for a development of Technology Maturation Plan (TMP) for specific elements. This for sure causes a delay in project, otherwise alternative mature technologies should be useful. It is obvious that TRA is multi-dimensional process. CTE can be classified as either a hardware, software, or a manufacturing technology. This means that not only onedimensional metrics (TRL) is enough to help in decision making process, so in development process new readiness levels for hardware or software components, system, manufacturing and integration must enter into the process (Nazanin, Shahram, & Thomas, 2009). Speaking of readiness levels, manufacturing readiness levels is another important and sometimes critical part of product development, besides integration levels. In most cases, this occurs independently and for some specific systems. For a manufacturing technology to be identified as critical from a TRA perspective, it must be critical in the program context of cost, schedule, and performance and will begin with TRL 4 (validation is performing in a laboratory environment). 7.1. Defining the TRL in the process of development EWI For the purpose of this work, TRA approach made by USA DoD will be applied for the explanation of option C or “create it yourself” in the process of developing of EWI machine. How this should look for the process of developing of EWI is presented below. CTE for EWI has been defined (suggestion to use WBS – Work Breakdown Structure method) as: process control system (monitoring
equipment, feeding and discharging system), destruction process component (incineration), abatement pollution system (Figure 5). For each of this CTE necessary TRL through project development phase also has been defined. For EWI, manufacturing readiness levels will not be calculated. However, the readiness of a manufacturing technology is evaluated in the context of understanding the risks associated with the industrial process (Process capability and control, Quality management, Personnel skills and availability, Facility capability and capacity, Manufacturing planning, scheduling, and control) and then developing and implementing risk mitigation plans. The remainder of this article provides examples for assessing only hardware technology maturity for EWI components (Technology Readiness Assessment Deskbook, 2015). Table 2 shows that each CTE has to reach some TRL as single elements, then in integration process to reach high level up to whole integration of all elements to have TRL 9. However, there are some recommendations in reaching the necessary TRLs: TRL 6: This is probably the highest level for not having the operational environment (only laboratory test). This can be applied separately for abatement pollution system and destruction process components. At this level, all CTE have to be tested as separate components. Achieving a TRL 7 or higher would require testing the system in the operational environment, and these testing can be performed after the integration process, starting with a prototype. It is critical to get a common and detailed understanding of the TRL scale among program stakeholders, particularly concerning terms like "simulated environment," "relevant environment," and "operational mission conditions" which must be interpreted in the context of the system or capability under development. 59
S. Malbašić, Lj. Tančić, V. Petrović
Table 2: Assessing hardware technology maturity for EWI components TRL SUPPORTED
DEMONSTRATION
1
2
3
4
5
6
7
8
9
Discovery of main principle for work Application envisioned and described Concept of application analyzed PROCESS CONTROL SYSTEM Concept and design of feeding system, discharging and monitoring equipment Testing production rate for feeding system Testing production rate for discharging system Testing procedure for monitoring equipment (monitoring of process and environment equipment) DESTRUCTION PROCESS COMPONENT Scale laboratory test of system components (rotate kiln temperature, speed...) Full scale laboratory test under operational relevant conditions ABATEMENT POLLUTION SYSTEM (APS) Scale laboratory test of system components (afterburner, filter system, bag house system…) Full scale laboratory test of APS under operational relevant conditions (Compliance Demonstration, Operating Parameter Limits (OPL)) INTEGRATED CONCEPT Demonstration of prototype equipment Production system tested in operational environment Production system proven in mission operation
8. OVERCOMING LIMITATIONS IN USING TRL To overcome TRL limitations more sophisticated, precise, objective and accurate new techniques were developed (Nazanin, Shahram, & Thomas, 2009): qualitative, quantitative and automated. Reasons for that are: drastic increase in system complexity, TRL has become incapable for new customer requirements, system developments needs (for manufactory, for integration, to overcome obsolete subcomponents), variations in acquisition programs, etc. Qualitative techniques are considered qualitative due to their descriptive nature (for each tier on the scale). In this way many oversimplifications are made regarding maturity and readiness. To include other facets of product development, software, manufactured and integrated readiness levels need to be involved. 60
Quantitative techniques provide insight into technology maturity through a mathematical model (mathematical operations between two or more system metrics). The output value is not always indicative of the technological maturity, but rather of the risk involved in developing the product. In addition to qualitative and quantitative techniques, automated techniques were developed. The user feeds the tool with information to generate an output showing the maturity of the product. Some types of quantitative analysis are performing in the background, but the user does not need to perform any calculations. 9. CONCLUSION Every decision-making process is very risky, especially when decision makers do not have enough information. Since this risk can affect
Serbian Project Management Journal, Volume 6, Issue 1, November 2016
companies’ objectives and goals, each organisation should have adequate risk management strategy and tools to deal with it. This paper has made focus on the technical side of risk and proposed some tools for solving problems in using TRLs through TRA. In addition, it has been pointed out that project planning phase should be the first phase where this problem needs to be addressed and assessment made. TRA process is useful in highlighting technology items and shaping the risk mitigation plans, but the TRA should not be the sole means of solving technology risk. The highest levels of TRL introduce the possibility for Commercial Off-the-Shelf options (COTS). The goal of explanation and using COTS option is to make better decisions in acquisition programs and increase visibility of sustain factors which help us to deliver products with long-term affordability consideration. Planning for the operations and support (O&S) costs have to start prior the program initiation process or as early as possible. Having in mind different approaches that have been presented during research, it is of upmost need to have a common understanding of TRL in particular field of research, in our case in the process of development demilitarization equipment (particularly EWI). Proposed steps for achieving specific TRLs during the development process of EWI equipment should be a common platform for further research in the field of development of demilitarization equipment. Throughout this process, it is very important to assess technology maturity using proposed readiness levels. There is space for further improvements in using TRLs. Processes are needed in order to improve consistency (reliability) and efficiency of the application of TRLs and in developing criteria that consider both the technology and the customer's ability to assimilate it. Further development of this proposed process, involves an application of manufactured or integrated readiness levels together with some automated techniques,
would enhance the probability for achieving established goals of projects. TRLs are meant to be overarching definitions for any technology, while interpretations or amplifications for specific technologies are left to the experts in that technology domain. Currently, there is no standard or commonly used approach for implementing TRLs. Authors aim was to draw attention to the range of issues involved in using TRL and to give some general directions in order to help the readers think about how these issues may be adressed in specific circumstances of their own organisation. LITERATURE Gobinet, P. (2013). Burning the Bullet Industrial demilitarization of ammunition. Geneva: Small Arms Survey. Gobinet, P. (Januar 2012). Dynamic disposal Introduction to mobile and transportable industrial demilitarization equipment. Geneva: Small Arms Survey. Gobinet, P. (December 2013). Industrial demilitarization of Ammunition. Geneva: Small Arms Survey. Hamiredza, B.-D., & Myhrvold, T. (2013). On methods for maturity assessment of CO2 capture technologies. Energy Procedia 37 , 2579-2584. Hay, K., Sihn, C., Brent, H., Trimble Dunstan, M., & Schiler, D. (2007). Fugitive Emmision Control for the APE 1236 Deactivation Furnace. US Army Corps of Engineers, Engineer Research and Development Center. International Ammunition Technical Guideline - IATG. (2011). UNITED NATIONS OFFICE FOR DISARMAMENT AFFAIRS (UNODA). JB International. (n.d.). Retrieved Januar, 2016 from www.jbconsultinginternational.com/Page s/TechnologyReadinessLevels.aspx Laraia, M. (n.d.). Technology maturity and R&D programs. Retrieved May 09, 2015 from www.ndreport.com
61
S. Malbašić, Lj. Tančić, V. Petrović
Lazarevic, J. (November 2012). Cost and Consequences, Unplanned Explosion and Demilitarization in South East Europe. Geneva: Small Arms Survey. Malbasic, S. (2006). Master thesis: Risk management as a factor of security of trafic. Kragujevac: Mechanical Faculty. Mankins, J. C. (2009). Technology readiness and risk assessments: A new approach. Acta Astronautica 65 , 1208-1215. MITRE Corporation. (n.d.). Retrieved April, 2015 from http://www.mitre.org/publications/system s-engineering-guide/acquisition-systemsengineering/acquisition-programplanning/assessing-technical-maturity Nazanin, A., Shahram, S., & Thomas, M. (2009). A Comprehensive Review and Analysis of Maturity Assessment Approaches for Improved Decision Support to Achieve Efficient Defense Acquisition. World Congress on Engineering and Computer Science (pp. 1150-1157). San Francisko: www.iaeng.org/publication/WCECS2009 /WCECS2009_pp1150-1157.pdf. NIAG. (2010.). FINAL REPORT OF NIAG SG.139 STUDY ON NATO INDUSTRIAL CAPABILITY FOR DEMILITARIZATION AND DISPOSAL OF MUNITIONS. Bruxelles: AMMUNITION SAFETY GROUP (CASG), NATO INDUSTRIAL ADVISORY GROUP. Nolte, W. L., Kennedy, B. C., & Dziegiel, R. J. (2003). Technology Readiness Level
62
Calculator. NDIA Systems Engineering Conference USA. Petrovic, D., Jovanovic, P., & Rakovic, R. (2010). Project risk management. Belgrade: YUPMA. Taylor, M., & Murphy, J. “. (2010). OK, We Bought This Thing, but Can we Afford to Operate and Sustain. USA: IDERAM. Technology Readiness Assessment Deskbook. (2015). USA Department of Defence. Tecnical Risk Assessment Handbook - TRAH Version 1.1. (2010). DSTO - Defence and Science Technology Organization, Australia. The Orange Book, Management of Risk – Principles and Concepts. (2004). London, UK: HM Treasary. Thomson, M., Davies, A., & Jenkins, C. (2011). Tree views of risk, selecting and acquiring military equipment (Issue 42) . ASPI (Australian Strategic Policy Institute). Valerdi, R., & Kohl, R. J. (2004). An Approach To Technology Risk Management. Engineering System Division Symposium . MIT, Cambridge, MA, . Wikipedia. (n.d.). Retrieved March, 2015 from www.en.wikipedia.org/wiki/Technolgy_r eadiness_level Wright, E. (2011). Risk Management in Public Contracting. USA: National Institute of Governmental Purchasing (under LEAP program).
Serbian Project Management Journal, Volume 6, Issue 1, November 2016
PROJECT PORTFOLIO MANAGEMENT MATURITY ASPECTS IN WEB BASED ENVIRONMENT Dragan Bjelica, Zorica Mitrović, Danijela Toljaga-Nikolić Faculty of Organizational Sciences, University of Belgrade, Serbia Abstract: A “project portfolio” is usually defined as a centralized collection of projects managed jointly to enhance advantages to the organization or to minimize risk. In this paper, we discuss about project portfolio management and organizational maturity using web based approach. From a technical point of view, within web based aplications, a portfolio of projects should be defined as a set of projects that share the same cost or resource constraints. This paper aims to present an approach for evaluating the effectiveness of the project portfolio, the processes within the project portfolio and the maturity aspects of organizations. Also, this paper presents the results obtained by experts in the field, as well as future directions for the implementation of project portfolio management using web-based approach. Key words: Project portfolio, MS Project Server, web-based approach, methodology, maturity 1. INTRODUCTION This paper presents the improvement of the work presented at the conference - XIII International Symposium SYMORG 2012. This paper considers cross cutting issues and contemporary trends in portfolio analysis. Portfolio management involves larger capital investments, embraces several disciplines, widely dispersed project participants, a lot of stakeholders, tighter schedules, specific quality standards, etc. The idea of a balanced portfolio is based on modern portfolio theory by Markowitz (1952). This theory has been adapted by strategic management literature in the 1970s, where different approaches were introduced by several management consultancies. Applied to project management the desired combination of projects is a balanced portfolio that enables a firm to achieve its objectives without being exposed to unreasonable risk. According to project management literature, a portfolio has to be balanced along a range of dimensions to provide the best value to the organization (Meskendahl, 2010). Beaujon suggests a mathematical formulation of an optimization model designed to select projects for inclusion in an R&D portfolio, subject to a wide variety of constraints (e.g., capital, headcount, Corresponding author. Email:
[email protected] ISSN 2217-7256 (online) © 2016 YUPMA www.spmjournal.rs
strategic intent, etc). The model is similar to others that have previously appeared in the literature and is in the form of a mixed integer programming problem known as the knapsack problem. Beaujon suggest that the problem might best be formulated as a non-linear programming problem, but that there is a need for further research to determine an appropriate expression for the value of a partially funded project. In light of that gap in the current body of knowledge and for practical reasons, the linear programming relaxation of this model is preferred. (Beaujon, Mari, & McDonald, 2001). Linton described how Lucent Technologies had used data envelopment analysis (DEA) to rank the relative efficiency or attractiveness of their large portfolio of R&D projects based upon a comparison of established, companystandard sets of input and output measures common to all projects. A positive NPV means favorable consideration for funding (Bodner & Rouse, 2007). He specify measures of: product life cycle, intellectual property lifecycle, and required investment, while the corresponding output set consists of a three-figure estimate of the potential financial returns as measured by its net present value - pessimistic, most likely, and optimistic (Linton, Morabito, & Yeomans, 2007). 63
D. Bjelica, Z. Mitrović, D. Toljaga-Nikolić
2. PROJECT PORTFOLIO IDENTIFICATION In accordance with the product definition process, product portfolio identification involves a multistage process among customers, marketing folks, and designers. However, there are several practical situations in which non- compensatory approaches based on outranking relations seem more appropriate. This is the case if the decision maker has a preference structure which by nature is noncompensatory, or is unable or unwilling to establish trade-offs required to specify the parameters for compensatory methods. Such situations have been reported in several applications. Comparisons of the use of outranking procedure with multiattribute utility theory have been done for example in contexts such as risk analysis of natural gas pipelines and the selection of outsourcing contracts. (Vetschera & Teixeirade Almeida, 2012) The front-end of new product development has caught the attention of researchers and companies. Some of the reasons for this interest stem from its strong impact on the success of new product development and its ineffectiveness when compared to other parts of the new product development process. Also, the front-end creates a link between business goals and the new product development process which makes it an important connection to achieve successful innovations. The activities of the front-end of new product development precede product design, determining product opportunities in terms of strategic goals, market needs and technological solutions. These, in turn, lead to product concepts and to projects to deliver these concepts. (Oliveira & Henrique, 2010) Because of various uncertain aspects and circumstances involved in resources, technology, environment and competition, the decision of selecting new product development project can be regarded as a fuzzy multicriteria group decision problem. By using the fuzzy method, the management would be able to make adequate decision based on incomplete and imprecise information under various kinds of pressure. Traditional quantitative methods such as mathematical programming and economic models require information of the
64
target market, financial prediction, resources availability and decision timing, which are all unreliable and imprecise; consequently, the decision made would be in great suspicion. The classical logic focuses on duality of yes or no, and most discrete events are solved using traditional means. Therefore, the value of outcome can only be classified as zero and one (binary programming). Obviously, when an event is with value of outcome between zero and one, the duality cannot be applied. Event of this kind is called continuous event and can be solved by fuzzy theory, which measures the relationship between element and set using membership function, and the result is the degree of membership. (Wei & Chang, 2011) 3. PROJECT PORTFOLIO ANALYSIS METHODOLOGY The following listing describes the goals which an optimization approach for the project selection problem should support: 1. Consider and limit the available resources/budget per timeframe; 2. Support “must-select” restrictions; 3. Take synergy effects into account; 4. Take logical relationships into account; 5. Maximize the overall strategic alignment value; 6. Support balancing of risk, project categories and return time; 7. Maximize potential portfolio return; 8. Provide possibility to define project starting timeframes. (Kremmel, Kubalík, & Biffl, 2011) Portfolio optimization is a process in project portfolio management that create the best mix of projects, out of all potential candidates. Selection of projects, and optimization of projects can be conducted either manually or automatically. Manual approaches to select projects are for example the Analytic Hierarchy Process (AHP), Q-Sort, scoring models, and portfolio matrices. Commonly used manual approaches are based on some sort of direct comparison and ranking of the alternatives based on project data and individual preferences. We suggest eight steps for project portfolio selection using web based approach for selecting projects: 1. Data collection for the portfolio and the interpretation of these data 2. Prioritization of projects and programs 3. Determination of the optimal project mix that is consistent with the goals of the organization and coordination of
Serbian Project Management Journal, Volume 6, Issue 1, November 2016
4. 5. 6. 7.
the portfolio of projects, such coordinate projects to mix long and short term factors, the risk versus reward, research versus development, and so on. Providing information and recommendations at all levels of the organization Monitoring the implementation of projects and project portfolio performance analysis Comparative analysis is performed for new opportunities compared to the existing portfolio of projects (Figure 1) The inclusion of new projects in the portfolio
8. The continued increase in knowledge base and evaluation of business benefits after the implementation of projects The success of a project portfolio management system is multidimensional consisting of the three dimensions: 1. process effectiveness - information quality, allocation quality, cooperation quality, 2. portfolio success - average project success, use of synergies, strategic fit, portfolio balance 3. portfolio-related corporate success, which will be affected by changes in the PPM system consecutively - business success, preparing for the future (Jonas, 2010).
Figure 1: Scatter chart for portfolio selection using MS Project Server 2010 4. PROJECT WEB ACCESS PORTFOLIO SELECTION
AND
Project Web Access is the interface (web page) to the user, providing information about projects and portfolios. Each analysis is created as a separate data entity within the Project Server database. There are a very large set of possible constraints, which can be invoked through constraint equations. A guarantee that each project, if selected, will not start twice during the planning horizon, Maximum expenditures will not exceed specified amounts in each of a set of time periods, Other resource demands, such as personnel or facility requirements, must not exceed the amount available in each time period,
All of the projects selected must be completed within the planning horizon, Precursor projects must be completed before successor projects start, Certain projects are mandatory and must be scheduled, Only one of several mutually exclusive projects can be chosen. (Ghasemzadeh & Archer, 2000) The research about maturity in project, program, and portfolio management in web based environment was conducted among 64 project managers in Serbia. Project management maturity has been perceived as a dominant component (Figure 2). The research also includes 154 organizations, which had been evaluated by the contractors.
65
D. Bjelica, Z. Mitrović, D. Toljaga-Nikolić
3,95 3,9 3,85 3,8 3,75 3,7 3,65 3,6 3,55
3,5 3,45 Series1
Project management
Program management
Portfolio management
3,890625
3,609375
3,671875
Figure 2: Maturity in project, program, and portfolio management in web based environment The outcome of portfolio optimization is a portfolio that is aligned to the business strategy focusing on: 1. Identifying all programs within the scope of the portfolio 2. Design of optimal frameworks 3. Evaluating the alignment between business strategy and portfolio prioritization criteria 4. Assessing the current portfolio against constraints and targets 5. Effective deployment of portfolio management (PricewaterhouseCoopers, 2014) 5. DECISION MAKING IMPLICATIONS
increase their use of the system. Second, other dimensions of project management, related to the organizational environment, evidently play a role in explaining project performance; thus, the managers’ authority on project activities, their involvement in project design, and their accountability in meeting project objectives are potential success factors other than the PMIS. Third, another interesting aspect to consider is the possible reluctance of project managers to report ‘‘bad news’’ on a project, and the subsequent effect it could have on the accuracy of project reports and on the assessment of project success. (Raymond & Bergeron, 2008)
The objective of this paper is to have a better understanding of the elements that contribute to the impact of a Project Web Access, IT project aspects, project performances and organizational maturity. The study results are discussed in terms of direct and indirect effects on PMIS project success. Projects today are far more complex than ever before. To ease the discussion, the elements are grouped in three dimensions: technical (PMIS quality and quality of information), managerial (PMIS use and impact on project manager), and organizational (PMIS impact on project success. First, it is worth noting that a reverse or ‘‘feedback’’ relationship is possible between individual impacts of a PMIS and its use. As project managers perceive the PMIS to be beneficial to them, it is likely that they will
This paper briefly sets out the challenges and problems facing the current project management practices, using web based approach for project portfolio planning, implementation and controlling. A summary of changes in the IT project context that change the demands made upon project managers, and a more extended description of changes in project management and the mindset they exemplify. The first change is the increased strategic and operational importance of IT projects. They are no longer confined to the back-office. Their success has a direct connection to the success of the business. Consequently, projects are more exposed to changes in the competitive environment. This contextual change implies that during a project’s life more change is likely to occur and
66
Serbian Project Management Journal, Volume 6, Issue 1, November 2016
will therefore require adaptation to the project plan. Second, speed of change arising from intensified competition requires businesses to respond faster. Time becomes more critical for projects that affect business outcomes, for example through expediting or delaying product launches. This implies compressed project schedules and more agile methods because of the demand for shorter lead times to delivery. Third, clients increasingly see IT as an investment from which they seek a return comparable to that for other investments. In seeking value for money, clients press project managers to achieve better ROI. These pressures encourage a greater focus on value and a willingness to innovate in order to meet otherwise unachievable demands. Fourth, clients are seen to have matured in their understanding of IT projects. This maturity reveals itself in a greater understanding of the complex issues that confront IT projects and, therefore, a deep skepticism about the ability of IT departments and suppliers alone to deliver value (Sauer & Horner Reich, 2009). There is also growing acknowledgement of the critical role of the project manager and a willingness to treat the project manager as a key player. This is particularly apparent among IT services companies but is also apparent in organizations that retain in-house project management (Sauer & Horner Reich, 2009). This encourages project managers to invest in their own future and that of their organization by experimenting with new project management practices and focusing on personal development. In short, expectations of projects are more ambitious, the job has got tougher, and the requirement for delivery is tighter in terms of business value as well as cost and schedule. Together these drivers require project managers to explore new ways of thinking. We refer to the combination of these principles and qualities as the new mindset: Focus on ultimate value. Deep personal identification with project goals. Investment in trust. Devolved, collective responsibility. Willingness to continually adapt.
People development. Learning orientation. Creativity and innovation. Proactive view. 7. RESEARCH RESULTS Cluster analysis from the perspective of the contracting authority of the project shows the observation characteristics in relation to the dependent variable - organizational project management system, which includes the following sub-components: alignment of projects with business strategy, investing in the right areas, eliminate redundant projects, resources are allocated optimally, project management system contributes to savings and profit increasement, project management system contributes to product placement speed. The research results show 6 clusters for 154 organizations using the k-means algorithm. Comparisons score observations are presented below (Figure 3).
Cluster 1 consists of 8 organizations - 12.5% of organizations are at the maturity level 0, 62.5% at the level 1 and 25% at the level 4. The values of dependent variables (compliance projects with business strategy, investing in the right areas, eliminate redundant projects, resources allocated optimally, project management system contributing to savings and project management system contribute to the speed of product placement) were rated low in comparison with other clusters, while the variable project management system has medium evaluation. Organizations in this cluster mainly apply the traditional approach in IT projects, whose value generally lower than 100.000 eur and duration is up to 12 months. Number of end users in most cases are greater than 20, and projects that are implemented in the private sector could be categorized as follows: information systems, software and engineering, applied computer systems. Organizations in this cluster are not favored by the establishment of project management offices. Implementation are usually connecting with education, information technology and banking, insurance and investment services.
67
D. Bjelica, Z. Mitrović, D. Toljaga-Nikolić
5,00 4,50 4,00 3,50 3,00 2,50 2,00 1,50 1,00 0,50 0,00
Project Project Project management management Resources are management system system alocated system contributes to improve optimally contributes to profit product cost savings increasement placement
Alignemennt with business strategy
Investing in right areas
Eliminate redundant projects
Klaster 1
2,00
2,00
1,38
2,63
2,75
3,38
2,38
Klaster 2
3,50
3,38
3,00
3,00
2,50
2,50
2,50
Klaster 3
4,00
2,99
2,97
2,99
3,96
3,97
3,00
Klaster 4
4,64
4,45
4,18
4,09
4,55
4,45
4,27
Klaster 5
3,93
3,14
2,89
2,96
4,00
4,07
3,21
Klaster 6
4,00
3,00
2,90
2,95
4,05
4,00
3,29
Figure 3: Cluster analysis from the contractors’ perspective Cluster 2 consists of 8 organizations - 12.5% are at the maturity level 0, 62.5% at the level 1 and 25% at the level 4. The values of dependent variables (compliance projects with business strategy, investing in the right areas, eliminate redundant projects, resources allocated optimally) are average evaluated in comparison with other clusters, while variable - project management system contributes to cost savings, a project management system contributes to increasing profits and project management system contributes contribute to the speed of product placement has low evaluation. Organizations in this cluster mainly applied traditional approach in IT projects, whit duration up to 36 months. Number of end users in most cases is greater than 20, and projects that are implemented in public and private sectors could be categorized in information systems and related social and professional areas. Organizations in this cluster are not favored by the establishment of project management offices. Implementation are usually connecting with education, the construction industry and the banking, insurance and investment services. Cluster 3 contains 79 organizations - 56.96% at the maturity level 0, 3.8% at the level 2%, 11.39% at the level 3, 17.72% at the level 4 and
68
13.10% at the level 5. The values of dependent variables (investment in the right areas, eliminate redundant projects, resources are allocated optimally and project management system contributes to the speed of product placement) were rated average compared to other clusters, while the variable alignment of projects with business strategy, a system for project management contributes to cost savings, a system for project management contributes to profits increasement are highly rated. Organizations in this cluster mainly apply agile approach in IT projects. Number of end users in most cases is greater than 20, and projects belonging to all categories of IT projects. Cluster 4 contains 11 organizations - 18.18% at the maturity level 0, 18.18% at the level 1, 18.18% at the level 2, and 45.45% at the level 4. The values of dependent variables (compliance projects with business strategy, investing in the right areas, eliminate redundant projects, resources are allocated optimally, the system for project management contributes to cost savings, a system for project management contributes profits increasement and project management system contributes to the speed of product placement) are highly rated compared to other clusters. Organizations
Serbian Project Management Journal, Volume 6, Issue 1, November 2016
in this cluster mainly apply agile approach in IT projects, whose value generally is lower than 100.000eur. Number of end users in most cases is greater than 20, and projects that are implemented in the private sector could be categorized as follows: information systems and software engineering, software and mathematical analysis, models of computation, network and hardware. Organizations in this cluster partially favored the establishment of project management office. Implementation are usually connecting with banking, insurance and investment services, information technology, energy and commerce.
contributes to profits increasement are highly rated. Organizations in this cluster mainly apply the traditional approach to IT projects, whose value usually is greater than 10.000eur and duration is up to 36 months. Number of end users in most cases is from 100 to 1000, and projects that are implemented in the public and private sectors are categorized as follows: information systems and software engineering, computer methodology and organizational computer systems - architecture. Organizations in this cluster favored the establishment of a project management offices and the projects are implemented in all industries.
Cluster 5 contains 28 organizations - 7.14% at the maturity level 0, 53.57% at the level 1, 14.29% at the level 2, 10.71% at the level 3, 10.71% at the level 4 and 3.57% at the level 5. The values of the dependent variables (investing in the right areas, eliminate redundant projects, resources are allocated optimally and project management system contributes to the speed of product placement) were average rated compared to other clusters, while the variable alignment of projects with business strategy, project management system contributes to savings, system for project management contributes to profit increasement are highly rated. Organizations in this cluster mainly apply agile approach to IT projects, whose value usually is greater than 10.000eur and duration is up to 36 months. Number of end users in most cases is greater than 100, and projects that are implemented in the private sector belong to all categories of IT projects. Organizations in this cluster partially favored the establishment of project management offices. Implementation are usually connecting with creative industry and informatics.
8. CONCLUSION
Cluster 6 contains 21 organizations - 9.52% are at the maturity level 0, 19.05% at the level 1, 4.76%at the level 2, 19.5% at the level 3, 42.86% at the level 4 and 4.76% at the level 5. The values of dependent variables (investing in the right areas, eliminate redundant projects, resources are allocated optimally and project management system contributes to the speed of product placement) were average rated compared to other clusters, while the variable alignment of projects with business strategy, project management system contributes to savings, system for project management
The institutionalization of project portfolio management practices in an organization can be operationalized into two constructs: the organization's use of project portfolio management practices and the organizational success in implementing projects (Badewi & Shehab, 2016). Nikolic et al. (2011) emphasize connection between ISO and project management standards, and therefore the structured way to maturity improvements could be set in appropriate way. The proposed framework guides the construction of measuring scales of the various portfolio attributes and facilitates possibly required tradeoffs among the portfolio attributes. The contribution of this framework resides in creating the taxonomy that describes the different functional relationships between the portfolio attributes, the contributing project attributes and maturity aspects. Nevertheless, the development of appropriate methodologies for constructing measuring scales of the various portfolio attributes, to certain extent, is problem-specific and indeed another research topic. It is useful to derive results from the implementation in more specific situations that should lead to the identification of the limitations of this framework and the circumstances in which this framework can be applied. ACKNOWLEDGMENTS This paper is a result of Strategic Project founded by Ministry of Education and Science of Republic Serbia: Exploring modern trends of strategic management of the application of
69
D. Bjelica, Z. Mitrović, D. Toljaga-Nikolić
specialized management disciplines in the function of the competitiveness of Serbian economy, No 179081. LITERATURE Badewi, A., & Shehab, E. (2016). The impact of organizational project benefits management governance on ERP project success: Neo-institutional theory perspective. International Journal of Project Management, 34(3), 412–428. http://doi.org/10.1016/j.ijproman.2015.12 .002 Beaujon, G. J., Mari, S. P., & McDonald, G. C. (2001). Balancing and optimizing a portfolio of R&D projects. Naval Research Logistics, 48(1), 18-40. Bjelica, D., Mitrovic, Z., & Nikolic-Toljaga, D. (2012). Key dimensions in project portfolio management using web-based approach, XIV International Symposium SYMORG 2012, 1549-1556. Bodner, D. A., & Rouse, W. B. (2007). Understanding R&D value creation with organizational simulatio. Systems Engineering, 10(1), 64-82. Ghasemzadeh, F., & Archer, N. (2000). Project portfolio selection through decision support. Decision Support Systems, 28, 73–88. Jonas, D. (2010). Empowering project portfolio managers: How management involvement impacts project portfolio management performance. International Journal of Project Management, 28, 818– 831. Kremmel, T., Kubalík, J., & Biffl, S. (2011). Applied Soft Computing. Software project portfolio optimization with advanced multiobjective, 11, 1416–1426. Linton, J. D., Morabito, J., & Yeomans, J. S. (2007). An extension to a DEA support
70
system used for assessing R&D projects. R&D Management, 37(1), 29-36. Meskendahl, S. (2010). The influence of business strategy on project portfolio management and its success — A conceptual framework. International Journal of Project Management, 28, 807– 817. Toljaga-Nikolić, D., Obradović, V., & Mihić, M. (2011). Certification of Project Managers Based on IPMA and PMI Models through Conforming to ISO 17024 : 2003, Management, 59, 45-54. Oliveira, M. G., & Henrique, R. (2010). Integrating technology roadmapping and portfolio management at the front-end of new product development. Technological Forecasting & Social Change, 77, 13391354. PricewaterhouseCoopers. (2014). Delivering change, sustaining benefits Portfolio and Programme Management ( PPM ) Service Catalogue. PricewaterhouseCoopers. Raymond, L., & Bergeron, F. (2008). Project management information systems: An empirical study of their impact on project managers and project success. International Journal of Project Management, 26, 213-220. Sauer, C., & Horner Reich, B. (2009). Rethinking IT project management: Evidence of a new mindset and its implications. International Journal of Project Management, 27, 182-193. Vetschera, R., & Teixeirade Almeida, A. (2012). A PROMETHEE-based approach to portfolio selection problems. Computers &OperationsResearch, 39, 1010-1020. Wei, C.-C., & Chang, H.-W. (2011). A new approach for selecting portfolio of new product development projects. Expert Systems with Applications, 38, 429–434.
Serbian Project Management Journal, Volume 6, Issue 1, November 2016
APPLICATION OF AKPAN’S METHOD IN OPTIMUM RESOURCE USAGE IN CONSTRUCTION PROJECTS: A MULTIPLE RESOURCE CASE Benedict Amade Federal University of Technology, Owerri, Nigeria Abstract: Inadequate planning of resource utilization profile often results in idle resource usage, which may lead to wastage or increase in cost in no distant time. The need to deploy an optimum method of management of construction project resources is eminent given the desire to utilize resources by means of deploying heuristics that guarantees optimal or near-optimal solutions. The objective of this study was to maximize resource utilization efficiency using the Akpan’s method/heuristics in a typical construction project using multiple resources. In order to conceptualize this research, a myriad of articles on resource allocation and management were reviewed. A case study method was adopted for the study. Secondary data in the form of performance data (statement of work program) were collected and factored into Microsoft project 2010 version and a programmed software using the Akpan’s heuristic in formulating and generating the multi-resource iteration. The findings from the study depict a clear and optimum resource use among the four (4) resources subjected to the method/heuristic. There was a difference of eight (8) weeks between the duration of the project using the method/ heuristic and when the Microsoft project was used. The Akpan’s method/heuristic was adjudged a better option if the objective of optimum resource use is of importance compared to the duration of the project. Key words: Akpan’s method/heuristic, Construction projects, Multiple resources, Microsoft project, Resource management 1. INTRODUCTION The desire to balance the workload of resources over the course of the project usually comes at the expense of time and/or cost. According to Chigara and Mangore (2012), ineffective resource management often gives rise to financial impairment, project delays, lost time and decreased productivity. On the other hand, excess resource idling could give rise to cost overruns, while low resource coverage or long lead-time in resource acquisition can delay a project schedule. In a research work on civil engineering projects, Chigara and Mangore (2012) opined that the huge amount of resources from construction and their various locations makes it extremely difficult for project managers to effectively utilize such resources. It happens that under such situations the need for the management of resources in real-time becomes a necessity. Lu and Li (2003) further opined that due to the resource-driven nature of construction
projects, the construction manager must put up an action plan at directing and controlling resources (workers, machines, and materials) in a coordinated and timely fashion in order to deliver the project within the limited funding and time constraints. Hence, aside from the technology and process focus, that is, what needs to be done and how as well as who needs to do what and with what, must be adequately be considered in describing a construction method or operation in a project plan. Nevertheless project planning methods viz1 the critical path method (CPM) and the related network diagramming techniques, node diagramming and precedence diagramming fail to some extent in synchronizing activity and resource planning which are the two integral functions of project planning. Lu and Li (2003) further argued that to overcome this recognized drawbacks that brings forth unrealistic or impossible CPM schedules, various analytical or heuristic techniques for
Corresponding author. Email:
[email protected] ISSN 2217-7256 (online) © 2016 YUPMA www.spmjournal.rs71
71
B. Amade
resource allocation/leveling have also been developed since the early 1960s to address some of these problems. These techniques generally consist of various stages and processes. Firstly, the project is split into distinct activities that are logically or technologically related according to the construction process and method without imposing resource constraints. For instance, the superstructure component of a building project follows the substructure; the concrete administration succeeds the formwork and reinforcement aspects. Secondly, the basic CPM scheduling computations are made for early and late start and finish dates as well as the total and free float times based on which the project is rescheduled so that a limited number of resources can be efficiently utilized while minimizing the unavoidable extension of project. According to Mendoza (1995), construction projects are more complex than ever before, the individual tasks must be properly scheduled if the project must run smoothly, on time, and on budget. The realization of a construction project requires a judicious scheduling and allocation of available resources; manpower, equipment, and materials as important project resources that require close monitoring. The supply and availability of these resources can seldom be taken for granted because of seasonal shortages, labor disputes, equipment breakdowns, competing demands, delayed deliveries, and a host of associated uncertainties. Nevertheless, if schedule and budgets goals must be met, work must be carried out with the required resources (equipment, manpower, and materials) as when they are needed. The main objective of resource planning and resource allocation is to get the resources that will be needed to support the operations so that established schedule objectives can be achieved and costs be realistically kept low within the construction budget. Mendoza (1995) further stated that is the responsibility of the project manager in a construction project to identify and schedule future job needs so that the most efficient deployment of the required resources is achieved. The project manager must also determine long-range resource requirements for general planning and short term resources for detailed planning. He/she must further
72
establish the resources required, when they must be acquired, and the quantities required. Construction, by virtue of its size, is a major consumer of resources. Fundamentally, resources create avenue for achieving project objectives. Therefore, sound project management is needed to ensure effective and efficient utilization of resources. However, apart from the centrality of resources in ensuring accomplishment of project objectives, resources management remains a silent aspect of project management both in practice and theory. In the early stage of construction project planning, resources restrictions are often accorded little attention (Abd & Abd, 2012). Usually this gives rise to cost and schedule overruns. Moreover, the adoption of resource restricted project planning may lead to a complex optimization problem. Thus project managers should focus more on resource-based project planning for optimum schedule efficiency. The construction industry has been adjudged a high and complex entity; this is as a result of the heterogeneous structure of buildings and infrastructures. It involves complex package of work for which design and contracting organizations are responsible, the end product is generally large, discrete and prototypical. Moreover, its external factors usually are not controllable (e.g. different stakeholder interests, availability of equipment and labour, supply of materials) affects project execution and often leads to constantly changing project planning problems. More than any other industry, one can think of the construction industry as one known for the poor quality of its products and projects which are most times over budget and behind schedule. The incidence of late delivery and cost overruns in projects limits project success by leaving the client dissatisfied and the contractor with expensive and time-consuming dispute resolution and extensive claim management efforts. During the period of loss of revenue by the client through lack of production facility, dependence on present facilities or a loss of income from rentable space, the contractor is usually faced with high overhead costs due to prolonged work periods, high material costs as well as inflation and increase in labour cost (Abd & Abd, 2012; Nagaraju et al., 2012).
Serbian Project Management Journal, Volume 6, Issue 1, November 2016
The proposed study is basically expected to provide a platform for optimum resource utilization and efficiency in a construction project with a view to improve productivity and reduce project duration and cost. The use of resources as opined by Akpan (1987) costs more and as such it may sometimes not be possible for one to get all the resources at the appropriate time. This scenario would definitely affect the completion, estimation and probably the scheduling and project control variables. The main objective of this study is to maximize resource utilization efficiency using the Akpan’s method/heuristics. 2. LITERATURE REVIEW The main objective of resource allocation in construction is to create means that are consistent with specified resource limits, as well as profits to the contractors while also meeting up with the schedule. It is necessary for the contractor to plan the project and take all other factors into consideration in order to make some profits. Sometimes they would have to change the existing resource allocation plan. The essence of planning as a whole is for the projects to be scheduled with the shortest duration. As we know, scheduling is a critical and important issue in construction. Resource allocation is one of the scheduling optimization methods. Optimization related problems in construction scheduling are basically classified into three depending on the objectives: timecost trade-off; resource leveling; and resource allocation (Hegazy, 1999). While resource allocation on the other hand is concerned with the minimizing of project duration without exceeding the available resource limits. While it is also important to state another component that goes hand in hand with resource allocation; resource loading. Resource loading is the process of trying to determine the amount of resources required by the individual activities in a project. These resources can be either under or over-allocated to the various activities. This scenario is possible with multiple and parallel activities using similar resources from a common source (Rosso & Randolph, 2001; Song, 2005). On the other hand, resource allocation is an attempt to reschedule the project tasks so that the existing resources can be effectively and
efficiently utilized while keeping the modified construction schedule within the limits of construction schedule. Consequently, few companies can remain relevant in today’s highly competitive construction business without effectively managing their resources, particularly the allowable adjusted resources. Concerning the resource allocation, the basic programme evaluation and review technique (PERT) and CPM scheduling techniques in practice have proven to be helpful only when the project deadline is not fixed and that the resources are not constrained by either availability or schedule, assuming that the resources are neither able to flow from one activity to another, nor flow among different projects. As this is not practical even for smaller projects, the resources in construction are basically fixed in quantity and resource allocation has been used to achieve a nearoptimum result in relation to practical considerations allowing the resources to shift among activities and projects (Song, 2005). 2.1. Construction Industry Overview The construction industry is one of the most critical amongst other industries contributing to the overall welfare of any country. Not only that the monetary value of the industry is large, but also its percentage with respect to a country’s’ gross domestic product (GDP). The industry provides critical services to people in the form of; dams, commercial/residential buildings, roads and airports etc. Furthermore, the industry provides jobs and investment opportunities. In the industrialized countries of the world like, USA, UK, Denmark and Australia, the value of each country’s GDP to the construction industry varies from 5 to 11.3% from 1997 to 1999 and as such the industry is also a major source of employment and entrepreneurial activities. For the aforementioned countries, the construction industry made up to 4.5-11% of its total employment while 8.9-13.7% of the total registered firms invested in construction related activities (Agdas, 2008). It is interesting also to note that construction activities are highly resource-intensive in terms of equipment, labor and material. The cost of material and equipment accounts for about 60% of the total project costs. The most critical challenges for managers in terms of managing
73
B. Amade
projects scarce resources are the trade-off between minimizing cost and completing the project within schedule while also meeting the quality requirements. Although various methods have been developed to address the resource management issues at the project level. There are two main techniques used in handling resource management problems viz, resource allocation, also known as resourceconstrained scheduling, and resources leveling (Agdas, 2008; Hegazy, 1999). Intense competition in the industry is increasing by the day as new firms are gaining entry into the market; other existing companies are enlarging their job opportunities by entering into new construction business opportunities. In other to gain comparative advantage against their rivals, the construction companies must aim to minimize their resource cost by way of minimizing the idle machinery and labor time which requires a good knowledge of planning and scheduling of construction projects (Bettemir, 2009; Nagaraju et al., 2012). According to Bettemir (2009), dwindling resource usage decreases productivity due to fluctuations that often gives rise to idle labour and machine during low resource demand periods of a project. In other to prevent incidences of idle labour, if only firing of labourers is preferred to the execution of the project, too much labour hiring and firing will definitely occur. This may result to additional problems such as excessive decrease in production, problems in hiring labour during certain periods. On the other hand, if idle equipment and machinery is to be prevented by returning the rented machinery and renting it again when needed, may results to additional problems. Increased transportation costs, problems of delivering the machine on time and lack of the availability of the machine to rent in certain periods are some of the problems to be faced for frequent renting and returning of equipment. As a result of this, resource demand profile would be smoothed or leveled as much as possible in order to minimize idle time of the resources. There can be limitations on the hiring of certain labour types or renting of equipments. Besides, there can be imposed limitations on accommodation of the labours in the construction site. As a result of these, there can be limitations on the maximum number of employed labour and/or on the hired
74
machinery. In most of the cases, resource demand profile of the project obtained by taking early start times of the activities into account overrides the resource limits. More so, delays in some of the activities are unavoidable, if these activities lie on the critical path, then project schedule increasing compared with the case of unlimited resources. The aim of resource constrained project scheduling problem is to complete the project in minimum time without overriding the resource limitations. Optimum solution of resource constrained project scheduling problems often gives rise to the shortest project completion time which satisfies the resource constraints and CPM relationships (Bettemir, 2009; Nudtasomboon, 1993). 2.2. Previous Studies Previous studies on construction management as well as practitioners in the industry have realized the importance of resource allocation in construction projects. There is still a divergence of opinion by practitioners on how much effort should actually be invested in construction resource allocation activities in other to achieve better performance during the construction period, as well as how much benefit would accrue through these reallocated resource activities. Moreover, even now some practitioners in the industry are indeed reallocating resources to a certain extent in construction, they just make decisions with their experiences, without a laid down procedure that would take into account the actual external conditions as much as possible, which would assist in adjudging the situation fit (Song, 2005). According to Jun (2010), a handful of resource leveling models and algorithms have been developed over the years to improve resource utilization efficiency by minimizing the level of fluctuations in resource utilization and their attendant negative impact on construction productivity. These models introduced and utilized certain metrics to minimize resource fluctuations. The models include: sum of squares method; changes between actual resource usage and a specified or a uniform resource usage; and sum of squares of resource fluctuations, and difference between resource consumption in consecutive time durations (Akpan, 2000; Hegazy et al., 2000). Others
Serbian Project Management Journal, Volume 6, Issue 1, November 2016
include; mathematical model for resource leveling, integer linear programming models (Nudtasomboon, 1993). Although in smaller projects, resources can be acquired or released in any desired amount while maintaining the use of different resources at a constant rate, this is very important in a large-scale project with multiple resources. Most studies tend to focus on single resource leveling. According to Raja and Kumanan (2007) various heuristic and mathematical approaches for optimal resource leveling have been proposed. Furthermore, Raja and Kumanan (2007) opined that the optimization approaches to resource leveling makes use of enumeration methods. The heuristic approach does not yield an exhaustive outcome and thus the outcome varies from one problem to the other. Despite the contributions of other studies, the proposed study is not intended to reinvent the wheel, but rather depict clearly the application of an optimum resource utilization technique in a typical construction project by way of deploying the Akpan’s method/ heuristics in a typical construction project to determine the optimum utilization of the resources so as to, if not possible, eliminate idle time and resources associated with most construction project resources. The proposed study is expected to avail construction project planners with the means to identifying optimal schedules that maximizes resource utilization efficiency while also achieving project completion constraints. This is expected to contribute to enhancing resource utilization on construction projects and significantly improve productivity and costeffectiveness. 3. RESEARCH METHOD This study adopted a case study method. In this study, data from an ongoing construction of a
lecture theater at the Federal University of Technology, Owerri, Nigeria was utilized. This study applied purposive and convenient sampling techniques. Secondary data in the form of performance data (statement of work program) was collected for purposes of arriving at the research findings. The data was collected from reference materials with emphasis on information considered helpful to this study from the main contractor handling the project. In analyzing the research findings, Microsoft project version 2010 was used in presenting the network diagram and computation of the individual events time, while the main data analysis technique (resource management and optimization using the resource ceiling technique as proposed by Akpan, 1987) was conducted with the aid of programmed software. See also details on how to deploy the Akpan’s method of resource ceiling in (Akpan & Chizea, 2013; Akpan, 1987). The Akpan’s method of resource ceiling uses priority rules in adopting as well as ensuring that the appropriate activity/task was deployed bearing in mind the resources availability and the technological/precedence relationships of the individual activities as elucidated in the network diagram. The first priority rule adopted was the earliest start time; this was followed by the total float of each activity, precedence relationship and the availability of resources at a particular point in time. This necessitated the application of this method (Akpan’s method) in arriving at a solution of a multiple resource optimization problem. Table 1 shows the various activities, their durations, predecessor activities and the four (4) resources namely resources A,B,C and D. The resources has their individual limits within which their usage/deployment would not be exceeded as shown. Each resource has the following limits (ceiling), A=12, B=16, C=15 and D=18.
75
B. Amade
Table 1: Activities, duration and resources profile/ceiling Activities
Predecessors
A Clear Site (A1) B Set Out (A2) A1 C Excavate (A3) A1 D Concreting (A4) A1 E Blockwork(Sub Str) B1 A2 F Backfilling (B2) A3 G Blockwork II (B3) A3,A4 H Reinforce Col & Lin (B4) A4 I Elect & Plum (C1) B1,B2,B3 J Formwork for B3 Beam/Reinforce (C2) K Roofing & Ceiling (C3) B4 L Door & Window (C4) C3,B3 M Plaster/Elect Fix (D1) C1 N Finishing/Painting (D2) C2,C4,D1 Source: Performance data from contracting firm
4. RESULT AND DISCUSSION The findings from the analysis indicate that the duration of the project after being subjected to scheduling using the Microsoft project 2010 software gave a duration of 26 weeks, see table 2. With the introduction of the Akpan’s method in resource management via resource ceiling heuristics, the four (4) resources were subjected to the iteration proper with a view to ensuring that no idle resource exists during the deployment of the individual resources and the actual driving /implementation of the project. The results of the iteration shows
Duration (weeks)
Resources A=12
B=16
C=15
D=18
2 1 2 1 2 2 3 3 5 4
7 6 9 5 6 9 9 8 3 9
3 4 8 7 8 7 10 6 8 8
4 7 6 8 9 8 11 10 4 11
9 8 10 10 7 6 8 9 9 7
3 5 5 9
8 6 5 2
10 8 6 5
9 10 4 3
11 7 10 5
that the project duration extended to 34 weeks as depicted in table 3. In as much as we witnessed this extension in duration, the resource use was optimally achieved as no resource was idle. In carrying out the iteration using the Akpan’s method, the following priority rules were adopted in ensuring that the appropriate activity was deployed bearing in mind the resources. The first priority rule was the earliest start time; this was followed by the total float, precedence relationship and the availability of resources at a particular point in time. Table 3 shows all the iterations from activity A to N respectively.
Table 2: Project activities showing the events times and critical path Activities Durations ES EF LF LS TF CP A 2 0 2 2 0 0 * B 1 2 3 5 4 2 C 2 2 4 4 2 0 * D 1 2 3 4 3 1 E 2 3 5 7 5 2 F 2 4 6 7 5 1 G 3 4 7 7 4 0 * H 3 3 6 9 6 3 I 5 7 12 12 7 0 * J 4 7 11 17 13 6 K 3 6 9 12 9 3 L 5 9 14 17 12 3 M 5 12 17 17 12 0 * N 9 17 26 26 17 0 * ES=earliest start; EF=earliest finish; LF=latest finish; LS=latest start; TF=total float; CP=critical path
Source: Authors analysis using Microsoft project. The project duration is 26 weeks. 76
Serbian Project Management Journal, Volume 6, Issue 1, November 2016
Table 3: Analysis of the resources using the Akpan’s method Activities
Resources
Resources Ceiling A Clear Site (A1) *2nd time B Set Out (A2) *3rd time C Excavate (A3) *5th time D Concreting (A4) *6th time G Blockwork II (B3) *9th time F Backfilling (B2) *11th time E Blockwork (Sub Str) B1 *13th time H Reinforce Col & Lin (B4) I Elect & Plum (C1) *16th time J Formwork Beam/Reinforce (C2) *18th time *20th time K Roofing & Ceiling (C3) *21st time L Door & Window (C4) M Plaster/Elect Fix (D1) *25th time N Finishing/Painting (D2)
for
Time
A 12 7 5 7 12 6 6 6 12 9 3 9 12 5 7 5 12 9 3 9 12 9 3 9 12 6 6 6 12 8 4 3 1 8 9 9
B 16 3 13 3 16 4 12 4 16 8 8 8 16 7 9 7 16 10 6 10 16 7 9 7 16 8 8 8 16 6 10 8 2 6 8 8
C 15 4 11 4 15 7 8 7 15 6 9 6 15 8 7 8 15 11 4 11 15 8 7 8 15 9 6 9 15 10 5 4 1 10 11 11
D 18 9 9 9 18 8 10 8 18 10 8 10 18 10 8 10 18 8 10 8 18 6 12 6 18 7 11 7 18 9 9 9 0 9 9 7
0 3 3 9 12 8 4 8 12 6 6 5 1 6 7 2 5
0 8 8 8 16 10 6 10 16 8 8 6 2 8 10 5 5
0 4 4 11 15 9 6 9 15 10 5 4 1 10 11 3 8
2 9 11 7 18 11 7 11 18 7 11 10 1 7 8 5 3
2nd time
(2nd time +1)=3rd time
(3rd time +2)= 5th time
(5th time +1)=6th time
(6th time +3)=9th time
(9th time +2)=11th time
(11th time +2)=13th time
(13th time +3)=16th time (13th time +5)=18th time
(16th time +4)=20th time
(18th time +3)=21st time
(20th time +5)=25th time (21st time +5)=26th time
(25th time +9)=34th time 77
B. Amade
Project duration is 34 weeks Source: Authors analysis using Akpan’s method with the aid of a programmed software
Figure 1: Microsoft project 2010 window displaying project details and gantt chart
Figure 2: Microsoft project 2010 window displaying the project network
78
Serbian Project Management Journal, Volume 6, Issue 1, November 2016
5. CONCLUSIONS Based on the results of the findings, the following conclusions were arrived at: The Akpan’s method was deployed with a view to minimize the undesired idle resource scenario typically experienced in construction related projects. The findings from the iteration demonstrate the need for better heuristics solving construction project’s resource usage. The results further revealed that the Akpan’s method is a good alternative for solving the resource needs and problems bedeviling the construction industry. Hence, the provides a powerful alternative for minimizing the undesirable fluctuations in resource utilization profile with a view to achieve an efficient and optimal construction project schedules. In as much as this method yielded to some extent a reasonable and adequate result, it may require some improvements to solve large and multiple resources more than the number deployed in this study. Using other heuristics with a mild review of the priority rules may further provide a potential for further improvement with a view to achieve an algorithm that can efficiently and effectively solve the problems of optimum resource utilization for large size construction firms. LITERATURE Abd, A.M. & Abd, S.M. (2012). Resources sustainability planning model using hierarchical approach for construction project. Diyala Journal of Engineering Services, 5(2), 1-19. Agdas, D. (2008). Corporate-level management system for critical strategic resources for large construction program managers. Doctoral Thesis of the University of Florida. Akpan, E.O.P. & Chizea, E.F. (2013). Project management: Theory and practice. (5th Ed). FUTO press Ltd, Owerri. Akpan, E.O.P. (1987). A stochastic network scheduling system for optimum resource utilization. Doctoral Thesis of the University of Bradford. Akpan, E.O.P. (2000). Priority rules in project scheduling: A case of random activity
selection. Production Planning and Control, 11(2), 165-170. Bettemir, O.H. (2009). Optimization of timecost resource trade-off problems in project scheduling using meta-heuristic algorithms. Doctoral Thesis of the Middle East Technical University. Chigara, B. & Mangore, E. (2012). An analysis of the implication of resources management on building projects performance in Harare and Bulawayo. International Journal of Marketing and Technology, 2.(9), 144-170. Hegazy, T., Shabeeb, A.K., Elbeltagi, E. & Cheema, T. (2000). Algorithm for scheduling with multiskilled constrained resources. Journal of Construction Engineering and Management, 26.(6), 414-421. Hegazy, T. (1999). Optimization of resource allocation and leveling using genetic algorithm. Journal of Construction Engineering and Management, 125.(3), 167-175. Jun, D.H. (2010). Multi-objective optimization for resource driven scheduling in construction projects. Doctoral Thesis of the University of Illinois at UrbanaChampion. Lu, M. & Li, H. (2003). Resource-activity critical-path method for construction planning. Journal of Construction Engineering and Management, 129 (4), 412-420. Memon, A.H. & Zin, R.M. (2010). Resourcedriven scheduling implementation in Malaysian construction industry. International Journal of Sustainable Construction Engineering and Technology, 1(2), 77-89. Mendoza, C.E. (1995). Resource planning and resource allocation in the construction industry. A Master’s Thesis of the University of Florida. Nagaraju, S.K., Reddy, B.S. & Chaudhuri, A.R. (2012). Resource management in construction projects-A case study. Engineering Science and Technology: An International Journal, 2.(4), 660-665. Nudtasomboon, N. (1993). A methodology for the multi-objective resource-constrained
79
B. Amade
project scheduling problem. Doctoral Thesis of the Oregon State University. Raja, K. & Kumanan, S. (2007). Resource leveling using Petrinet and Memetic approach. American Journal of Applied Sciences, 4(5), 317-322. Rosso, M. & Randolph, P. (2001). Project management and the application of tools to control allocate and schedule project
80
resources. A Graduate Seminar Report of the California State University Fresno. Saleh, M.F.S. (2012). Flexible scheduling for construction projects. Master’s Thesis of the University of Sharjah, UAE. Song, C. (2005). Multi-resource allocation across multi projects by subcontractor. A Master’s Thesis of the University of Florida
Serbian Project Management Journal, Volume 6, Issue 1, November 2016
BRIDGE THE GAPS, RETAIN THE TALENTED MILLENNIALS Marija Todorović, Milica Pavićević Faculty of Organizational Sciences, University of Belgrade, Serbia Abstract: The purpose of this research was to explore and define key characteristics that distinguish the generation of Millennials, workforce that will represent 50% of the global workforce by 2020 and to define strategic framework for creating an organization which is desirable employer. The paper is based on the work presented at the conference- XV International Symposium SYMORG 2016- Reshaping the future sustainable business development and entrepreneurship. This paper considers evaluation of results on key elements that constitute challenging and enriching workplace environment, according to Millennials, which encourages them to thrive and give their best. This paper presents theoretical and practical overview and comparison of Millennials’ expectations, both in Serbia and worldwide. The research showed that in order to attract and retain Millennials at workplace, employers should create a flexible work culture, build a sense of a community through teamwork and provide a constant feedback. In addition, organizations should embrace new technologies and social networks, encourage learning and allow faster advancement. Foundationally, it is essential to understand the Millennials’ mindset and reshape the world of work in accordance with the expectations of this new workforce entering the employment. Key words: Millennials, Millennials’ traits, shaping organization, strategic management, research, workplace engagement MILLENNIALS.
of the Millennial generation is their affinity with the digital world”.
The Millennial generation, also known as Generation Y, Net Generation or Generation Next, is generation that follows Generation X. Millennials are, according to the PwC survey (Millennials at work – Reshaping the workplace, 2011), those born between 1980 and 2000. They are now entering the workplace and reshaping it toward their needs. Their career objectives, ambitions, attitudes about work and, in general, their mindsets will have a huge influence on the working world in the future years.
Besides being tech-savvy, there are other characteristics that are defining the Millennial generation. As DeVaney (2015) puts it “traits attributed to the Millennials include: entitled, optimistic, civic minded, close parental involvement, values work-life balance, impatient, multitasking, and team oriented. As found in many surveys, Millennials are also described as sociable, talented, well-educated, collaborative, open-minded, influential, and achievement-oriented (Raines, 2002). What also distinguishes Millennials from the previous generations is their desire “to feel like they are a part of something and that they can make a difference in the world and workplace” (Spano, 2015).
1. INTRODUCTION: WHO ARE THEY?
Millennials were identified as “digital natives” in the Pew Research Center’s survey Millennials in Adulthood (2014). As Bannon, Ford and Meltzer (2011) point out Millennials are more technologically savvy and better educated than the previous generations. The PwC survey (2011) suggest that “they have grown up with broadband, smartphones, laptops and social media being the norm and expect instant access to information”, which implies that “one of the defining characteristics
Millennials are also described as “selfish generation” by some; and as we can see from the PwC survey (2011), they have “ambition and desire to keep learning and move quickly upwards through an organization”, “they want to feel their work is worthwhile and that their efforts are being recognized”, but are willing to
Corresponding author. Email:
[email protected] ISSN 2217-7256 (online) © 2016 YUPMA www.spmjournal.rs
81
M. Todorović, M. Pavićević
“move on quickly if their expectations are not being met”. Wasley (2015) agrees by saying that Millennials have “unrealistic expectations about the workplace and a propensity to jobhop rather than settle for a career they find unfulfilling”, and adding that they “value creativity and a flexible work environment over stability”.
characteristics of the Millennial generation. These traits include their advanced technological skills, as well as their attitudes toward work and life balance, loyalty, social responsibility, development, collaboration, and diversity.
Influenced by the global Economic crisis, Millennials tend to value their personal needs more than those of the organization, as the PwC survey (2011) suggests. The PwC survey also shows that Millennials expect rapid progression, an interesting career, constant feedback, encouragement, but in the same time, they also want flexible approach to work.
Millennials, the first generation to experience globalizing world, are often referred to as “digital natives”. Being tech-savvy is one of the main characteristics of today’s youth and that can be seen in many aspects of their lives. As Bannon, Ford and Meltzer (2011) point out “they grew up untethered - with wireless devices, workplace mobility, and texting—and remain connected with friends via social networks”. According to the Pew survey (2010), about 75% of Millennials are members of an online social network.
We have conducted a survey among Serbian students, which will be presented hereafter, in order to see what they are looking for in an employer. The results we got are similar to those shown above. Namely, among most important criteria, when choosing an employer, are opportunities for advancement and learning, good working conditions (working hours, work-life balance etc.) and work environment (atmosphere at the workplace, collaboration, recreation opportunities etc.). As found in Pew Research Center’s article by Bruce Stokes (2015), Millennials represented 24% of the adult population in the European Union in 2013, and, on the other hand, they formed about 27% of the adult population in the United States in 2014. According to the PwC survey (2011), Millennials will represent half of the global workforce, by 2020. It is clear that Millennials will have a huge impact on the organizations and on the way they operate. They will certainly influence many changes in the workplace, thus becoming one of the major challenges that employers need to deal with. That is why it is really important for companies to understand Millennials and to attract the best among them. The key is not to specifically target Millennials, but rather create work environment appealing to this generation. 2. THE MAIN TRAITS OF MILLENNIAL GENERATION
THE
Combining the key findings from different surveys, we have identified a few distinct 82
2.1. Tech-savvy
Palmer (2015) states that “employees expect companies to use the latest technology and be committed to improving technology on a frequent basis”, because “technology allows employees to work remotely; employees can work smarter, not harder by using technology, and technology allows managers to focus on the results through better data tracking versus the number of hours an employee is sitting in the office”. Employers usually criticize their employees when they are texting or connecting to some of the social networks. But Millenials are actually turning online social networks into business opportunities, observed Lancaster and Stillman (The M-Factor: How the Millennial Generation Is Rocking the Workplace, 2010). According to the Pew survey (2010), a majority (56%) of Millennials think technology helps people use their time more efficiently. As found in the PwC survey (2011), more than 50% of the respondents use their own technology at work daily and 78% said that access to the technology they like to use makes them more effective at work. This survey (PwC: Millennials at work - Reshaping the workplace, 2011) also suggests that “Millennials will expect a workplace technology ecosystem that includes social networking, instant messaging, video-ondemand, blogs and wikis”, because “these
Serbian Project Management Journal, Volume 6, Issue 1, November 2016
social tools will enable this generation to instantly connect, engage, and collaborate with cohorts and managers in ways that are natural to them, leading to better productivity across the enterprise”. 2.2. Work-life balance According to the Pew survey (2010), to Millennials, as well as to all the other groups, family matters the most, while fame and fortune are much less important. Both, the Generation Y and the Generation X place a higher value on family relationships than career goals. Spano (2015) points out that “Millennials have become accustomed to flexible work styles and want to have a “life” outside of their careers”. Moreover, Krupienski (2016) says that worklife balance is generally regarded as more important criteria than the compensation. In Global Millennial survey (INSEAD, 2014), 58% of respondents said they would spend time with family if given the opportunity to prioritize. Bannon, Ford and Meltzer (2011) noticed that importance of Millennials’ life goals such as spending time with family, having a healthy marriage, and being a good parent may cause transformation of the conventional (nine-to-five) working hours into a more elastic time frame; and that is because they are “willing to trade security and stability for the ability to better integrate their professional and personal lives”. PwC’s NextGen Study (2013) shows that “Millennials want more flexibility, the opportunity to shift hours—to start their work days later, for example, or put in time at night, if necessary”, and not only Millennials want that, but other employees as well. Furthermore, Ludden emphasizes that retention rates have dramatically increased at companies that offer flextime or part-time telecommuting (Jennifer Ludden, When Employers Make Room for Work-Life Balance, NPR, 2010). That is why companies must focus on providing more flexible working schedules. 2.3. Loyalty-lite The PwC survey (2011) shows that over 25% of the Millennial generation expects to have six employers or more, compared to only 10% in
2008. Why is that so? This survey explains: “Millennials have seen that corporate loyalty does not necessarily bring rewards or even long term security in today’s economic environment“. That is the reason why many Millennials are checking out new opportunities, even if they are not actively looking for a new job, which leads to these results: “38% of the Millennials questioned, who are currently working, said they were on the lookout for new opportunities, and a further 43% said they were not actively looking, but would be open to offers“. Millennials want to work in a workplace that meets their needs, and if it doesn’t, they will not hesitate to leave the current organization. Krupienski (2016) also points out that Millennials are “more apt to move to the next job than older generations would have been“, “if they feel that they are in a place where their personal values are not being satisfied“. Moreover, Millennials are not only willing to switch employers, i.e. to go to work for competitors, but also many of them have ambitions to create their own businesses, which makes it even harder for organizations to keep them engaged. Therefore, employers certainly need to make an effort to understand Millennials’ needs and desires, in order to attract them, on the one side, and to decrease the turnover rate, on the other side. 2.4. Social responsibility Although Millennials are often described as selfish generation, that is not completely true. On the contrary, they are eager to help their communities and to feel useful. Pew survey (2010) reveals that many Millennials have a strong desire to contribute to their communities. Data shows that 88% of Millennials seek employers with social responsibility values that reflect their own. Many among the Millennial generation would accept to work for lower wage if their work contributed to the community, i.e. if they feel like they are doing something important and meaningful for the environment they are living in. 2.5. Development The PwC survey (2011) indicates that „Millennials’ desire to learn and progress is apparent in their view of the benefits offered by 83
M. Todorović, M. Pavićević
employers“. They actually would like to get, as an award, training and development and flexible working opportunities more than financial benefits. This survey also suggests that „Millennials expect to keep on learning as they enter the workplace“, and that opportunities for learning are very important criteria when choosing an employer, but also among the benefits they value the most. Palmer (2015) says that Millennials are in constant need of getting a feedback on their performance. As found in the PwC survey (2011): “One of the strongest Millennials’ traits is that they welcome and expect detailed, regular feedback and praise for a job well done – 51% of those questioned said feedback should be given very frequently or continually on the job and only 1% said feedback was not important to them”. Esoda (2013) emphasize that Millennials require immediate recognition for their accomplishments, especially because of the emerging usage of social media. Palmer (2015) points out that Millennials “want to constantly grow in positions, learn more, take on more responsibility, and know they are trusted to make profitable changes”. Lancaster and Stillman (2010) have also mentioned that „whether they expect perks before others think they have earned them or they want to move up the career ladder in record time, Millennials have been labeled as entitled“. The PwC survey (2011) reveals, likewise, that „career progression is the top priority for Millennials who expect to rise rapidly through the organization; 52% said this was the main attraction in an employer, coming ahead of competitive salaries in second place (44%)“. 2.5. Collaboration Lancaster and Stillman (2010) describe Millennials as generation raised in a time of team projects and group scores. Therefore, they are in need of a pleasant working atmosphere and good professional networks, which will enable them to keep up the team spirit. Krupienski (2016) suggests that Millennials want to have fun. That means that the work environment needs to be lively and positive. Employers should make an effort in meeting the needs of this generation by creating a positive workplace. But employers also need to 84
listen, meet with the Millennial workforce, seek and give feedback, mentor them, and take what they have to say seriously. 2.7. Diversity Bannon, Ford and Meltzer (2011) explain that today's workforce is among the most complex, with many generations and cultures working together, and, therefore, business activities have become more globally connected than ever before. That brings a need for having intercultural communication skills. They also label Millennials as a diverse and inclusive generation. Thus, it is easier for the Millennial generation to imagine a world without boundaries: they want global experience and they are connected through social media with different people all over the world. Therefore, they are ideal candidates for international assignments. According to the PwC survey (2008), 80% of Millennials expect to work in other countries and 70% expect to learn and use a foreign language in their careers. 3. RESEARCH METHODOLOGY Research was conducted in the February 2016, and with the sample of 192 students from the University of Belgrade, in Serbia. Data is collected using online questionnaire, which can be found on https://docs.google.com/forms/d/1By7ddgwL 5XyScOETOHrAMOsGfC6zZC14SF_V50M SXxI/viewform, in Serbian language. The main objective of this survey is to provide practical research about Millennials’ view on how business should be performed and what are the main characteristics of employers that they seek and appreciate at work. Considering the fact that the Millennial generation has increasing share of the workforce, employers need to understand what Millennials overwhelmingly believe in - and that is business reset in terms of paying more attention to people and their needs. Sample consisted of 192 respondents; most of them (59 (30.7%) out of 192) were students from third and (44 (22.9%) out of 192) students from second year of study. Further, 16 (8.3%) respondents were students of Masters and PhD studies, 32 (16.17%) students from first year, 36 (18.8%) students of fourth year of study, and the rest - 5 respondents, were students from fifth and sixth year.
Serbian Project Management Journal, Volume 6, Issue 1, November 2016
Table 1: Sample characteristics Characteristics Year of study First Second Third Fourth Fifth Sixth Post-graduate (Masters and PHD studies) Sex Male Female Respondents in the target population of Millennials completed a total of 192 surveys, where male comprised 34.4% of the respondents, and female 65.6%. The research results and discussion are presented in following section.
N (%) 32 (16.7%) 44 (22.9%) 59 (30.7%) 36 (18.8%) 3 (1.6%) 2 (1%) 16 (8.3%) 66 (34.4%) 126 (65.6%) 4. RESULTS AND COMMENTS A survey and data analysis revealed important elements and criteria that contribute in creating a challenging, productive and motivating work environment for the next future leaders students belonging the generation of Millennials. Following are the research findings.
Table 2: The most important criteria when choosing an employer
(%)
Opportunities for learning Opportunities for advancement Challenging assignments Working environment (atmosphere at the workplace, collaboration, recreation opportunities etc.) Good working conditions (working hours, work-life balance etc.) Team spirit Compensation Social responsibility International company/Prestige Organization’s mission Springboard
(87.4%) (92.1%) (61.2%)
An analysis of the data collected from online survey, that was conducted among Millennials in Serbia, showed that the most important and respected factor mentioned by majority of respondents is opportunity for advancement with 92.1%. Millennials in Serbia, as a future dominant workforce, recognize the full worth of opportunities for learning with 87.4%, as one of the leading criteria when choosing future employer or when evaluating existing. Also, a quite large percentage, even 83.3% representatives of “Me generation”, stressed that good working conditions relating to
(81.2%) (83.3%) (52.4%) (83.2%) (50.8%) (36.6%) (45.1%) (82.7%)
working hours and work- life balance, are key motivators for them. Following are criteria such as compensation with 83.2%, springboard with 82.7% and work environment with high level of collaboration, various opportunities for recreation and good working atmosphere with 81.2%. Setting aside the previous chosen criteria, one of the key findings of this survey, that employers in Serbia can use in order to create inspiring work environment for Millennials, is the fact that 61.2% of respondents identified challenging assignments as one of the key drivers at work. This is not surprising since most young workers appreciate working on 85
M. Todorović, M. Pavićević
vitally important projects that allow them to expand their knowledge and use new skills (The Ken Blanchard Companies: Creating A Motivating Work Environment, 2009). On the other hand, research has shown that young people in Serbia, who belong to this generation, in most cases, ignores international presence and prestige when choosing an employer, where 50.8% of them consider social responsibility more important factor.
5. COMPARATIVE ANALYSIS To broaden our understanding of Millennials’ expectations from work and how organizations should shape their work environment, we have compared the obtained results with those from Collegefeed Survey, published by Harvard Business Review, which contains answers of 15,000 polled Millennials worldwide. We have found that some assumptions and results are common for Millennials in Serbia, while others are not.
Figure 1: What Millennials look for in employers, HBR Even if criteria like company mission and market leadership are expected to be on the top of the priorities, people and culture fit and career potential are leading with more than 70%, which is similar to the responses of Serbian Millennials. Interestingly, Millennials in Serbia and worldwide, attach little importance to the company mission, reputation and its public image. When it comes to evaluating employers and work environment, this generation of trophy kids, both in Serbia and worldwide, attach the most importance to a good work-life balance. They strongly believe in life afer work and higly appreciate it more than any other generation before. Respondents in Serbia, 83.2% of them, evaluate compensation, as key criteria, on 86
higher level, than respondents worldwide (about 60%). Even though compensation as criteria is recognized as important, for the representatives of this generation, in both studies, it is in the fourth place. Globally, teamwork is ranked fairly high, while among Millennials in Serbia this percentage is much lower. The cause of this probably lies in the education system and the methods used during the years of education, which vary from those implemented in the system of education that is used worldwide. 6. STRATEGIES FOR MAXIMIZING MILLENNIALS IN THE WORKPLACE Bearing in mind the size that the Millennial population will reach up to 2020 and their impact on the business environment that they
Serbian Project Management Journal, Volume 6, Issue 1, November 2016
already have which is reflected through the expectations related to their work post and the environment within the organization in which they will work or are already working, it is important to create appropriate strategies to attract, develop and, ultimately to retain talented representatives of “Generation Y” within organizations.
and the environment. Staff mentorship programs within the organization designed for this generation represent an organizational imperative in strategic terms, taking into account the fact that one of the most powerful features of this generation is the need for praise and feedback on the work done. (Suleman, & Nelson, 2011)
Analysing the results of the above-mentioned research published in the Harvard Business Review that includes expectations of this generation in the world, as well as the results of a survey conducted among the Millennial generation in the Republic of Serbia on motivational factors that affect job satisfaction and the most important criteria they use when assessing and evaluating organizations in which they work, it can be concluded that the image and functioning of business organizations will change to a large extent, and so will the organization of work.
“Trophy kids” generation was shaped by educational systems in which everyone, even based on participation only, receives a certain type of reward, or trophy for tasks (not)accomplished. They are raised in families of “helicopter parents”, with constant presence, support and praise for everything they do, which has subsequently led to the fact that members of the “Generation Y” expect the same in their business environment, or from their supervisors.
Facing the characteristics that distinguish nearly 80 million members of this generation who are on the verge of entering the world of business or have already become a part of it, in order to gain competitive advantages and timely adjust their business to the upcoming generation of employees, managers within the organizations must develop HR strategies and practices which are the key for motivation of this generation, and to develop and use of their potentials in the context of the work environment. Also, taking into account their readiness and tendency to change employers or workplace, in addition to identifying and understanding, it is important to meet their expectations of work environment and organizations and provide them with adequate support in professional development, in order to retain hard working and talented employees, i.e. the representatives of the Millennials. 6.1. Mentoring, direction
feedback
and
work
According to the Deloitte Millennial Survey (2016), it was noticed that loyalty of the Millennial employees is directly related to the support that their superiors provide to their career development, ambitions and professional progress, where 83% of the interviewed millennials with mentors at work expressed satisfaction with this aspect of work
The mentoring support through business dealings of the Millennials and providing regular feedback on the work done, together with praise, will make the employees, which belong to this generation, involved in their work, loyal to their organizations and increase their satisfaction with the work environment and the organization in which they are engaged. (Brack, 2012) According to Jenkins (2008) different mentoring models are available for organization, such as “one-to-one” mentoring support, senior mentoring program and discussion panels, group mentorship, and a “speed-mentoring” program, where employees can, sitting across the expert, ask quick questions about the organization, job and other issues. Also, taking into account their need for purposefulness and drive for learning, the introduction of Reverse mentoring program, where young members of the Millennial generation are mentors to the senior employees, as a support to the development of their knowledge and use of new technologies, would encourage the development of these employees and their job satisfaction. (Behrens,2009) The Millennials should be assigned with challenging, but structured tasks and to have a broader picture as to how the part of the work 89
M. Todorović, M. Pavićević
that they do affect the organization as a whole, its mission, strategic goals and values shared in that organization. In addition, they need to be presented with measurement systems with clear expectations in terms of the results in the execution of their jobs or tasks, in order to have guidelines for their progress and measurement methods that will serve as the grounds for their evaluation. (Suleman, & Nelson, 2011) 6.2. “Grow potential” culture and personal development The representatives of Generation Y, also known the Millennials, want an environment that inspires them and drives them to provide their selfless and creative contribution to the realization of the work, without fear of being criticized, or what is worse, of losing their feedback. Keeping in mind the results of research on the attitudes and preferences of the Millennials across the world and in our country, an organization that wants to retain talented representatives of this generation must put the greatest emphasis on creating opportunities for on-the-job learning, development of abilities, skills and knowledge, but also on the opportunities for career advancement of these employees. The Millennials are committed to learning and career development. According to the results presented in the Millennial Survey (2016), the study recently conducted by Deloitte, the target group of the members of this generation expressed greater degree of loyalty to the organization that takes into account the personal circumstances of its employees for growth and professional development, as well as to culture it nurtures in this context. The main purpose of an organization that wants to use the potential of this upcoming workforce is to support them in their professional development and advancement. It is necessary to give them the sense that their work is meaningful and part of a higher cause. Any sort of training, certification, professional advancement, further education or learning is an important step in further career advancement for the members of this
90
generation and it is of great importance to them. In addition to their desire to learn, another important feature of “Trophy Generation” is their desire for advancement. They are often frustrated by the amount of time they need to make progress in their careers within organizations, and it often represents the factor and cause of their dissatisfaction with the work environment and organization, and the reason for leaving. Unlike previous generations, they expect and want much faster progress, and that is why organizations, according to the results of PwC Survey (2011), need to understand personal and professional ambitions of the employees and allow them the opportunity for faster promotion. One of the possible steps of a company is the introduction of new positions within the organization, and internal employment or role switching, which can meet the needs of this generation and their expectations in terms of professional advancement. 6.3. Motivational meaningful rewards
environment
and
According to Suleman and Nelson (2011), the “Net Generation”, as they are also called, identifies its business environment as challenging and inspiring if there is such a reward system in place that provides rewards that are creative, personalized and diverse. If an employee receives creative award from its organization for the work efficiently and well done, and if that reward implies uniqueness, fun and diversity, but at the same time, it is personalized according to the individual interests of the employee, such employee has a greater sense of satisfaction with the work in such an environment, and a stronger sense of belonging, which consequently affects the retention of talented employees within the organization. According to Balda and Mora (2011), organizations are nowadays faced with more intensive requirements of the upcoming millennial employees in terms of their expectations of the work environment, and in that respect they suggest creating more flexible organizational structures that put emphasis in their business on people, their relationships,
Serbian Project Management Journal, Volume 6, Issue 1, November 2016
communication channels they use and creativity in the realization of business activities in order to create an environment within which the members of this generation will be able to develop, demonstrate their business abilities to the maximum and, ultimately, to stay and to provide important contribution to further development of organizations’ businesses. 7. CONCLUSION As Popovic, Maletic and Paunovic (2015) pointed out, creating encouraging work environment as well as an adequate evaluation of the work performed represents a strategic priority and key task for further motivation of employees. The aim of this paper is to improve the previous research and define strategic framework for creating an organization in which Millennials can best flourish.
connect with people, encourage learning and allow faster advancement - in order to attract and retain Millennials within the organization. ACKNOWLEDGMENTS This paper is a result of Strategic Project founded by Ministry of Education and Science of Republic Serbia: Exploring modern trends of strategic management of the application of specialized management disciplines in the function of the competitiveness of Serbian economy, No 179081.
The Millennial generation will represent 50% of the global workforce, by 2020. This generation has many specific characteristic that differentiate it from all the previous generations. This is why organizations find it challenging to create a workplace which is appealing to the Millennial generation. Obradović (2009) also points out that creating a motivating work environment is a great challenge for managers because different types of employees expect different working conditions, depending on the generation belonging. According to Bannon, Ford and Meltzer (2011) “the challenge for businesses will be to motivate Millennials by playing to their technological strengths, embracing social networking relationships, celebrating their diversity, and helping them balance work and family”. The PwC’s NextGen study (2013) suggests that emotional connection drive retention, and emotional connection can be created through providing a work-life balance, engaging work, development, different opportunities, but also through people and teams, and last, but not the least, through competitive pay. According to this study, employers should create a flexible work culture, build a sense of a community through constant feedback, 89
M. Todorović, M. Pavićević
LITERATURE Agrawal, S., (2014), How Companies Can Attract the Best College Talent, Harvard Business Review Balda, J. B., & Mora, F. (2011). Adapting leadership theory and practice for the networked, millennial generation. Journal of Leadership Studies, 5(3), 13-24. Bannon, S., Ford, K., & Meltzer, L. (2011), Understanding Millennials in the Workplace, The CPA Journal, New York State Society of CPAs Behrens, W. (2009). Managing millennials. Marketing Health Services, 29(1), 19-21. Blanchard, M., (2009), Creating A Motivating Work Environment, The Ken Blanchard Companies: Office of the Future Brack, J. (2012). Maximizing Millennials in the workplace. UNC Executive Development, 1-14. Deloitte, (2016), Winning over the next generation of leaders: The 2016 Deloitte Millennial Survey DeVaney, S., (2015), Understanding the Millennial Generation, Journal of Financial Service Professionals Esoda, E. J., (2013), Keep these points in mind when recognizing Millennials in the workplace, Central Penn Business Journal INSEAD, (2014), Global Millennial survey Jenkins, J. (2008). Strategies for managing talent in a multigenerational workforce. Employment Relations Today, 34(4), 19-26. Krupienski, J. (2016), Millennials and Your Business: This Generation Is Already Making a Seismic Statement, Business West Lancaster, L. & Stillman, D., (2010), The MFactor: How the Millennial Generation Is Rocking the Workplace, Harper Business Ludden, J., (2010), When Employers Make Room for Work-Life Balance, NPR Obradović, V., (2009), Motivators: What sets project teams in motion?, Project Managament Association of Serbia YUPMA, Belgrade, Serbia Palmer, T., (2015), Millennial Employees’ Role in the Modern Workplace, Production Machining
90
Pew Research Center, (2010), Millennials: Confident. I Connected. Open to Change Pew Research Center, (2014), Millennials in Adulthood Popović, B., Maletić, R., & Paunović, T. (2015). Employee satisfaction survey in function of business improvement. Management, 76. PricewaterhouseCoopers (PwC), (2008), Managing the Millennials: HR Survey of Recent Graduates PricewaterhouseCoopers (PwC), (2011), Millennials at work – Reshaping the workplace PricewaterhouseCoopers (PwC), (2013), PwC’s NextGen: A global generational study - Evolving talent strategy to match the new workforce reality Raines, C., (2002), Connecting Generations: The Sourcebook - Managing Millennials Spano, K., (2015), Millennials and the workplace: Recruiting the best and brightest, New Hampshire Business Review Stokes, B., (2015), Who are Europe’s Millennials?, Pew Research Center Suleman, R., & Nelson, B. (2011). Motivating the millennials: Tapping into the potential of the youngest generation. Leader to Leader, 2011(62), 39-44. Wasley, P., (2015), Understanding Millennial' traits will help you prepare for succession, Family Business Magazine
SERBIAN PROJECT MANAGEMENT ASSOCIATION
Moving PM Competence Forward The IPMA four level certification program is world leading and professionally demanding. By the end of 2012 there were more than 170,000 IPMA certificants worldwide, with over 57, 000 of them Advanced, Competence-based, professionally-assessed certifications in IPMA's 4-L-C, FourLevel Certification system. These include: IPMA Level A®(Certified Projects Director), IPMA Level B® (Certified Senior Project Manager) or IPMA Level C® (Certified Project Manager). These certificates are noteworthy, as the demand from executives, strategic leaders, managers and stakeholders for individuals with demonstrated Project, Programme and Portfolio Management competence spreads globally. The remaining 65% of our certified individuals are IPMA Level D® (Certified Project Management Associate). This designation is similar to the examoriented, knowledge-based certifications of other major Project Management associations. In the IPMA approach, this certification is the best first step towards a professional project or programme manager role demonstrating the individual’s ability to understand the basics of project management.
Does your organisation demonstrate the PM Competence Difference? Do you? www.yupma.rs/yupma/sr/sertifikati
FAKULTET ZA PROJEKTNI I INOVACIONI MENADŽMENT NASTAVNI PLAN OSNOVNIH AKADEMSKIH STUDIJA - PROJEKTNI MENADŽMENT I GODINA I Semestar • Menadžment • Osnove ekonomije • Informatika I • Engleski jezik I
II Semestar • Teorija upravljanja projektom • Matematika • Informatika II • Engleski jezik II II GODINA
III Semestar • Strategijski menadžment • Alati za upravljanje projektima • Teorija organizacije • Osnove finansija
IV Semestar • Osnove marketinga • Softverski paketi za upravljanje projektima • Upravljanje ljudskim resursima - Izborni • Upravljanje promenama u projektu - Izborni • Upravljanje rizikom projekta - Izborni (Studenti biraju dva izborna predmeta) III GODINA
V Semestar • Upravljanje investicionim projektima • Projektni menadžer i timski rad • Program menadžment – Izborni • Upravljanjeprojektima u javnom sektoru - Izborni • Preduzetništvo – Izborni (Studenti biraju dva izborna predmeta)
VI Semestar • Projektni portfolio menadžment • Upravljanje informatičkim projektima • Projektna organizacija - Izborni • Izrada biznis plana - Izborni • Upravljanje komunikacijama u projektu - Izborni (Studenti biraju dva izborna predmeta) Praksa i završni rad
NASTAVNI PLAN MASTER AKADEMSKIH STUDIJA - PROJEKTNI MENADŽMENT I GODINA I Semestar • Savremeni menadžment • Metodologije projektnog menadžmenta • Pravci razvoja projektnog menadžmenta
II Semestar • Upravljane znanjem • Projektno liderstvo • Upravljanje kvalitetom projekta II GODINA
III Semestar IV Semestar • Upravljanje kapitalnim projektima – Izborni • Praksa • Upravljanje biznis i društvenim projektima – Izborni • Završni rad • Upravljanje ugovaranjem u projektu - Izborni • Informacioni sistemi u organizaciji - Izborni • Krizni menadžment - Izborni • Projektno finansiranje - Izborni (Studenti biraju tri izborna predmeta)
WWW.PMC.EDU.RS
FAKULTET ZA PROJEKTNI I INOVACIONI MENADŽMENT NASTAVNI PLAN OSNOVNIH AKADEMSKIH STUDIJA - POSLOVNI I INOVACIONI MENADŽMENT I GODINA I Semestar • Menadžment • Osnove ekonomije • Informatika I • Engleski jezik I
II Semestar • Teorija upravljanja projektom • Matematika • Informatika II • Engleski jezik II II GODINA
III Semestar • Strategijski menadžment • Proizvodni menadžment • Teorija organizacije • Poslovne finansije
IV Semestar • Inovacioni menadžment • Menadžment tehnologije • Upravljanje ljudskim resursima - Izborni • Marketing menadžment - Izborni • Upravljanje promenama - Izborni (Studenti biraju dva izborna predmeta) III GODINA
V Semestar • Ekološki menadžment • Investiciono odlučivanje • Biznis inovacije - Izborni • Preduzetništvo – Izborni • Upravljanje komunikacijama - Izborni (Studenti biraju dva izborna predmeta)
VI Semestar • Upravljanje inovacionim projektima • Savremeni menadžer • TQM - Izborni • Izrada biznis plana - Izborni • Menadžment MSP - Izborni (Studenti biraju dva izborna predmeta) Praksa i završni rad
NASTAVNI PLAN MASTER AKADEMSKIH STUDIJA - POSLOVNI I INOVACIONI MENADŽMENT I GODINA I Semestar • Savremeni menadžment • Liderstvo • Inovacije i preduzetništvo
II Semestar • Elektronsko poslovanje • Upravljanje znanjem • Operativni menadžment II GODINA
III Semestar • Upravljanje finansijskim rizikom - Izborni • Finansijski menadžment - Izborni • Menadžment u javnom sektoru- Izborni • Krizni menadžment - Izborni • Upravljanje rizikom -Izborni • Upravljanje tehnološkim inovacijama - Izborni (Studenti biraju tri izborna predmeta)
IV Semestar • Praksa • Završni rad
WWW.PMC.EDU.RS
FAKULTET ZA PROJEKTNI I INOVACIONI MENADŽMENT NASTAVNI PLAN DOKTORSKIH STUDIJA I GODINA Metodologija naučnoistraživačkog rada Savremeni projektni menadžment Izborni predmet 1: Teorija menadžmenta Upravljanje ljudskim resursima na projektu Izborni predmet 2: Strategijski projektni menadžment Savremene metode upravljanja projektima II GODINA Izborni predmet 3: Upravljanje poslovnim rizikom Projektni menadžer i vođenje tima Izborni predmet 4: Upravljanje znanjem i organizaciono učenje Informaciona podrška upravljanju projektima Doktorska disertacija 1 - Teorijske osnove Doktorska disertacija 2 – Izrada projekta istraživanja, definisanje teme i prijava teze III GODINA Doktorska disertacija 3 – Preliminarno istraživanje Doktorska disertacija 4 – Sprovođenje istraživanja Doktorska disertacija 5 – Izrada i odbrana
WWW.PMC.EDU.RS