ISSN 2278-0580
Aluminum in food : Dietary exposure among adolescent residents in the food catering establishments in Alexandria, Egypt Nermin A. Osman*, Adel Zaki*, Neveen F. Agamy** & Gihan M. Shehata*
*Biomedical Informatics and Medical Statistics Department, Medical Research Institute, Alexandria University, Egypt **Food Analysis and Safety Centre, Nutrition Department, Alexandria University, Egypt
Corresponding Author Nermin Ahmed Osman
[email protected]
ABSTRACT Cooking in aluminum utensils is an avoidable common source of exposure. A dietary aluminum exposure assessment survey was conducted over nine consecutive weeks based on a previously pre-weighed standard menu provided to the adolescent residents in the six food catering establishments in Alexandria, Egypt. A total of 1080 food samples, 20 samples from different food items from each establishment were randomly collected over 9 consecutive weeks. Aluminum level was determined using ICP-MS. Weekly dietary aluminum intake of an adolescent resident weighed 60 kg was estimated to be 2.2 mg/kg bw/week which exceeded the provisional Tolerable Weekly Intake value (2 mg/kg bw/week) established by the Joint Food and Agriculture Organization/World Health Organization Expert Committee. Cooked vegetables (46.2%) contributed most to the dietary intake, followed by kochari (27.5%). In the meantime, such type of utensils should be avoided, at least for preparing strong acidic food and beverages. Keywords: aluminum; aluminum cookware; dietary intake; risk assessment
INTRODUCTION Aluminum is the third most abundant and widely distributed element in the earth's crust (believed to represent 7.5 to 8.1 %, after oxygen and silicon). For a long time, aluminum was considered safe to human health because of its relatively low bioavailability. After advancement of innovation and introduction of aluminum in the food industry, aluminum and proper health became a great controversial problem[1]. Literature revealed that the major route of exposure comes through the food (>90%) particularly from the consumption of food additives, cooking, and storing food in aluminum cookware [2].There are several factors that influence the aluminum uptake by food cooked in aluminum pans, such as pH value of the cooked food and presence of other substances (e.g. organic acids, salt and other ions), length of cooking period, and the life span of the pan itself. The more the surface area of cookware, the more leaching of the metal to the cooked food. The high acidic cuisine, the more leaching of the metal to the cooked food [3].Aluminum foil also is commonly used to keep the food hot after cooking which leads to increase the aluminum leaching. It was found that adding organic acids to food, including citric acid, pickles and tomato sauce increase the solubilization of aluminum from pans and foil [4]. There is an epidemiological relation between chronic aluminum exposure as an oxidizing metal and the incidence of Alzheimer's disease. The number of people affected by Alzheimer's disease was 26.6 million worldwide in 2006; by
2050 the prevalence is expected to quadruple[5]. Excessive aluminum exposure or susceptible individuals with impaired renal function may develop adverse neurologic, skeletal, hematopoietic, immunologic, and other health effects [6]. In the 2011 Joint FAO/WHO Expert Committee on Food Additives (JECFA) report established the provisional tolerable weekly intake (PTWI) for aluminum to be 2 mg kg-1 body weight/week based on the experimental bioavailability and toxicological data [7]. Through the provided dietary program in the Food Catering Establishments, each resident is exposed to certain amount of aluminum especially from the cooked meals due to usage of traditional aluminum pans since more than 20 years. Therefore, the aim of this study was to assess the aluminum dietary intake from the food provided to the adolescent residents and study the factors influencing the aluminum level.
MATERIALS AND METHODS 1. Study Setting The present study was conducted in six Food Catering Establishments in Alexandria, Egypt which serve about 7000 adolescent residents throughout the year. 2. Study design Cross sectional study was conducted, commencing from August 2015 to September 2016. 3. Food Sampling A total of 1080 food samples, 20 samples from the different
Global Journal of Pharmaceutical Education and Research | January-December 2017 | Vol. 6 | Issue 1-2
1
food categories (chicken, meat, rice, sauced pasta, noodle soap, kochari, cooked vegetables, bean, and unprocessed food like salad and fruits), were randomly collected from each food catering establishment over nine consecutive weeks. These food types were specially selected as they are the main food provided to the adolescent residents based on a standard previously prepared and weighed menu as shown in table 1. The cooking process includes using large pans of aluminum with a uniform standard size (30*40). The meals are provided wrapped in aluminum foil on daily basis to keep the food hot. Table 1: Food Consumption Data
Chicken (n=162) Grilled chicken Chicken shawarma Fried chicken Meat (n=108) Grilled meat Fricassee Rice Sauced Pasta Noodle Soup Cooked Vegetables (n=162) Spinach Peas Zucchini Potatoes Okra Vegetable mixtures Kochari Bean
Food Frequency Intake
(N=1080)
(No./Week)
54 54 54
1 1 1
120 120 120
54 54 162 54 54
1 1 4 2 2
120 120 160 130 130
27 27 27 27 27 27 108 162
1 1 1 1 1 1 1 7
200 200 200 200 200 200 200 35
7
Fresh food (n=108) Fruits Salad
Average weight of Served food (gm/unit)
Sampling units
54 54
7 7
85 ± 15 85 ± 15
The food samples were put in aseptic food sampling bag and sent to the Food Safety Centre as soon as possible. The sample size was calculated prior to research submission with expected standard deviation of 0.5526 based on pilot study using onesample t-test at 80% power and 95% confidence level (PASS, version 12). The pilot study was submitted in order to take a rough idea about the feasibility of data collection and to estimate the sample size needed. Its sample was not included in the study. 4. Aluminum Determination 4.1. Reagents and Chemicals: Aluminum Standard (2 PPM, ISO Guide 34 Certified Reference Material) was obtained from high purity standards (Charleston, SC, USA). Aluminum solutions were prepared by dilution using 0.2% nitric acid. To avoid contamination from other detergents, all glassware and crucibles were treated with a 50% HNO3 solution for 24 hr. and afterword rinsed with double distilled, deionized water (DDW).
2
4.2. Food Sample Preparation & Aluminum Detection: Ashing is the first step for analysis of specific minerals; 2 g of food samples from each food category was submitted to dry ashing (Oxidation) to remove the organic matter by thermal decomposition using the muffle furnace adjusted at 500°c for 4-16 hrs. The white ash residues were dissolved in 50 ml diluted nitric acid [8].The concentration of aluminum dissolved was analyzed using Inductively Coupled PlasmaMass Spectrometry (ICP-MS, NexION 300D, Agilent technologies, Perkin Elmer Inc., USA) according to U.S. EPA Method 200.8 [9].The Detection limit (LOD) of aluminum is 0.01 µg/L. 5.
Deterministic assessment of the Dietary Aluminum Exposure
5.1 The individual intake of Al from each food item was estimated by the following equation: Di (mg/person/day) = Ci (mg/kg) * X i (g/person/day) / 1000 Where Di is the daily intake of Al by individual i from a particular food in (mg/ person /day), C i is the concentration of Al in that food (mg/kg), X i is the consumption of a certain food by individual i (g/person/day) according to a previously prepared and weighed standard menu. 5.2 The weekly Al intake from each food item was calculated using the following equation: W (mg/kg bw /week) = Di (mg/person/day) * food frequency intake per week /the average body weight The food frequency intake per week was determined based on the provided standard menu as shown in table 1. The average body weight of 60 kg for adults is assumed for most populations in the world by WHO Committee [10]. 5.3 The total weekly intake of Al was calculated using the following equation: Total weekly Dietary Intake (mg/person/week) =å (W N , all food categories) 5.4 Dietary aluminum exposure assessment (point estimate approach): The deterministic or point estimate of dietary exposure is simply a single value that describes consumer exposure (i.e. the average dietary exposure to Al). It is based on comparison of the estimated dietary intake of this chemical with its relevant health based guideline value. 6. Statistical Analysis Dietary equations were calculated using Microsoft Office Excel 2016. Data were analyzed using SPSS software package version 22.0 (SPSS, Chicago, IL, USA). Kruskal-Wallis test was used to compare the weekly dietary intake of aluminum among the different food types. Foreword stepwise linear regression model was conducted to determine the factors contributed most to aluminum dietary exposure. Variables included in the model; food type: (cooked food using acidic additives like citric acid or pickles or tomato sauce, cooked food without acidic additives, and fresh food like salad and fruits), and average duration of cooking in minutes were tested
Global Journal of Pharmaceutical Education and Research | January-December 2017 | Vol. 6 | Issue 1-2
for multicollinearity prior to model analysis submission. P value less than 0.05 was considered significant in all applied tests.
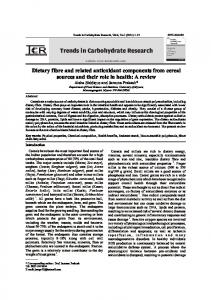
RESULTS The average weekly dietary aluminum exposure level for an adolescent resident in the food catering establishment is estimated to be 2.223 mg/kg bw/week which exceeds the Provisional Tolerable Weekly Intake (2 mg/kg bw/week) established by the Joint Food and Agriculture Organization/World Health Organization Expert (FAO/WHO) Committee. Cooked vegetables (46.20%) and kochari (27.50%) are the main contributors to aluminum exposure. While fruits and fresh vegetables salad are the least contributors; in which the aluminum level ranged from ND to about 0.09 mg/kg.As shown in table 2. Table 2: The contribution of different food types in the estimated weekly dietary aluminum intake provided to a resident in the food catering establishments Weekly Dietary Aluminum Intake (mg/kg bw/week)
Aluminum Level (mg/kg) median
Range
median
Range
Fresh fruits and Vegetables
0.06
(ND-0.09)
0.0007
(0-0.001)
Non-acidic additive cooked food: Red/white meat Grilled chicken
Contribution (%)*** 0.05%
18.2
(16.77-18.65)
0.04
(0.039-0.045)
Chicken shawarma
18.7
(17.00-19.01)
0.043
(0.042-0.064)
Fried chicken Grilled meat Fricassee
18.5 18.3 18.2
(17.66-19.69) (16.80-19.80) (16.77-19.68)
0.039 0.065 0.067
(0.037-0.050) (0.064-0.070) (0.065-0.075)
5.70%
15.8 16 10.22
(15.00-18.25) (15.50-17.72) (9.90-10.31)
0.08 0.05 0.041
(0.063-0.089) (0.045-0.056) (0.040-0.043)
3.58% 2.20% 1.80%
66.2 66.2 66.7 65 64.8 68.8
(64.89-67.20) (65.35-66.90) (64.33-67.70) (64.98-65.33) (64.70-66.35) (67.50-67.65)
0.12 0.126 0.185 0.198 0.158 0.241
(0.117-0.126) (0.113-0.128) (0.170-0.186) (0.189-0.225) (0.155-0.160) (0.210-0.250)
46.20%
27.9
(25.50-29.90)
0.158
(0.155-0.169)
7.20%
185.5
(174.50-202.30)
0.612
(0.582-0.674)
27.50%
2.2237
(2.143-2.199)
100.00%
Carb Sources: Rice Noodle Soup Bean Acidic additive cooked food: Cooked Vegetables Spinach Peas Zucchini Potatoes Okra Vegetable mixtures Carb Sources: Sauced Pasta Kochari Total**
ND: Not Detected * Different food types were compared using Kruskal-W allis test (P = 0.000) ** Total W eekly dietary aluminum intake from different foods ***Contribution: median weekly aluminum exposure amount from each food group divided by the median total weekly dietary intake and multiplied by 100%
Table (3) shows that cooking in aluminum utensils was attributed most to this toxic level, especially with using acidic additives. It was found that acidic additive cooked food could increase the aluminum level by 46.85mg/kg (95% CI [30.62 – 78.98], p=0.008). Non-acidic additive food increases it by 20.38 mg/kg (95% CI [13.42 – 33.83], p=0.03). On the other hand, the duration of cooking could not affect the aluminum leaching level (P>0.05). Table 3: Multiple Regression analysis to predict the aluminum level (mg/kg) in food Regression Coefficients
Model
t
B
SE.
(Constant) a-Type of food
-35.488
22.130
-1.604
Acidic additive cooked food Non -acidic additive cooked food b-Duration of Cooking in minutes
46.847 20.381
14.873 10.382
12.446
18.634
p
95.0% Confidence Interval for B Lower Bound
Upper Bound
.133
-83.296
12.321
3.150 1.176
.008 .030
30.615 13.423
78.979 33.831
.668
.516
-27.810
52.702
**Linear regression analysis: F= 10.270, adjusted R 2 = 0.635, p =0.001* Dependent variable: Aluminum Level (mg/kg) in food Predictors: a- Type of Food: (Reference: Fresh Vegetables and b- Duration of Cooking in minutes Global Journal of Pharmaceutical Education and Research | January-December 2017 | Vol. 6 | Issue 1-2
3
Figure 1: Bar Chart illustrates the median food frequency contribution of aluminum exposure (%) from different food types provided to a resident in the Food Catering Establishments
DISCUSSION This study proved that the weekly dietary intake of aluminum (2.22 mg/kg bw/week) is amounted to be 111.5% of the PTWI (2 mg/kg bw/week). This level is very high compared to the developed countries; where the average estimated weekly dietary aluminum intake of an adolescent is estimated to be 0.93 mg/kg bw/week in USA [11], 0.6 mg/kg bw/week in German [12], 0.432 mg/kg bw/week in Greece [13], 0.408 mg/kg bw/week in Brazil [14], 0.39 mg/kg bw/week in UK [15], 0.292 mg/kg bw/week in Japan [16], 0.289 mg/kg bw/week in Norway [17], and 0.21 mg/kg bw/week in Belgium [18], 0.018 mg/kg bw/week in France [19]. Our results are consistent with Muller et.al 1993 [20] and Bassioni et al. 2012 [21] who found that food rich in tomato sauces contained higher levels of aluminum compared to other food types. The median aluminum concentration in tomato pasta cooked at pH (4) for 60 minutes was 28.2, ranging from 27 to 30.4 mg/kg.Another Slovenian food survey submitted to determine the aluminum level in different food stuff. It was found that sauerkraut and sour turnip contained the highest level of aluminum (313, 260 mg/kg respectively) as they are rich in pickles and appetizers [22]. The very low level of aluminum in fresh fruits and vegetables confirm the fact that the dietary aluminum exposure is almost completely attributed to cooking in aluminum utensils. Helena Liukkonen-Lilja and Sulo Piepponen [23] in 1992 reported that the amount of aluminum leaching to food while
4
cooking also depend on the life span of the used aluminum utensils; old ones yielded a triple higher level of aluminum in the cooked food rather than the new ones. Pettersen et al. [24] compared the level of aluminum in food cooked in a heavily eroded aluminum pan (after 20 years of usage), lightly eroded aluminum pan (after 10 years of usage), a new branded aluminum pan and a new branded steel one. They found that the aluminum concentrations in the rhubarb cooked in the 4 types of pans were 20, 15, 12.32, and less than 1 mg/kg respectively. They concluded that the choice of cooking appliances in the home has a major effect on dietary intake of aluminum. On the other hand, this level was lower than that estimated from Indian surveys [25], in which the mean weekly aluminum dietary intake from the cooked food in aluminum pans was estimated to be 2.68 mg/kg bw/week. Also China reported the highest level of weekly aluminum dietary intake; the values of the weekly dietary aluminum intake ranged from 9 to more than 11.1 mg/kg bw/week due to high consumption of aluminum added vermicelli and jellyfish [26]. The estimated weekly dietary aluminum intakes from these values were safe compared to PTWI for 60 kg weighed adult. In these countries, other types of cookware are used rather than the aluminum utensils. The sale of aluminum cookware is prohibited in Germany, France, Belgium, Great Britain, Switzerland, Hungary and Brazil since 1990s [27]. It is difficult to correlate the differences observed among countries with their different dietary habits .
Global Journal of Pharmaceutical Education and Research | January-December 2017 | Vol. 6 | Issue 1-2
Neurotoxicology [Internet]. 2016;52:222-9. Available from: http://dx.doi.org/10.1016/j.neuro.2015.12.002
Strengths and limitations of the study One of the strengths of this study is that the deterministic assessment of dietary aluminum intake was calculated based on a previously prepared and well-weighed menu; this allowed us to obtain an accurate measure of aluminum dietary intake. Such type of analytical methods used to determine the aluminum level in food is more preferred than estimating the serum aluminum level in the human being. Thus, it is possible to conclude the dietary sources contributing most to aluminum exposure. This study was confined to residents in the food catering establishments, so results could not have been extended to the Egyptian population as whole. We did not consider the differences in the body weight of the residents assuming that the average body weight is 60 kg according to WHO Committee.
6.
Fimreite N, Hansen OO, Pettersen HC. Aluminum concentrations in selected foods prepared in aluminum cookware, and its implications for human health. Bull Environ Contam Toxicol [Internet]. 1997;58(1):1-7. Available from: http://www.ncbi.nlm.nih.gov/ pubmed/8952918
7.
Secretariat of the Codex Alimentarius Commission. Codex Alimentarius Commission Procedural Manual [Internet]. Toxicological evaluation of certain veterinary drug 2011. 220 p. Available from:http://www.eurovital. org/Documents/03VITALLjubljana.ennedeboer.rev.pdf
8.
Andrade Korn MDG, da Boa Morte ES, Batista dos Santos DCM, Castro JT, Barbosa JTP, Teixeira AP, et al.Sample Preparation for the Determination of Metals in Food Samples Using Spectroanalytical Methods-A Review. Appl Spectrosc Rev. 2008;43(2):67-92.
9.
Martín-Cameán A, Jos A, Puerto M, Calleja A, IglesiasLinares A, Solano E, et al. In vivo determination of aluminum, cobalt, chromium, copper, nickel, titanium and vanadium in oral mucosa cells from orthodontic patients with mini-implants by Inductively coupled plasma-mass spectrometry (ICP-MS). J Trace Elem Med Biol [Internet]. 2015;32(2):13-20. Available from: http://dx.doi.org/10.1016/j.toxlet.2015.08.335
CONCLUSION & RECOMMENDATIONS The resident in food catering establishment is exposed to a risky level of aluminum according to the Joint Food and Agriculture Organization/World Health Organization Expert (FAO/WHO) Committee. So, it is recommended to avoid aluminum pans especially whilst cooking a highly acidic food and replace it by other safe options like porcelain, glass or high quality stainless steel. Aluminum foil should be avoided in the cooking process especially if the food is hot or acidic. It is better to be replaced by wax paper or glass food storage containers. Balanced healthy diet which is rich in anti-oxidants is essential to antagonize the effects of trace elements. Further studies are recommended to assess the average dietary aluminum intake for domestic residents; different age groups especially children and geriatrics, and vulnerable groups.
REFERENCES 1.
2.
3.
4.
5.
Veríssimo MIS, Gomes MTSR. Aluminium migration into beverages: Are dented cans safe? Sci Total Environ. 2008;405(1-3):385-8. Joint FAO/WHO Expert Committee on Food Additives (JECFA). WHO Food Additive Series: 58. Safety evaluation of certain food additives and contaminants [Internet]. Vol. 62, International Journal of Food Microbiology. 2007. 269-315 p. Available from: http://linkinghub.elsevier.com/retrieve/pii/S0168160500 004098 European Food Safety Authority. Evaluation of a new study related to the bioavailability of aluminium in food. EFSA J. 2011;9(5):1-16. Weidenhamer JD, Fitzpatrick MP, Biro AM, Kobunski PA, Hudson MR, Corbin RW,et al. Metal exposures from aluminum cookware: An unrecognized public health risk in developing countries. Sci Total Environ [Internet]. 2017;579:805-13. Available from: http://linkinghub. elsevier.com/retrieve/pii/S0048969716324548 Bondy SC. Low levels of aluminum can lead to behavioral and morphological changes associated with Alzheimer's disease and age-related neurodegeneration.
10. Ipcs. Dietary exposure assessment of chemicals in food. Int Program Chem SAFETY Princ Methods Risk Assess Chem Food. 2009;98. 11. Saiyed SM, Yokel R a. Aluminium content of some foods and food products in the USA, with aluminium food additives. Food Addit Contam [Internet]. 2005;22(3):23444. Available from: http://www.ncbi.nlm.nih.gov/ pubmed/16019791 12. Beitrag E, Hecht K. Aluminium, Aluminiumsilikate, Aluminium-Alzheimer-Mythos. 2015;(150). 13. Bratakos SM, Lazou AE, Bratakos MS, Lazos ES. Aluminium in food and daily dietary intake estimate in Greece. Food Addit Contam Part B, Surveill. 2012;5(1):33-44. 14. Avegliano RP, Maihara VA, da Silva FF. A Brazilian Total Diet Study: Evaluation of essential elements. J Food Compos Anal. 2011;24(7):1009-16. 15. Ysart G, Miller P, Croasdale M, Crews H, Robb P, Baxter M, et al. 1997 UK total diet study - Dietary exposures to aluminium, arsenic, cadmium, chromium, copper, lead, mercury, nickel, selenium, tin and zinc. Food Addit Contam [Internet]. 2000;17(9):775-86. Available from: http://www.scopus.com/inward/record.url?eid=2-s2.00033843194&partnerID=tZOtx3y1 16. Sato K, Suzuki I, Kubota H, Furusho N, Inoue T, Yasukouchi Y, et al.. Estimation of daily aluminum intake in Japan based on food consumption inspection results: impact of food additives. Food Sci Nutr. 2014;2(4):38997.
Global Journal of Pharmaceutical Education and Research | January-December 2017 | Vol. 6 | Issue 1-2
5
17. Norwegian Scientific Committee for Food Safety. Risk assessment of the exposure to aluminium through food and the use of cosmetic products in the Norwegian p o p u l a t i o n [ I n t e r n e t ] . 2 0 1 3 . Av a i l a b l e f r o m : http://www.english.vkm.no/
22. Šcancar J, Stibilj V, Milacic R. Determination of aluminium in Slovenian foodstuffs and its leachability from aluminium-cookware. Food Chem. 2004;85(1):1517. 23. Liukkonen-Lilja H, Piepponen S. Leaching of aluminium from aluminium dishes and packages.Food Addit Contam 1992; 9(3):213-23.
18. Fekete V, Vandevijvere S, Bolle F, Van Loco J. Estimation of dietary aluminum exposure of the Belgian adult population: Evaluation of contribution of food and k i t c h e n w a r e . F o o d C h e m To x i c o l [ I n t e r n e t ] . 2013;55:602-8. Available from: http://dx.doi.org/ 10.1016/j.fct.2013.01.059
24. Petterson HC, Fimreite N, Hansen OO. Aluminum concentrations in selected foods prepared in aluminum cookware, and its implications for human health. 1997; 58(1):1-7.
19. Leblanc J-C, Guérin T, Noël L, Calamassi-Tran G, Volatier J-L, Verger P. Dietary exposure estimates of 18 elements from the 1st French Total Diet Study. Food Addit Contam. 2005;22(7):624-41.
25. Neelam, Bamji MS, Kaladhar M. Risk of increased aluminium burden in the Indian population: Contribution from aluminium cookware. Food Chem. 2000;70(1):5761.
20. Müller JP, Steinegger A, Schlatter C. Contribution of aluminium from packaging materials and cooking utensils to the daily aluminium intake. Z Lebensm Unters Forsch. 1993;197(4):332-41.
26. Hu S, Liang C, Wang J, Lu L, Su G, Deng X. Determination of trace aluminium by GFASS in food safety risk monitoring. Chin J Health Lab Technol 2012, 22:453-6.
21. Bassioni G, Mohammed FS, Zubaidy E Al, Kobrsi I. Risk Assessment of Using Aluminum Foil in Food Preparation. Int J Electrochem Sci [Internet]. 2012;7:4498-509. Available from: http://www.electrochemsci.org/ papers/vol7/7054498.pdf
27. Hoover J. Alzheimer's Disease and Aluminum. In: Natural Medicine. Hoover J(ed). 1st Ed. An Electronic Book.1993, pp.77-9.
6
Global Journal of Pharmaceutical Education and Research | January-December 2017 | Vol. 6 | Issue 1-2