WSEAS TRANSACTIONS on SYSTEMS
Chien-Yue Chen, Wing-Kwong Wong, Cheng-Deng Kuo, Yun-Tzai Liao, Ming-Da Ke
Wavelet Real Time Monitoring System: A case study of the musical influence on electroencephalography CHIEN-YUE CHEN1*, WING-KWONG WONG1, CHENG-DENG KUO2,3**, YUN-TZAI LIAO1, MING-DA KE1 1
Institute of Electronic Engineering, National Yunlin University of Science & Technology, No. 123, Sec. 3, University Rd., Douliu, Yunlin, TAIWAN 2 Biophysics Laboratory, Department of Research and Education, Taipei Veterans General Hospital, No. 201, Sec. 2, Shih-Pai Road, Taipei, TAIWAN 3 Institute of Emergency and Critical Care Medicine, National Yang-Ming University No. 155, Sec. 2, Linong St., Beitou District, Taipei, TAIWAN *
[email protected] http://140.125.30.202/new/index.php
[email protected] http://www.ym.edu.tw/ieccm/teachers/Cheng_Deng_Kuo.htm
**
Abstract: - The aim of this study was to develop a real time monitoring system, and to study the effect of music on electroencephalography (EEG). We used this system for real time acquisition and signal analysis of the electroencephalogram of volunteer who was listening to different types of music (techno and classical). The δ, θ, α and β brain waves were observed and analyzed by using wavelet transformation. The analogue EEG signal was measured by biomedical signal machine, converted to digital signal using data acquisition module, and then input to a computer. The graphical user interface was developed using LabVIEW and the signal wavelet transformation algorithms were implemented using MATLAB programs. The advantages of this system are its modularity and capability to observe dynamic variation of any biomedical signals. By using this system, we found that when the music type was changed, the variation in volunteer’s brain wave can be monitored in real time by the wavelet-based real time monitoring system. Key-Words: - Electroencephalogram (EEG); Brain wave; Continuous wavelet transform (CWT) In recent years, there are a lot of studies addressing the problem of musical influences on the physiological/psychological responses of human. Gerra et al. found that listening to techno-music would induce changes in neurotransmitters, peptides and hormonal reactions [7].Bhattacharya et al. applied wavelet and Hilbert transforms to multivariate EEG signals from human subjects at rest as well as in different cognitive states: listening to music, listening to text and performing spatial imagination [8]. Koelsch et al. found that right temporal amplitudes showed significant differences when unexpected chords occurred [9]. Natarajan et al. reported that the brain entered a relaxed state after the music/reflexological stimulus
1 Introduction Real time monitoring system is widely used and applied to many disciplines such as biomedicine. Nazeran et al. developed a computer-based monitor system to analyze the sleep breathing disorder in children by using heart rate variability analysis [1]. Kopustinskas and Zhu et al. applied the real-time monitoring system to observe human’s respiration [2-3]. Clarencon et al. set up an electroencephalogram (EEG) signal spike detection system using wavelet transform with a dedicated digital signal processor card [4]. In fact, wavelet analysis is an important tool for analyzing the nonstationary EEG signal [5-6].
ISSN: 1109-2777
56
Issue 2, Volume 7, February 2008
WSEAS TRANSACTIONS on SYSTEMS
Chien-Yue Chen, Wing-Kwong Wong, Cheng-Deng Kuo, Yun-Tzai Liao, Ming-Da Ke
The base function ψ a,b (t) is obtained by scaling
[10].Hernandez-Reif et al. suggested that neonates of depressed and non-depressed mothers showed different EKG and EEG responses to instrumental music with versus without vocals [11]. Loewy et al. indicated that music therapy might be a costeffective, risk-free alternative to pharmacological sedation [12].These studies provide valuable information on the relationship between music and human physiological/psychological responses.
the prototype wavelet ψ (t ) at scale a and time b. The expression of ψ a,b (t) is:
ψ a ,b (t ) =
a
−1
2
is
introduced
to
guarantee
energy
2
3 Proposed System Figure 1 is the block diagram of the proposed system of this study. The system consists of a biomedical signal machine, a 12bit A/D converter and a personal computer. As can be seen in Figure 1, the EEG signal is recorded from the analog output of the biomedical signal machine (MP150), and then simultaneously transmitted to a data acquisition module (USB-4711, Advantech) with a transmission line. The USB-4711 is an analog/digital converter, through which the digital EEG signal is transmitted to the USB port of a computer. On the computer side, a graphical programming language LabVIEW was used to provide a friendly operation platform. There are three main steps taken in the platform. The first step is to receive the recorded EEG signal; the second step is to call the wavelet analysis program written in MATLAB; and the final step is to plot the analysis result of the EEG signal as graphs.
(1),
−∞
where the asterisk denotes complex conjugation. Time t and the scale-time parameters (a, b) vary continuously.
ISSN: 1109-2777
(3),
where E is the brain wave energy, c is the calculated wavelet coefficient by (1), t is the signal translation unit, and f is the frequency that is obtained from the reciprocal of scale a.
∞
(t )dt
(2),
E = ∑ c Δt Δf
Wavelet transform is analogous to a windowed Fourier transform. A wavelet transform can measure the time-frequency variations of spectral components, but it has a different time-frequency resolution. By using the process of signal decomposition, wavelet transform can find out important features hidden in the original input signals. Wavelet frames are constructed by sampling the time and scale parameters of a continuous wavelet transform (CWT). A real CWT of f ∈ L2 ( R ) is defined by [14]
a ,b
a
t −b ) a
preservation. The energy of EEG signal can be calculated using the following equation:
2 Wavelet transform
∫ f (t )ψ *
ψ(
whereψ (t ) is the wavelet “prototype” which can be thought of as a bandpass function and the factor
In the 1980s, wavelet transform was proposed, and many wavelet functions were created as their orthogonal and compactly supported properties [13]. Wavelet transform has been developed for applications in various fields. About a decade ago, wavelet transform was introduced to biological signal processing research [14]. For the researches of EEG, wavelet transform has been used mainly to detect the EEG of epileptic patients [4, 15] and sleep EEG monitor analysis. Wavelet transform not only retains the advantages of Fourier transform, but is also good for time-frequency characteristics analysis of nonstationary signals such as EEG. In this paper, a wavelet real time monitoring system was used for real time acquisition and analysis of the EEG signals for a volunteer who was listening to two types of music (techno and classical) one after the other. The δ, θ, α and β brain waves were observed and analyzed by using wavelet transform.
CWT( a ,b ) =
1
57
Issue 2, Volume 7, February 2008
WSEAS TRANSACTIONS on SYSTEMS
Chien-Yue Chen, Wing-Kwong Wong, Cheng-Deng Kuo, Yun-Tzai Liao, Ming-Da Ke
Figure 3 shows the result of real time wavelet analysis of a volunteer’s EEG signal. The CWT coefficient of the recorded EEG signal was calculated every ten second. The transversal axes represent the time in second and frequency in Hertz, respectively, while the longitudinal axis represents the normalized energy of each band of brain wave (δ, θ, α, β) which is normalized by the total power of the brain wave.
Fig1. Block diagram of system
The biomedical signal machine (MP150) was used to measure the EEG signal by using the electrodes placed on the scalp of the study subject according to the International 10-20 electrode placement recommended by the International Federation of Societies for EEG and Clinical Neurology. An EEG cap with location-defined electrodes was connected to MP150. In this setup, the subject’s head was mapped by four standard points: the nasion (nose), the inion (external occipital protuberance or projection), and the left and right preauricular points (ears). Electrodes were placed (using a flexible cap measure) by measuring the nasion-inion distance and marking points on the head 10%, 20%, 20%, 20% and 10% of this length. The vertex, Cz electrode, is the midpoint [16]. Figure 2 shows the system’s graphical user interface and four points’ (T3, T4, F7, F8) temporal variation of a volunteer’s EEG. With the interface, the user can set the parameters such as sampling rate, the number of acquisition channel, etc. The interface also provides the functions of file saving, error message report, etc. The system can be easily extended, e.g., the increase of the number of channels. At present, the system can synchronously acquire four points’ (T3, T4, F7, F8) EEG and display them on the monitor. However, only one channel is selected for real time wavelet analysis for optimal performance of the system.
Fig3. The dynamic graphs of time-frequency related wavelet coefficients of four brain waves
The variation of brain wave energy can be calculated and displayed the variations of four bands of brain wave energy (δ, θ, α, β) every minute, as shown in Figure 4. The time axis is represented in minute, while the longitudinal axis is represented in percentage (%).
Fig4. The energy variations of four brain wave bands per each minute Fig2. The user’s system graphical interface
4 Case Study: The musical influence on brain waves
The LabVIEW platform supplied with a MatlabScript node can call the CWT program written in MATLAB. The CWT program, developed for analyzing biomedical signal [17], can use the most appropriate mother wavelet. The EEG signal analyzed by wavelet transform can be represented as time-frequency-CWT coefficient form (Figure 3).
ISSN: 1109-2777
4.1 Protocol In this study, we investigated the influence of music on human’s EEG. Two kinds of music are chosen, one was soft classical music (Frederick Chopin-Nocturne No.2 in E flat), and the other one was intensive and exciting music techno-music. 58
Issue 2, Volume 7, February 2008
WSEAS TRANSACTIONS on SYSTEMS
Chien-Yue Chen, Wing-Kwong Wong, Cheng-Deng Kuo, Yun-Tzai Liao, Ming-Da Ke
The wavelet real time monitor system can show how the volunteer’s brain activity varies with the changes of the supplied music. The system can also record and save the data of the EEG signal. The saved data is called off-line raw data, and the wavelet analyzed data is called off-line wavelet coefficient. The influences of music on brain waves were obtained from the statistical analysis of the offline wavelet coefficient of the volunteers. The analyzed data can be expressed as mean SD. The statistical program (SigmaStat 2.03) was used for all statistical analysis. The averaged energy of the volunteers’ brain wave at each minute after playing the music was compared with the averaged brain wave energy in the 2nd minute using paired ttest. The significance level of P value less than 0.05 was used.
MP3 Cutter Joiner software was used to edit a music sequence that contained these two kinds of music. Two sequences of test music A and B were made for our study. 1-2Min
3-5Min
6-8Min
9-10Min
A type music
No music
Classical music
Technomusic
No music
B type music
No music
Technomusic
Classical music
No music
Table1. The protocol of musical influence on EEG
The protocol used to investigate the musical influence on human’s brain activity is shown in Table 1. Sequence A first played classical music and then techno-music, while sequence B first played techno-music and then classical music. Both sequences had four periods, as shown in Table 1: the 1st period of two minutes was used for the volunteers to rest and wait for the music, the 2nd period of three minutes was used to play the classical music (or techno music), the 3rd period of three minutes was used to play techno music (or classical music), and the last period of two minutes was silence again. Twenty healthy university male students (mean age 24.0±1.3 years old) were recruited in this study. The volunteers were randomly divided into two groups. Group I of 9 volunteers was asked to listen to music sequence A. After at least a week, when the effect of sequence A should disappear, they listened to sequence B. Group II of 11 volunteers were asked to listen to sequence B and then A after the same period as group I. All volunteers had never received any formal music education, nor did they have any condition of audition handicap or similar disease history. No tobacco, caffeine, and alcohol were used by the volunteers during the test day. All volunteers answered the questionnaire so that the information of the volunteers could be collected and examined. The volunteers were asked to keep their eyes closed, put on the earphones and listen to the chosen music for about 10 minutes in supine position. The laboratory was kept silent and dark during the experiment. The volunteers’ EEG was acquired when the volunteer was listening to different music stimuli. The measured points including T3, T4 points in the temporal zone and F7, F8 points in the frontal zone were chosen according to the International 10–20 placement system. The sampling rate of EEG data was 200 Hz.
ISSN: 1109-2777
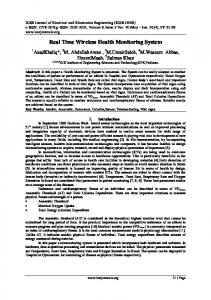
4.2 Experimental results According to the volunteers’ responses to the questionnaire, most volunteers love listening music but they did not show preference to what kinds of music. Therefore, the effect of music preferences on brain wave was not discussed in this study. Figure 5 shows the wavelet analysis of off-line EEG signal acquired from a 26 year-old volunteer who was listening to sequence A music. The total measurement time was ten minutes as can be seen in the time axis, and the critical moments of 2, 5, 8 minutes were marked particularly for observing the variations in brain waves during the changes of music types. The transversal axes represent the time in minute and frequency in Hertz, respectively. The longitudinal axis represents the CWT coefficients of the δ, θ, α, β waves in μV2.
Fig5. The off-line CWT analysis of four kinds of brain waves during the whole measuring period
59
Issue 2, Volume 7, February 2008
WSEAS TRANSACTIONS on SYSTEMS
Chien-Yue Chen, Wing-Kwong Wong, Cheng-Deng Kuo, Yun-Tzai Liao, Ming-Da Ke
such as α, θ, δ waves are not shown, as they show no statistically significant difference when compared to the results during 2nd minute.
5 Discussions 5.1 proposed system and future work A user friendly system of real time wavelet analysis of EEG signal was designed in this study. In this system, the friendly graphic control interface of LABVIEW was used to build a platform, upon which the input digital EEG signal was transformed to CWT-coefficient with a MATLAB program. In other words, the proposed platform makes possible the development of a system prototype for real time signal analysis and monitoring without high development cost. The time-frequency characteristics of EEG signal obtained from this system can be read by a doctor for clinical diagnosis. The advantages of our proposed system are summed as follows:
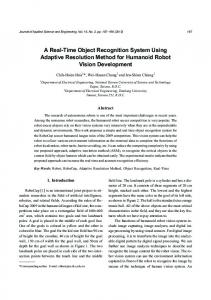
Fig6. Statistical chart in the experiment of A’s alpha activity (T3, T4, F7, F8) by twenty volunteers. The * denotes statistical variation.
Figure 6 demonstrates the averaged normalized energy variations of α waves acquired from T3, T4, F7, and F8 points of 20 volunteers, when the volunteers were listening to sequence A music. Only the averaged α wave energy during the 6th minute was significantly lower than that during the 2nd minute. The results of the other brain waves such as β, θ, δ waves are not shown, as they do not show any statistically significant difference when compared to the results during the 2nd minute.
(1) The system can deliver biomedical signal to the computer using the driver program provided by the data acquisition module USB-4711. (2) It is convenient to develop not only wavelet transformation but also any time-frequency analysis program using the popular software MATLAB for engineers and biomedical signal researchers, so that the development time of signal analysis algorithm can be reduced. (3) It offers a friendly interface for any user who first learns how to use this system. (4) The system is so flexible that the number of input signal channels can easily be expanded and its functions be upgraded. In short, the proposed system can acquire and analyze EEG signals in real time and provide information to users effectively.
5.2 Case Study: The musical influence on brain waves
Fig7. Statistical chart in the experiment of B’s beta activity (T3, T4, F7, F8)by twenty volunteers. The * denotes statistical variation.
For the experiment of musical influence on EEG, sincet Group I and II showed no significant difference between each other, the data obtained from these two groups were combined in later analysis. In general, δ activity (0.5~4Hz) and θ activity (48Hz) appear under the situations of deep sleep and shallow sleep, respectively [16]. Because of the volunteers were asked to keep their eyes closed and not to fall asleep, we did not consider the results about δ and θ activities. For this study, we focused on the variation in α and β activities. As shown in
Similar to Figure 6, Figure 7 shows the twenty volunteers’ average normalized energy variations in β waves acquired from T3, T4, F7, and F8 points when they were listening to sequence B music. On the left brain side, only the average β wave energies during the 5th and 10th minutes were significantly higher than that during the 2nd minute. On the right brain side, the average β wave energy during the 5th minute was significantly higher than that during the 2nd minute. The results of the other brain waves
ISSN: 1109-2777
60
Issue 2, Volume 7, February 2008
WSEAS TRANSACTIONS on SYSTEMS
Chien-Yue Chen, Wing-Kwong Wong, Cheng-Deng Kuo, Yun-Tzai Liao, Ming-Da Ke
could be the prototype of a DSP chip. We used this system for real time acquisition and real time analysis of the EEG signals of a volunteer who was listening to different types of music (techno and classical). In this study, we found that when the music type changed, the volunteer’s brain wave variation can be clearly monitored in real time by this wavelet-based system. Off-line EEG analysis showed that when the music was switched suddenly from classical to techno, the volunteers got excited with the significant descent of α activity. Also, 3 minutes’ hot techno music could excite the volunteers excited with significant increase in β activity. The results can help the critical patients have good quality of sleep by using a kind of proper music.
Fig. 5, at the crucial points of switching from silence to classical music, from classical to techno music, and from techno music to silence, we found that the volunteer’s α and β activities manifested turbulences that possibly resulted from the changes of music [8, 9]. The statistical results in Figure 6 show that the twenty volunteers’ average α activities between the 6th minute period and the 2nd minute period are significantly different while the volunteers were listening to music sequence A. It is already known that a person’s α activity (8-13Hz) arises from the posterior brain and part of the temporal brain when the person is awake, relaxed, and with eyes closed [16]. The significant descent of α activity could result from the relaxed volunteers who listened to first classical music and then to techno music, thus ending their relaxed state. The statistical results in Fig. 7 show that the twenty volunteers’ average β activities between the 5th minute and the 2nd minute, and between the 10th minute and the 2nd minute were significantly different, while the volunteers were listening to sequence B music. In general, a person’s β activity (13-30Hz) increases while the person feels tense and thinks actively [16]. The significant β activity during the 5th minute indicated that the volunteers might be very tense and excited after listening to hot techno music for 3 minutes. The significant β activity during the 10th minute indicated that after 3 minutes’ tender classical music and one minute’s silence, the volunteers might start to wonder when would the experiment finish. In this study, the musical influences on human’s brain wave did not show many direct evidences. To get more evidence, more volunteers might be needed. Nonetheless, the results are amusing and can inspire us to continue the fascinating research.
Acknowledgement This work was supported by a grant (NSC 95-2614B-224-001) from National Science Council, Taiwan. References: [1] Nazeran H, Pamula Y, Gradziel A, Ung K, S Vijendra, Behbehani K, Computer-based Analysis of Heart Rate Variability Signal for Detection of Sleep Disordered Breathing in Children, Proceedings of the 25th IEEE/EMBS International Conference, 2003, pp.17-21. [2] Audris Kopustinskas, Rimas Adaskevicius, Andrius Krusinskas, Dalia M. Kopustinskiene, Julius Liobikas, Adolfas Toleikis, A userfriendly PC-based data acquisition and analysis system for respirometric investigations, Computer Methods and Programs in Biomedicine, Vol.82, Issue 3, 2006, pp.231-237. [3] Zhu, X.; Chen, W.; Nemoto, T.; Kanemitsu, Y.; Kitamura, K.-I.; Yamakoshi, K.-I.; Wei, D, Real-Time Monitoring of Respiration Rhythm and Pulse Rate During Sleep, IEEE Transactions on Biomedical Engineering, Vol.53, Issue 12, 2006, pp.2553-2563. [4] Clarencon D, Renaudin M, Gourmelon P, Kerckhoeve A, Caterini R, Boivin E, Ellis P, Hille B, Fatome M, Real-time spike detection in EEG signals using the wavelet transform and a dedicated digital signal processor card, Journal of Neuroscience Methods, Vol.70, Issue 1, 1996, pp.5-14. [5] Mercedes Cabrerizo, Malek Adjouadi, Melvin Ayala, Ilker Yaylali, Armando Barreto, Naphtali Rishe, “Classification of Interictal EEG Data Based on Subdural Recordings”, WSEAS Transactions on Signal Processing, Issue 2, Vol. 3, 2007 Feb, pp.147~154.
6 Conclusions We use the LabVIEW-platform with MATLAB programs and succeed in developing a real time monitoring and analysis system for EEG signal. The system can integrate the peripheral components quickly, reduce development time of algorithms and offer a friendly user interface. The system provides not only the functions of parameter settings, such as sampling rate, number of acquisition channels for users, but also the functions of file saving, error message report, real time display of EEG signal and real time display of analyzed result. Our proposed platform makes possible the development of a system prototype for real time signal analysis and monitoring without high development cost, and it ISSN: 1109-2777
61
Issue 2, Volume 7, February 2008
WSEAS TRANSACTIONS on SYSTEMS
Chien-Yue Chen, Wing-Kwong Wong, Cheng-Deng Kuo, Yun-Tzai Liao, Ming-Da Ke
depressed mothers, Infant Behavior & Development, Vol.29, 2006, pp.518–525. [12] Loewy J, Hallan C, Friedman E, Martinez C, Sleep/Sedation in Children Undergoing EEG Testing: A Comparison of Chloral Hydrate and Music Therapy, American journal of electroneurodiagnostic technology, 2006, pp.343-55. [13] Ingrid Daubechies, Ten Lectures on Wavelets, Society for Industrial and Applied Mathematics Philadelphia, PA, USA , 1992. [14] Metin Akay, Time Frequency and Wavelets in Biomedical Signal Processing, IEEE Press Series in Biomedical Engineering, 1997. [15] Hojjat, A., Z. Zhou and N. Dadmehr, Analysis of EEG records in an epileptic patient using wavelet transform, Journal of Neuroscience Method, 2003, pp.69-87. [16] Joseph J. Carr, John M. Brown, Introduction to Biomedical Equipment Technology, 4th Edition, Prentice Hall, 2001. [17] Chien-Yue Chen, Cheng-Deng Kuo, YanKwang Chen, “Most Appropriate Mother Daubechies Wavelet for Multiresolution Wavelet Analysis of Heart Rate Variability”, WSEAS Transactions on Information Science and Applications, Issue 4, Vol. 4, 2007 Apr, pp.674~679.
[6] Manabu Shinohara, Fumiaki Motoyoshi, Osamu Uchida, Shohachiro Nakanishi, “Wavelet-Based Robust Digital Watermarking Method Considering Human Visual Perception” , WSEAS Transactions on Signal Processing, Issue 2, Vol. 3, 2007 Feb, pp.185~190. [7] Gerra G., Zaimovic A., Franchini D., Palladino M., Giucastro G., Reali N., Maestri D., Caccavari R., Delsignore R., Brambilla F., Neuroendocrine responses of healthy volunteers to 'techno-music': relationships with personality traits and emotional state, International Journal of Psychophysiology, Vol.28, 1998, pp.99-111. [8] Bhattacharya J, Petsche H, Universality in the brain while listening to music, Proceedings of the Royal Society B: Biological Sciences, 2001, pp.2423-2433. [9] Koelsch S, Mulder J, Electric brain responses to inappropriate harmonies during listening to expressive music, Clinical Neurophysiology, 2002, pp.862-869. [10] Natarajan K, Acharya U R, Alias F, Tiboleng T, Puthusserypady SK, Nonlinear analysis of EEG signals at different mental states, Biomedical Engineering Online, Vol.3, 2004. [11] Hernandez-Reif M, Diego M, Field T, Instrumental and vocal music effects on EEG and EKG in neonates of depressed and non-
ISSN: 1109-2777
62
Issue 2, Volume 7, February 2008