Journal of Image and Graphics, Vol. 4, No. 1, June 2016
Weight Estimation of Wheat by Using Image Processing Techniques K. Sabanci1, S. Ekinci2, A. M. Karahan3, and C. Aydin4 1
Department of Electric and Electronics Engineering, Karamanoglu Mehmetbey University, Karaman, 70100, Turkey 2 Department of Mechanical Engineering, Selçuk University, Konya, 42003, Turkey 3 Vocational School, Batman University, Batman, 72100, Turkey 4 Department of Agricultural Machinery, Selçuk University, Konya, 42003, Turkey Email:
[email protected], {sekinci, caydin}@selcuk.edu.tr,
[email protected]
fruit area (2D) to background area ratio can be used to determine misshapen fruit. Zayas et al. [9] used image processing to discriminate wheat and non-wheat and between weed seeds and stones in the non-wheat part of a grain sample. They reported that physical separation of stones prior to the image analysis program may be necessary for satisfactory discrimination. Also Zayas et al. [10] took advantage of the image processing techniques for classification and determination of shape properties 17 different wheat varieties. They developed methodology for wheat classes and variety identification by combination of image analysis techniques with wheat hardness physical measurements. Shouche et al. [11] quantified for shape variation in 15 Indian wheat varieties by digital image analysis using custom-built software. They placed fifty wheat grains on the scanner increase-down position avoiding grain to grain contact, thereby circumventing extensive programming needed to separate touching objects and also avoiding the associated loss of information in the images. They stored images in *.tif format for further analysis. Then they determined lengths, width, thickness, environment and shape coefficients of wheat grains via an image processing program. Bacci et al. [12] transferred images of wheat grain to a computer and analyzed via image processing technique. In this way, they determined the percentage of injured seeds through this technique. Symons et al. [13] used the image processing technique to discriminate nonvitreous wheat and vitreous wheat. Sabancı et al. [14] distinguished wild rye seeds mixed into wheat using artificial neural networks and image processing techniques. In addition, they classed wheat and rye seed in the image information received from a webcam. In this study, weight estimation of bread wheat and durum wheat in different amounts was performed by using image processing techniques. By comparing obtained results with real weight was calculated the success percent of system. This study exemplifies image processing in agriculture.
Abstract—Today, image processing applications in agriculture seems to spread rapidly. Image processing in agriculture are used in many areas such as classification of products, the detection of weeds, crop yields and weight estimation. In this study weight estimation of bread wheat and durum wheat in different amounts was performed by using image processing techniques. Image processing techniques were applied by using Matlab software. The counting of wheat kernels in image and weight estimation was carried out. Success rates were determined by comparing estimated weights of wheat kernels and their actual weight. Index Terms—image processing, wheat, weight estimation, durum, bread
I.
INTRODUCTION
Wheat is the most widely grown improved cultigen and it has an important role in nutrition, agricultural industry and commerce in the world. The wheat plant which has a very important position for rapidly increasing world population nourishment can be easily produced all over the world as it is depended on machined agriculture and high adaptation ability. In addition to being the raw material of wheat bread, wheat is used in the production of pastries and biscuits [1]. Physical properties of agricultural products such as length, thickness, width, surface area, bulk density, projection area is highly important in terms of engineering. Image processing techniques are in used for measurement of physical properties of agricultural products in recent years. In general terms, image processing means that manipulation and analysis of pictorial information [2]. Image processing techniques are used in various fields such as industrial, security, geology, medicine, agriculture. Image processing and artificial neural networks in agriculture are used for purposes classification in fruit color analysis, monitoring of root growth, measurement of leaf area and determining weeds etc. [3]-[7]. Sadrnia et al. [8] classified and analyzed the fruit shapes in long type watermelon using image processing. The results of their study indicated that length to width ratio and
II. MATERIALS AND METHODS In this study, image of bread wheat and durum wheat kernels was taken by using a Logitech C905 webcam.
Manuscript received March 24, 2015; revised October 29, 2015. ©2016 Journal of Image and Graphics doi: 10.18178/joig.4.1.51-54
51
Journal of Image and Graphics, Vol. 4, No. 1, June 2016
(±0.0001g accuracy). To have a higher success rate, weight of wheat kernels were estimated by image processing technique according to previous measurements sets considering its numbers and weights and selecting the weight of the closest number set. Number of wheat and estimated weight values are shown in Matlab result screen (Fig. 5).
Technical specification of the Logitech C905 webcam is shown in Table I. Images of bread wheat and durum wheat were taken from the same height by fastening the webcam. TABLE I. TECHNICAL SPECIFICATIONS OF WEBCAM Technical Specification of the Logitech C905 Webcam Interface:
Hi-Speed USB 2.0 certified
Maximum Definition:
High-Definition video (up to 1600 X 1200 Up to 8-megapixel photos (enhanced from native 2-MP sensor)
CCD Definition:
Native 2-MP HD sensor
Lens Type:
Carl Zeiss® optics with autofocus
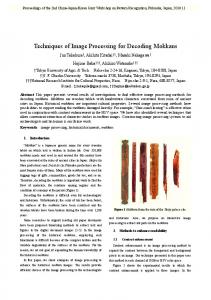
Matlab software was used for algorithm of image processing. 100 pieces bread wheat kernels, 100 pieces durum wheat kernels were used for this process. A part of bread wheat and durum wheat kernels pictures are shown in Fig. 1. Black background was used at the stage of image processing for faster and correct results. Images of bread wheat and durum wheat kernels in certain rates were taken via webcam for weight estimation. Fig. 2 shows an image of the bread wheat kernels. Image information of bread wheat kernels was converted to gray level image. Filtration was performed to pictures for reduce noise and interference. Bread wheat kernels images which were converted into gray levels are shown in Fig. 3. Image information which was at gray level was converted to binary image by using Otsu’s Method. Otsu algorithm provides the clustering of these pixels according to the distribution of pixel values in the image. Thresholding process is one of the important processes in image processing. Especially, this method is used for highlighting closed and discrete areas of the object in the image. It includes the arrangement of image which was divided into pixels until to the image in dual structure. Simply, threshold process is a process of discarding pixel values on the image according to specific values, and replacing other value/values [15]. Thus, determination of object lines and backgrounds of the object on the image were provided. Threshold value was determined by using Otsu’s method. If it was under this value, pixels were converted to “0”; if it was over this value, pixels were converted to “1”. After gray level image information was converted to binary image information, small white pixels were filtered in the binary image. Filtered binary image information is shown in Fig. 4. Bread wheat kernels which were located adjacently in the binary image information were separated by morphological operations. Counting of bread wheat kernels in the binary image information was performed successfully. Process steps thus far described were also repeated for durum wheat samples. Weight of durum wheat and bread wheat kernels for the numbers of 5, 10, 20, 50, 75 and 100 were measured with analytical balance ©2016 Journal of Image and Graphics
Figure 1. Image of bread wheat and durum wheat kernels
Figure 2. Original image of bread wheat kernels
Figure 3. Gray level images of bread wheat kernels
52
Journal of Image and Graphics, Vol. 4, No. 1, June 2016
the wheat were calculated according to the previously measured data. Thereafter, those wheat kernels were measured with analytical balance and performance of system was evaluated. Weights of determined by using Image process algorithms and measured with analytical balance are shown in Table II. Flow diagram of the process of the system is shown in Fig. 6.
Figure 4. Binary image information of bread wheat kernels
Figure 5. After morphological operations image information of bread wheat kernels Figure 6. Flow diagram of the process of the system TABLE II. DETERMINED AND MEASURED WEIGHT AND SUCCESS RATE
Wheat species
Durum wheat
Bread wheat
Number wheat (piece)
Weight of determined by using image process algorithms (g)
Weight of measured with analytical balance (g)
Success rate (%)
24 55 73
1.0950 2.4552 3.2505
1.0987 2.5042 3.3237
99.66 98.04 97.79
94
4.1804
4.2799
97.67
28 57 78
0.9692 2.0667 2.8108
0.9758 2.1254 2.8985
99.32 97.23 96.97
99
3.5566
3.6801
96.64
Success rate graph for durum wheat is shown in Fig. 7 and success rate graph for bread wheat is shown in Fig. 8. According to the graph, success rate reduces when the number of grains in both bread wheat and durum wheat increases. While the number of grains in durum wheat 24, success rate is 99.66%. Success rate decreases to 97.67% when the grain number rises to 94. For bread wheat while grain number is 28, success rate is 99.32%. When the grain number rises to 99, success rate decreases to 96.64%.
III. RESULTS AND DISCUSSION Images of the durum wheat and bread wheat kernels at different proportion which were taken with webcam processed by using image processing algorithms and counting wheat were performed. Approximate weights of ©2016 Journal of Image and Graphics
Figure 7. Success rate graph for durum wheat
53
Journal of Image and Graphics, Vol. 4, No. 1, June 2016
[9]
[10]
[11]
[12]
[13]
Figure 8. Success rate graph for bread wheat
[14]
IV. CONCLUSION In this study, weight estimation of bread wheat and durum wheat in different amounts was performed by using image processing techniques. By comparing obtained results with real weight was calculated the success percent of system. According to the values obtained from the measurements of durum and bread wheat to certain ratio 4, system success rate of durum wheat was average 98.29%, system success rate of bread wheat was determined as 97.54%. Real-time weight estimation of durum and bread wheat by developing the system with moving band and camera system. Also, packaging process of wheat in a certain number can be performed. This study is an example of using image processing in agricultural field.
[15]
Kadir Sabanci is with the Department of Electric and Electronics Engineering, Engineering Faulty, Karamanoglu Mehmetbey University, Karaman, Turkey. He was born in Konya, Turkey, 1978. He received his PhD in Agricultural Machineries from Konya, Turkey in 2013, with major field of study focused on traction. His research interests are image processing and ANN. He is a member of IACSIT. Şerafettin Ekinci is with the Department of Mechanical Engineering, Technology Faulty, Selçuk University, Konya, Turkey. He was born in Sivas, Turkey, 1971. He received his PhD in Agricultural Machineries from Konya, Turkey in September 2011, with major field of study focused on traction mechanics. His research interests are traction performance, tire and tribology. He is a member of IACSIT.
ACKNOWLEDGMENT The authors acknowledge the support of this study by the Scientific Research Projects Coordination Office of Karamanoglu Mehmetbey University. REFERENCES [1]
[2] [3] [4]
[5]
[6]
[7]
[8]
N. Tursun, Z. Kantarcı, and M. Seyithanoğlu, “Determination of weed seeds contaminating wheat grain in Kahramanmaraş province,” Journal of Science and Engineering, vol. 9, no. 2, pp. 110-115, 2006. R. K. Castelman, Digital Image Processing, Englewood Cliffs, New Jersey, USA: Prentice hall, 1996. P. D. Keefe, “A dedicated wheat grain image analyzer,” Plant Varieties and Seeds, vol. 5, no. 1, pp. 27-33, 1992. T. P. Trooien and D. F. Heermann, “Measurement and simulation of potato leaf are a using image processing,” Transactions of the ASAE, vol. 35, no. 5, pp. 1709-1712, 1992. A. J. Pérez, F. Lopez, J. V. Benllochand, and S. Christensen, “Colour and shape analysis techniques for weed detection in cereal fields,” Computers and Electronics in Agriculture, vol. 25, pp. 197-212, 2000. G. V. Dalen, “Determination of the size distribution and percentage of broken kernels of rice using flatbed scanning and image analysis,” Food Research International, vol. 37, pp. 51-58, 2004. D. Jayas and C. Karunakaran, “Machine vision system in postharvest technology,” Stewart Postharvest Review, vol. 2, no. 2, pp. 1-9, 2005. H. Sadrnia, A. Rajabipourl, A. Jafary, A. Javadi, and Y. Mostofi, “Classification and analysis of fruit shapes in long type watermelon using image processing,” International Journal of Agriculture & Biology, vol. 9, no. 1, pp. 68-70, 2007.
©2016 Journal of Image and Graphics
I. Zayas, Y. Pomeranz, and F. S. Lai, “Discrimination of wheat and nonwheat components in grain samples by image analysis,” Cereal Chemistry, vol. 66, no. 3, pp. 233-237, 1989. I. Zayas, C. R. Martin, J. L. Steele, and A. Katsevich, “Wheat classification using image analysis and crush force parameters,” Transaction of the ASAE, vol. 39, no. 6, pp. 2199-2204, 1996. S. P. Shouche, R. Rastogi, S. G. Bhagwat, and J. K. Sainis, “Shape analysis of grains of Indian wheat varieties,” Computers and Electronics in Agriculture, vol. 33, pp. 55-76, 2001. L. Bacci, B. R. Colucci, and P. Novaro, “Durum wheat quality evaluation software,” in Proc. World Congress of Computers in Agriculture and Natural Resources, Brazil, 2002, pp. 49-55. S. J. Symons, L. V. Schepdael, and J. E. Dexter, “Measurement of hard vitreous kernels in durum wheat by machine vision,” Cereal Chemistry, vol. 80, no. 5, pp. 511-517, 2003. K. Sabancı, C. Aydın, and F. Ünlerşen, “Buğday tohumuna karışan yabani çavdar tohumlarının yapay sinir ağlarıyla tespit edilmesi,” in Proc. Türkiye IV. Tohumculuk Kongresi, Samsun, Türkiye, 2011. K. Yaman, A. Sarucan, M. Atak, and N. Aktürk, “Preparation of data for dynamic scheduling using image processing and Arima models,” J. Fac. Eng. Arch. Gazi Univ., vol. 16, no. 1, pp. 19-40, 2001.
Cevat Aydın is with the Department of Agricultural Machinery, Selçuk University, Konya, Turkey. He was born in Aydın, Turkey, 1965. He received his PhD from Selçuk University of Turkey. He is currently a professor at Department of Agricultural Machinery, Selçuk University. He is interested in biological materials and precision agriculture.
Ali Mucahit Karahan is with Vocational School, Batman University, Batman, Turkey. He was born in Konya, Turkey, 1982. He received his PhD in Food Engineering from Konya, Turkey. His research interests are grain processing and food technology.
54