Whodunit: Transactional Profiling for Multi-Tier Applications Anupam Chanda
Alan L. Cox
Willy Zwaenepoel
Department of Computer Science, Rice University 6100 Main Street, Houston, Texas 77005, USA
Department of Computer Science, Rice University 6100 Main Street, Houston, Texas 77005, USA
School of Computer and Communication Sciences, EPFL 1015 Lausanne, Switzerland
[email protected]
[email protected]
ABSTRACT This paper is concerned with performance debugging of multitier applications, such as commonly found in servers and dynamic-content web sites. Existing tools and techniques for profiling such applications are not general enough to track and profile transactions in a generic multi-tier application. We propose transactional profiling that provides a general solution to this problem. We provide novel algorithms and techniques to track and profile transactions that flow through shared memory, events, stages or via interprocess communication using messages. We also measure interference among concurrent transactions. We describe the design and implementation of Whodunit, our prototype transactional profiler. We demonstrate the correctness of our proposed algorithm for tracking transaction flow through shared memory using Apache and MySQL. Using Whodunit we are able to track and profile transactions that flow through shared memory, events, stages or via message passing, and measure the interference among concurrent transactions. We illustrate the use of Whodunit in obtaining the transactional profile of web servers, a web proxy cache and a bookstore application.
Categories and Subject Descriptors D.2.8 [Software Engineering]: Metrics—performance measures
General Terms Performance, Design, Algorithms
Keywords Profiling, Distribution
1.
INTRODUCTION
This paper is concerned with the profiling of multi-tier applications, such as commonly found in web sites providing dynamic content and Web services. In such applications,
Permission to make digital or hard copies of all or part of this work for personal or classroom use is granted without fee provided that copies are not made or distributed for profit or commercial advantage and that copies bear this notice and the full citation on the first page. To copy otherwise, to republish, to post on servers or to redistribute to lists, requires prior specific permission and/or a fee. EuroSys’07, March 21–23, 2007, Lisboa, Portugal. Copyright 2007 ACM 978-1-59593-636-3/07/0003 ...$5.00.
[email protected]
a client request is processed by a series of different stages. Stages may be distributed over multiple machines, reside on the same machine, or sometimes belong to the same process (e.g., a series of threads executing a single request). We call the execution of a client request through the multiple stages a transaction (not to be confused with ACID transactions). This paper aims to provide an end-to-end profile of transactions in a multi-tier application. Profiling has proven to be very useful in the performance debugging of stand-alone programs. Call graph profiling [13] and call path profiling [14, 15] are two widely used approaches to profiling stand-alone programs. The goal of transactional profiling, which is introduced in this paper, is to extend the functionality of call path profiling to multi-tier applications. For example, if in a 3-stage application composed of a web server, an application server and a database server we find that the database sort routine is consuming a lot of CPU, our transactional profiler allows us to infer which type of request at the web server or the application server invoked those expensive executions of the sort routine. Measuring lock waiting times in stand-alone multithreaded programs has proven useful too [16]. Transactional profiling extends this functionality to distributed applications. For example, if in a 3-stage application we find that a thread at the database server is spending a lot of time waiting for locks we can track the type of request at the web server or the application server that leads to lock contention at the database server. Further, we can also track the other request types that are the source of the contention. End-to-end profiling of transactions in a multi-tier application is complicated by a number of factors. First, execution of a transaction is often distributed across process and machine boundaries. Second, an executing stage may be a process, a thread, an event, or a stage worker thread (as in the Staged Event Driven Architecture (SEDA) [25]). A transaction needs to be tracked across all such stages. Third, threads may pass a particular transaction between themselves via shared memory. Shared memory communications are generally harder to track than inter-process communication (IPC) via the operating system or middleware. Finally, due to concurrent execution, a transaction may cause another transaction to wait, e.g., due to lock contention. An end-to-end profile model for multi-tier applications should encompass all of the above. We address the above challenges, and make the following contributions. First, we provide a novel algorithm to automatically detect and track transaction flow through shared memory. Second, we provide a novel mechanism to track
transaction execution through events and stages. Third, we measure and present interference between concurrent transactions caused by lock contention. Finally, we provide a mechanism to track transactions that span process and machine boundaries. At each stage of the application we measure resource consumption by transaction type. Our mechanism is general in the sense that it does not assume the use of any custom application platform or knowledge about application behavior. End-to-end profiling of transactions in a multi-tier application has received considerable attention from industry and the research community. A few profiling tools are commercially available that can profile distributed J2EE [22] applications, e.g., PerformaSure by Quest [20], Optibench from Performant [18], and Borland ServerTrace [9]. Economic viability and implementation feasibility has limited the availability of such tools to the J2EE platform. Consequently, such tools may not be directly applicable to applications composed of many widely used programs like Apache and MySQL [1]. Further, these tools cannot follow transactions through events, SEDA stages or shared memory. The research community has also been very active in the area of performance debugging of distributed applications. Project 5 has investigated performance debugging of a distributed system of black boxes over a local area network [4] and over a wide area network [21]. While Project 5 analyzes performance at the “box” level, transactional profiling provides finer grained knowledge of transactions and their profile data within each box. Magpie [6] measures perrequest resource usage in a distributed application. Magpie requires knowledge of application-specific event schema, that can only be provided by an expert, and relies on operating system support that generates detailed traces of program execution events. Transactional profiling can track and profile transactions in a distributed environment without such application knowledge or operating system support. Finally, transactional profiling is the first to track and profile transactions that flow through shared memory, events or stages, and measure their interference. The rest of the paper is organized as follows. Section 2 introduces some terms that we use in this paper. Sections 3, 4 and 5 describe profiling of transactions that flow through shared memory, events and stages, and IPC via messages, respectively. Section 6 describes how transactional profiling models interference among concurrent transactions. Section 7 describes our implementation of Whodunit, a prototype transactional profiler. We describe a few case studies of using Whodunit in Section 8. We measure Whodunit’s overhead in Section 9. We cover related work in Section 10 and conclude in Section 11.
2.
STAGES, TRANSACTION CONTEXT, AND TRANSACTION PROFILING
2.1 Definitions Stages in a multi-tier application execute (parts of) transactions. In this paper, a stage may be a process, a thread, an event-handler or a stage worker thread (SEDA). In a multi-tier application a stage can be an entire program or a program can be composed of multiple stages. Stages communicate among themselves via channels which can be sockets, pipes, shared memory, events or SEDA stage queues. A
multi-tier application receives an external stimulus, a request, performs an execution to process this request and returns a response. A transaction begins with a request and ends with the corresponding response. The transaction context is the execution path of a request through the different stages. At any point in a transaction’s execution, its transaction context captures the complete execution history through the different stages of the application. In a stand-alone program, the execution path is defined as the call path [14, 15] — the sequence of procedure calls leading to a point of execution. When a transaction is executed by multiple stages in a multi-tier application, each of the stages has its own execution path for the transaction. The transaction context is the complete execution path for all the stages concatenated in the order of their execution. We illustrate a transaction context below with examples of stages communicating through sockets or pipes, shared memory, events and SEDA stage queues.
2.2 Examples Typically web services consist of three stages — a web server, an application server and a database server. During the execution of a transaction these stages send and receive messages over sockets. Execution of a transaction starts at the web server. Its transaction context in the web server is simply the call path in the web server. After the web server sends a message to the application server, the application server continues the execution of the transaction. The transaction context at the application server is the call path of the web server at the point where it sends the message, concatenated with the call path in the application server. Similarly, the transaction context at the database server includes the call paths through the web server, the application server and the database, in that order. When the database sends back a message to the application server, we identify that the response for a previous message from the application server has arrived and that execution has resumed at the application server. Likewise, we identify the response message from the application server to the web server. A good example of communication among stages through shared memory occurs in the Apache 2.x web server. A listener thread in a server application receives a request and stores it in a shared data structure. A worker thread retrieves this request from the shared data structure and continues execution of the transaction. The transaction context of the request in the listener thread is the thread’s call path. The transaction context of the request in the worker thread is its call path prefixed by the call path of the listener thread, at the time when it stored the request in the task queue. In an event-driven application execution of a request begins with an initial event handler, e.g., an event handler in a web server that accepts incoming connections. The transaction context of a request while being executed by the initial event handler is simply the call path. An event handler may set up a continuation to continue execution on a future event. When such an event handler executes, its transaction context is the call path of that event handler, prefixed by the transaction context of the event-handler that had set up the continuation for this current event. For example, in a web server a request gets executed by an event-handler that accepts incoming connections (accept-handler), one that reads the request (read-handler), and one that sends back the response (write-handler). When the accept-handler executes,
the request’s transaction context is simply the call path. When the read-handler executes, the transaction context is the concatenation of the accept-handler’s call path followed by the call path of read-handler. Similarly, the transaction context when the write-handler executes consists of the call paths of the accept-handler and the read-handler, in that order, followed by the current call path in the write-handler. Execution in a SEDA-based application proceeds through multiple stage worker threads that communicate via stage queues. A stage worker thread performs some execution and then produces an event in the stage queue connecting it to the next thread. Execution of the request then continues with the next stage. The execution begins with the initial stage of the program, during which the transaction context of a request is the same as the call path. At any stage of the system, the transaction context is the call path of the stage prefixed by the transaction context of the previous stage at the point where it produced the event in the stage queue between these two stages that served as input to the current stage. Thus, transaction context at any stage includes the call paths through all previous stages.
2.3 Transactional Profiling Having defined a transaction context, we now state how transactional profiling is performed. In call path profiling [14, 15] profile data of a program gets annotated with the call path. Similarly, in transactional profiling, we annotate profile data with transaction context. That is, when the profile data is collected, we find the transaction context at that point of execution and annotate the profile data with that transaction context. For example, in a three-stage web service application, profile data on the web server gets annotated by the call path in the web server, profile data on the application server gets annotated by the transaction context, which contains the call paths through the web server and the application server, and profile data on the database server gets annotated by the call paths through the web server, the application server and the database server. These annotations enable us to measure resource consumption of each request type on all stages of the system. For example, we may identify the web server request types that cause high CPU utilization at the database in a three-stage application.
2.4 Challenges in Transactional Profiling The challenge in transactional profiling is to follow the transactions through the different stages. As should be clear from the above discussion, stages exhibit a producerconsumer relationship when passing transactions between themselves. In some cases the producer-consumer relationship is explicit. For instance, in the case of message passing, the send corresponds to the produce, and the receive to the consume. In event-driven programs creating a continuation corresponds to the produce, and executing a new event handler to the consume. SEDA stages are similar, with putting an event in the stage queue being the produce, and removing it being the consume. In these cases where the producerconsumer relationship is explicit, tracking the transaction is relatively easy. It suffices to remember the transaction context at the (explicit) produce point, and to pick it up at the (explicit) consume point. Furthermore, if the produce and the consume are encoded as library functions, for instance, message passing libraries, event-handling libraries, or SEDA stage classes, then the code for tracking transactions can be
hidden inside those libraries. If not, for instance with a hand-coded event-driven server, then the application needs to be modified, but the modifications are modest. Even in shared memory, if there are explicit functions by which tasks are produced and consumed, the same approach can be followed. The situation becomes more challenging when transactions are passed implicitly through shared memory, in other words when there is a sequence of instructions that operate on shared memory but without a high-level indication that the instructions implement transactions being passed from one stage to another. In practice, this coding style is often used, for instance in the Apache 2.x web server, and therefore needs to be handled. In this case the producerconsumer relationship needs to be inferred from the shared memory accesses. In the next sections we discuss transaction tracking and transaction profiling through these various channels, starting with shared memory, followed by events and SEDA stages, and concluding with message passing.
3. TRANSACTIONAL PROFILING THROUGH SHARED MEMORY Threads in a multithreaded program access shared data for a variety of purposes. One purpose may be to pass transactions as described above. Another may be access to shared application data in a critical section. Yet another form of access may occur in the implementation of a shared memory allocator. Our goal here is to develop an algorithm that detects shared memory access for the purpose of passing transactions between threads, and avoids including other forms of shared memory access. First, we state our assumptions under which we are able to detect transaction flow through shared memory. Then, we describe our algorithm, explain its operation, and show how it finds transaction flow and avoids false positives. Finally, we describe a mechanism to obtain transactional profiling under transaction flow through shared memory.
3.1 Assumptions Accesses to shared data structures always occur in critical sections protected by locks. For every instance of transaction flow there is one thread that produces the data (producer) and another thread that consumes that data (consumer). Finally, the producer thread updates the shared data structure with data that it computes prior to entering the critical section — it does not generate the data inside the critical section. Conversely, the consumer thread obtains data from the shared data structure and uses it after exiting from the critical section. Threads in a multi-tier application have predefined roles. They are either producers or consumers of a resource, but not both producers and consumers of the same resource, e.g., listener and worker threads in a server. In a SEDA [25] program a thread consumes events from its input queue and produces events to its output queue to be processed by the subsequent stage’s thread. Thus, a thread is a consumer of its input queue resource and a producer of its output queue resource, but not a producer and consumer of the same resource. Finally, we assume that each different resource is protected by a separate lock. For example one lock protects a free memory pool resource shared among threads, one lock
protects a work queue resource between listener and worker threads, and so on.
3.2 Algorithm During execution application data resides in memory or in registers. The virtual address space of a process is the name space of all memory locations a program accesses. We can uniquely name a register reg of thread ti by annotating it as regti . The union of the virtual address space and the name space of annotated registers is the complete name space of all locations where application data reside. We associate a location addr in this name space (where addr is either a memory location or a thread-register) with a transaction context which we maintain in a dictionary (addr, ctxt) indexed by addr. At any point in time a location addr’s dictionary entry either has either no transaction context, a valid transaction context, or invlctxt which is a special value signifying an invalid context. Initially the dictionary is empty, i.e., no addr has an associated transaction context. Our algorithm analyzes the instructions in critical sections and performs the following actions for each MOV memory operation. A MOV memory operation moves data from a register or a memory location addr1 to another register or a memory location addr2 . Assume thread ti executes a MOV operation in a critical section. We lookup the dictionary structure to find the transaction context associated with addr1 . If dictionary entry (addr1 , ctxt) exists, we update the dictionary with an entry (addr2 , ctxt), i.e., addr2 gets associated with the transaction context ctxt. If addr1 has no associated context, we compute the transaction context ctxtti of thread ti and associate it with addr2 , i.e., update addr2 ’s dictionary entry as (addr2 , ctxtti ). For any instruction in a critical section that is not a MOV instruction but modifies the value contained in location addr, we associate invlctxt with addr. Examples of such instructions include assigning an immediate value to a location, an arithmetic operation, incrementing (or decrementing) the value at a location, and so on. A producer updates the shared data structure with some value that it computes before entering the critical section. The source location addr1 of such value is some memory location or the thread’s live registers on entry to the critical section. Since a location gets associated with a transaction context only inside a critical section, the source location addr1 has no associated transaction context when the critical section is entered. When the value in addr1 is moved to another location addr2 , we associate addr2 with the executing thread’s transaction context. When this occurs, we infer that the executing thread has produced a value in addr2 . A consumer moves a value from a shared location addr1 to a local location addr2 and then uses the value from addr2 after exiting the critical section. The location addr1 is associated with the producer’s transaction context when the producer moves the value it produces to addr1 (as explained above). That context gets associated with addr2 , when the value in addr1 is moved to addr2 . The consumer uses the value from location addr2 after exiting the critical section. When this event occurs, we infer that the consumer has consumed the value from addr2 (because addr2 has an associated transaction context). Producers and consumers may also move elements previously produced in the shared data structure to new locations. For example, in a priority queue implementation
ap_queue_push(fd_queue_t *queue, apr_socket_t *sd, apr_pool_t *p) { /* producer thread */ pthread_mutex_lock(&queue->one_big_mutex); elem = &queue->data[queue->nelts]; elem->sd = sd; elem->p = p; queue->nelts++; pthread_mutex_unlock(&queue->one_big_mutex); } ap_queue_pop(fd_queue_t *queue apr_socket_t **sd, apr_pool_t **p) { /* consumer thread */ pthread_mutex_lock(&queue->one_big_mutex); elem = &queue->data[--queue->nelts]; *sd = elem->sd; *p = elem->p; pthread_mutex_unlock(&queue->one_big_mutex); /* caller uses values in sd & p after return */ }
Figure 1: Code snippet from Apache 2 web server showing producer-consumer pattern of shared memory access. both producers and consumers move elements in the queue to maintain the priority queue properties. Our algorithm automatically detects that. Assume an element elem1 is stored at an address addr1 in the shared queue. Also assume that ctxt1 is the transaction context associated with addr1 . When a memory operation (or sequence of memory operations) in a critical section moves elem1 from location addr1 to addr2 , addr2 is associated with addr1 ’s transaction context, i.e., ctxt1 . Subsequently, when elem1 is consumed from the location addr2 , we find that the transaction context associated with addr2 is ctxt1 . A location addr may be used for different purposes at different times. In particular, a location addr may be used for transaction flow at one point in time but not another. Consequently, when we update the transaction context for addr we remember the lock corresponding to the executing critical section. We flush the transaction context associated with addr if we find that it is being accessed from a critical section protected by a different lock than the lock protecting the critical section that last updated addr’s transaction context. Finally, we keep a list of producers and a list of consumers for every lock object. When we detect that a thread is producing a resource we add it to the list of producers for the lock object protecting that resource. Similarly when we identify that a thread is consuming a resource we add it to the list of consumers for the associated lock object. The first time we find that these two lists have a common member, we infer that transaction flow is not occurring for shared memory accesses protected by this lock object.
3.3 Detecting Transaction Flow 3.3.1 An Example from Apache 2.x First, we describe the execution of our algorithm on the shared memory access pattern of the code snippet from Apache 2.0, shown in Figure 1. The producer (ap queue push) stores sd & p at some location addr in the shared queue. When the MOV operations that move these values from their prior location on the stack to addr execute, our algorithm detects that no transaction context is associated with these stack locations (since no data was moved to these stack locations inside a critical section). So it associates the producer thread’s transaction context ctxtprod with the loca-
tion addr. The consumer (ap queue pop) thread later reads the values sd & p from location addr in the shared queue and moves them to local variables on its stack. When that happens these local stack variables’ locations get associated with the transaction context ctxtprod. When the consumer uses these values from the local variables after exiting the critical section, our algorithm detects that these locations have associated transaction contexts, and from the value of these transaction contexts (ctxtprod) infers that a transaction flows from ap queue push to ap queue pop.
3.3.2 Further Discussion FreeBSD’s sys/queue.h provides implementations of singlylinked and doubly-linked lists and queues [26]. We have verified the correctness of our algorithm on test programs involving producers and consumers using the different data structures implemented by sys/queue.h. Sometimes producer and consumer threads use consistencychecking code for sanity-checking of the shared data structure. For example, after retrieving the item to be consumed, the consumer may set the source location in the queue to a constant value, say NULL, signifying that the item has been consumed. Similarly, the producer might check if the value of a queue location is NULL before inserting a produced item at that location. We observe that in such a case the value NULL is being transferred from the consumer to the producer, but we should not infer transaction flow from the consumer to the producer. The memory operation that stores the value NULL in the shared queue structure does not move a value from one location to another location. It moves the immediate value (NULL) to a location. As mentioned earlier, when that happens the location gets associated with invlctxt, the invalid context. Thus, the value NULL does not cause any transaction flow from the consumer to the producer. Further, the producer does not use the value NULL it retrieved from the shared queue after exiting from the critical section. Even if it did so, we find that an invalid context is associated with the location containing that value, and thus no transaction flow will be detected. The same reasoning applies when a producer enqueues an item elem in an empty queue, a consumer dequeues that item, and then another consumer tries to retrieve an item from the queue but finds that the head of the queue is NULL. This can happen in a linked-list implementation of a queue. The producer would have initialized elem->next to NULL. The first consumer would have moved the value NULL from elem->next to the head of the queue. Thus, the location containing elem->next has an invalid context, which is transferred to the location containing the head pointer of the queue (by the first consumer). The second consumer retrieves the value NULL from the head of the queue which is associated with the invalid context and thus no transaction flow is (correctly) inferred. Programs often use nested locks. Our algorithm analyzes all instructions that are in the critical section protected by the outermost lock. Thus, all internal critical sections are also analyzed.
static int count = 0; pthread_mutex_t mtx; main() { pthread_create(thd1, func1, ...); pthread_create(thd2, func2, ...); } func1() { /* thread 1 */ for (;;) { /* execute transaction */ pthread_mutex_lock(&mtx); count++; pthread_mutex_unlock(&mtx); } } func2() { /* thread 2 */ for (;;) { /* execute transaction */ pthread_mutex_lock(&mtx); count++; pthread_mutex_unlock(&mtx); } }
Figure 2: Program with shared state that does not affect individual transactions.
access patterns that do not constitute transaction flow. In Figure 2 two threads share a variable that is used to count occurrences of some event. From the program structure it is clear that this shared variable does not convey transaction flow from one thread to another. However, the same memory location is accessed by the critical sections of different threads to update the shared state count. This aspect is similar to the producer-consumer pattern where threads access the same location in the shared queue to propagate data. This memory access pattern is representative of a class of shared memory access patterns that inspect or update shared state that is independent of request data. Another example of this type of shared memory access pattern is inspection or modification of database tables by different threads of a database server. Both threads increment the contents of the location addrcount that contains the value of the shared variable count. For any instruction, other than a MOV instruction, that modifies the contents of a location, the algorithm associates the location with the invlctxt transaction context. Since the location addrcount is the only shared location between the two threads and it is associated with an invalid transaction context, we correctly infer that no flow of transaction occurs between these two threads. The memory allocator pattern also bears resemblances to the producer-consumer pattern. Many applications implement their own memory allocator as a performance optimization to fulfill the dynamic memory requirements of the application threads. Threads executing transactions dynamically allocate and free memory via calls to the memory allocator. It is typically implemented as a shared data structure protected by a lock or mutex — Figure 3 shows pseudo code of a simple memory allocator. We observe that the memory allocator pattern (Figure 3) of shared memory access is isomorphic to the producerconsumer pattern of memory access — the mem free routine is analogous to the producer and the mem allocate routine is 3.4 Avoiding False Positives analogous to the consumer. Since our algorithm keeps a list Some shared memory accesses have similarities to the producer- of producer threads and consumer threads for each resource, it detects when these two lists have a common member. The consumer pattern but do not constitute transaction flow. The following two examples are common shared memory first time that happens in the above code, our algorithm in-
static void *mem_free_list; pthread_mutex_t mtx; do_work() { /* thread i */ for (;;) { void *mem = mem_alloc(); /* execute transaction */ mem_free(mem); } } void *mem_alloc() { /* allocate memory */ pthread_mutex_lock(&mtx); /* mem = get & remove head from mem_free_list */ pthread_mutex_unlock(&mtx); return (mem); } void mem_free(void *mem) { /* free memory */ pthread_mutex_lock(&mtx); /* append mem to mem_free_list */ pthread_mutex_unlock(&mtx); }
Figure 3: Memory allocator in a multithreaded program. fers that memory accesses for this resource do not constitute transaction flows.
3.5 Transactional Profiling We propagate transaction contexts between threads where transaction flow occurs in shared memory by the following mechanism. Suppose we identify that thread tp produced an item that is consumed by thread tc . Let tcp be the transaction context of thread tp when it produced that item at location addr. This transaction context is associated with addr. When tc consumes the item from location addr we assign tcp to thread tc . From this point onwards the concatenation of tcp followed by the call path of tc defines tc ’s transaction context. Subsequent profile samples of thread tc get annotated by its transaction context.
4.
TRANSACTIONAL PROFILING THROUGH EVENTS AND STAGES
4.1 Transaction Flow Through Events A transaction in an event-driven application is executed by a sequence of event handlers. Execution proceeds from one event handler to the next via events. At any point in a transaction’s execution, the complete sequence of event handlers executed on its behalf constitutes its transaction context. To illustrate, suppose at a particular point in the execution of an HTTP transaction, a web server has executed the event handlers accept handler, read handler and write handler, in that order. accept handler accepts incoming client connections, read handler reads the request data, and finally write handler writes the response back to the client. Then, the transaction context at that point in the execution contains the ordered list [accept handler, read handler, write handler]. For different transactions, different sequences of event handlers are executed, establishing separate transaction contexts. For example, consider an event-driven DNS server. Two different transactions are possible in this application: one corresponding to a cache hit and the other corresponding to a cache miss. Typically, cache hit and cache miss events are handled by different event handlers. So, two different transaction contexts will be established for this application.
We provide a mechanism to track transaction flow through an event-driven application. A transaction flows from one event handler to the next via an event (also known as a continuation). An event handler produces a continuation, that is consumed by the event handler that acts on this continuation. We associate a transaction context with an event. This transaction context may be conceptually thought of as a string representing the sequence of event handlers executing a transaction. Assume, at any point in the execution an event ei with transaction context α is being executed by its event handler evhi . If a new event ej is created to continue execution of the transaction, then the current transaction context is the concatenation of ei ’s transaction context and its event handler evhi , i.e., the ordered list [α, evhi ]. This transaction context suffixed by the program’s call path constitutes the transaction when ej is executed. When the initial event handler is scheduled, its transaction context is simply the call path of the program. An event handler may be scheduled and executed (consecutively) more than once for a transaction, if the operation performed by the event handler does not complete in a single iteration. For example, an event handler that performs a read or write operation may need more than one iteration to complete. The transaction context contains in this case successive occurrences of that event handler. For example, the sequence may look like [evhA , evhB , evhB , evhB , ..., evhC ], where evhA , evhB , evhC are distinct event handlers. We collapse multiple consecutive occurrences of the same event handler in the representation of a transaction context. Since we think of event handlers as stages, it makes sense to group the consecutive executions of an event-handler together. As event-handlers are executed for a transaction and the sequence of event-handlers grows, sometimes a loop (of length greater than 1) in the sequence is created. For example, when multiple requests are served on a persistent connection, the list may grow as [evhaccept , evhread , evhwrite , evhread , evhwrite , ...] and so on, where evhaccept , evhread and evhwrite are event handlers that perform the accept, read and write operations of a transaction, respectively. However, a loop (of length greater than 1) in the sequence of event-handlers is similar to a request being issued by a stage and the response coming back to it (e.g., RPC between stages). In this case, we prune the suffix of the sequence of event-handlers that closes the loop, e.g., [evhaccept , evhread , evhwrite , evhread ] is pruned to [evhaccept , evhread ]. This pruning mechanism is similar to removing multiple occurrences of procedure nodes from a call graph or call path due to recursion (or mutual recursion). This is not strictly necessary for profiling, and the complete transaction context may be useful for some applications, e.g., for debugging. However, for profiling, the pruning mechanism helps to generate a concise presentation of the profile data.
4.1.1 Tracking Transaction Flows To track transaction flow we augment the event or continuation structure with a transaction context field, that is filled in when the continuation is produced. Next, the program needs to remember the current transaction context, so that it may initialize the transaction context of a new continuation, should the currently executing event handler produce one. These modifications can be hidden in an event library, such as libevent [19]. An event-driven program
1. event_loop() 2. { 3. for (;;) { 4. event *ev = get_next_ready_ev(); 5. curr_tran_ctxt = concat(ev->ev_tran_ctxt, 6. ev->ev_handler); 7. ev->ev_handler(); 8. } 9. } 10. event_add(new_ev) 11. { 12. new_ev->ev_tran_ctxt = curr_tran_ctxt; 13. addto_monitor_list(new_ev); 14. }
1. stage_loop() 2. { 3. for (;;) { 4. queue_elem *elem = dequeue_next(input_queue); 5. curr_tran_ctxt = concat(elem->tran_ctxt, 6. CURRENT_STAGE); 7. /* execute elem */ 8. } 9. } 10. enqueue_elem(new_elem,output_queue) 11. { 12. new_elem->tran_ctxt = curr_tran_ctxt; 13. enqueue(output_queue, new_elem); 14. }
Figure 4: Modifications to libevent to support transactional profiling.
Figure 5: Modifications to a SEDA-based program to support transactional profiling. main_caller
that uses such an event library requires no modification at all for transactional profiling. Figure 4 shows the modifications to libevent to perform transaction context profiling. The event structure has been augmented with a field ev tran ctxt that captures the transaction context when the event is produced by an event handler. Lines 5 and 6 are added to the event loop. The library maintains a global list — curr tran ctxt (the current transaction context). Before an event handler is invoked, the event loop computes the current transaction context by concatenating the selected event’s ev tran ctxt and its ev handler. Loops, if any, are eliminated at this point (line 5). When a new event is created and registered, its ev tran ctxt is initialized with the global curr tran ctxt (line 12). If an event-driven program does not use a standard event library, then the above modifications must be applied to its event loop and the continuation creation mechanism. Performance analysis data for each transaction context is maintained separately as follows. Assuming sampling-based profiling, at any profile sample, the transaction context of the event-driven program is obtained from the global list curr tran ctxt. The profile sample is then annotated with the value of this list. Profile samples belonging to different transaction contexts, thus, have different annotations and are managed and presented separately.
send
main_callee
foo
bar
rpc_call
rpc_call
receive
send
svc_run dispatch send
receive
callee_rpc_svc
receive
Figure 6: Call path trees of the caller (left) and the callee.
queue element’s transaction context is initialized with the executing thread’s transaction context. Figure 5 shows the modifications to a SEDA-based program to enable transactional profiling (lines 5, 6, and 12). Conceptually, transactional profiling in an event-driven program and a SEDA-based program are very similar. This similarity is exhibited in the pseudo-codes of Figure 4 and Figure 5. As with event-driven programs, the modifications to a SEDA-based program are limited to the library implementing the SEDA architecture, and as such, the application using a SEDA library does not need any modifications at all. The transactional profile is collected in a manner similar to the way it is done for event-driven programs: the profile data is annotated by the executing thread’s transaction context.
4.2 Transaction Flow Through Stages in SEDA
5. TRANSACTIONAL PROFILING ACROSS DISTRIBUTION
The Staged Event Driven Architecture (SEDA) [25] has been proposed as an infrastructure to build scalable Internet services. Consecutive stages in SEDA have a producerconsumer relationship; they communicate via a stage queue connecting them. Transactions can be tracked in SEDA by using the shared memory transaction flow algorithm of Section 3. However, it is easier to track transactions by instrumenting the SEDA middleware. We describe that mechanism here. We associate a transaction context with each queue element that is passed between successive stages. At any stage, when a thread dequeues and starts executing a request element from its input queue, it computes its current transaction context by concatenating the queue element’s transaction context and the currently executing stage. Loops in the transaction context, as with event-driven programs, may form at this step, and are eliminated in the same manner as in event-driven programs. When a thread creates a new queue element and puts it in its output queue, the new
In a distributed environment, stages exchange request and response messages among themselves to execute transactions. We give a mechanism to identify request and response messages, and to establish transaction contexts across such distribution. We explain the mechanism of establishing transaction contexts in a hypothetical two-stage application using RPCstyle (request/response) communication. Let us assume that stage 2 (callee) provides an RPC service routine, and stage 1 (caller) has two transaction paths, one through procedure foo and the other through procedure bar, that make calls to this RPC service. Figure 6 shows the call path trees [5] of the caller and the callee. For transaction propagation via messages, we define the transaction context at a message send point as being the call path [14, 15] of the program. The transaction context at the caller (in the above case) at the RPC call through foo is cf oo , and for the RPC call through bar it is cbar . Then, two different transaction contexts reach stage 2 (for two different
main_caller
bar
main_callee
rpc_call
svc_run
dispatch
request send
receive
send
receive callee_rpc_svc
response main_callee
foo rpc_call send
request receive
svc_run
send
dispatch
receive callee_rpc_svc
response
Figure 7: Transaction flow connecting the caller and the callee. transactions). When stage 2 executes the transaction from foo, its transaction context is cf oo suffixed by its call path. Similarly, when it executes the transaction from bar, its transaction context is cbar suffixed by its call path. When profile sampling occurs at stage 2, its profile data are labeled by its transaction context. This allows profile data at stage 2 to be maintained separately for each different transaction. When stage 2 sends back a response to stage 1, the call path within stage 2 is the same — let us denote it by cresponse — irrespective of the RPC through foo or through bar. This is because the program on stage 2 executes the same sequence of procedure calls to send the reply back to stage 1. By definition, the transaction context is then cf oo #cresponse or cbar #cresponse (# is a special delimiting character). This transaction context is then sent to the caller along with the response data. The caller identifies that a prefix of the callee’s transaction context actually originated from itself. From that the caller infers that the message must be a reply to its RPC request, and that it does not inherit the callee’s transaction context. Transactional profiling is performed as follows. The caller maintains its own profile and information about the transaction contexts it sends to the callee. The callee annotates its profile information with its current transaction context. Post mortem, the caller’s and the callee’s profile data are stitched together using the annotations of the profile. Figure 7 is a graphical representation of the resulting transactional profile for the two different transactions in the above application. Nodes represent procedures and they have associated profile data (not shown in the figure). The call path tree of the callee appears twice, each corresponding to two different transaction contexts (received from the caller). Nodes performing send and receive for request and response messages are connected with edges labeled request and response during the post mortem phase.
6.
TRANSACTION CROSSTALK
Concurrent transactions can interfere with each other, slowing their execution. Such interference stems from lock contention. We term such interference as transaction crosstalk. Sometimes, transaction crosstalk may have a pronounced effect on the performance of transactions, e.g., increasing transaction latency significantly. Previous work in the area
of distributed profiling has not addressed this issue of crosstalk. Transactional profiling measures and presents transaction crosstalk to pinpoint performance problems due to interfering transactions. We model transaction crosstalk as follows. Concurrent transactions usually acquire and release locks to access shared state. Locks may be accessed in shared or exclusive mode. When one transaction acquires a lock in an exclusive mode, all other transactions requesting the same lock need to wait. We measure the waiting time for lock acquire operations for all transactions. We also make a note of the transaction causing the wait. We present these two pieces of information as transaction crosstalk. To illustrate, assume a two-stage application with a web server front stage followed by a database server. Assume, the application implements two different transaction types tA and tB . Consider, two concurrent transaction instances tAi and tBj executing in the database stage. If tAi and tBj both need to acquire a lock lockx in exclusive mode, one of them (say, tBj ) has to wait while the other (tAi ) is holding the lock. In this case, transaction crosstalk includes the length of tBj ’s wait at the lock acquire operation, and the transaction instance that causes the wait, tAi . When presenting the profile data on transaction crosstalk, we find the average waiting time for all tB transaction instances that need to wait for tA transaction instances, and present that as transaction crosstalk for the ordered pair (tB , tA ) of transactions, i.e., where tB waits for tA . Similarly, crosstalk for the ordered pair (tA , tB ) is measured and presented. Transaction crosstalk must not be confused with measuring lock waiting times in a multithreaded application. For example, the Tmon tool [16] measures and presents lock waiting times in single-stage multithreaded applications. Transaction crosstalk measures waiting times caused by interfering transactions in a distributed environment. This distinction is important. Consider, the two-stage application as described above. If we measure the lock waiting times for the threads in the database server, we have no transaction-level information. That is, we cannot infer what transaction is waiting, and what transaction is causing the wait. By establishing transaction contexts in a multi-tier application, transaction crosstalk presents a more meaningful presentation of the lock waiting times at the different stages of the application.
7. IMPLEMENTATION We have implemented Whodunit, a prototype transactional profiler, that incorporates all the aspects described in the preceding sections to present an end-to-end profile of a multi-tier application.
7.1 Transactional Profile Whodunit’s run-time system is implemented as a library that is pre-loaded to initiate the profiling of a program. An initialization routine creates the profiler’s state and initiates profiling. The program is then loaded, and Whodunit profiles its execution. When the program exits, Whodunit finalizes its state and writes the profile data to disk. In a final presentation phase, Whodunit stitches together the profiles from the application stages using transaction context information. At run-time Whodunit annotates profile data with the transaction contexts of executing transactions. Whenever
a profile sample occurs, Whodunit records the profile data and annotates it with the transaction context of the currently executing transaction. Whodunit computes transaction context by tracking transactions through shared memory, events, SEDA stages and IPC. At the core of Whodunit is a call path profiler. The call path profiler core is responsible for collecting the profile data that Whodunit annotates. We used csprof [12], a recent implementation of a call path profiler, as the core of Whodunit. csprof is a statistical profiler. It periodically samples the program and collects profile data. csprof maintains its call path profile in an efficient data structure, the Calling Context Tree (CCT) [5]. Whodunit annotates the root of a CCT with transaction context information. Thus, each CCT is labeled to be used for a different transaction context. When a stage receives a request from another stage, Whodunit computes the transaction context of the sending stage’s call path. At the receiving stage Whodunit then finds the CCT with that transaction context as its annotation, and instructs the call path profiler core to accumulate profile samples in that CCT. If Whodunit does not find a CCT with this transaction context, it creates a new, initally empty CCT, and labels it with this transaction context. Thus, Whodunit maintains the correct mapping between the currently executing transaction and the CCT wherein profile samples are collected.
cutes them natively. For example, Whodunit stops emulating critical sections related to resources with memory access patterns similar to a memory allocator. To identify when (and what) a thread consumes, Whodunit must continue emulating a thread’s execution for a few instructions past the exit from a critical section. If all produce and consume operations are implemented as procedures, then a consumer uses the value in the return register(s) immediately after the call to the consume operation completes. We emulate for a maximum of MAX instructions after exiting the critical section. We assume that the consumer uses the value it wants to consume within this window of MAX instructions. In our current implementation we use 128 as the value for MAX. When Whodunit identifies that an item is being produced by a thread, it associates the location where the item is being produced with the transaction context of the executing thread in a dictionary structure. When Whodunit infers that an item is being consumed by a thread, it assigns the transaction context associated with the location the item is being consumed from to the executing thread.
7.3 Transactional Profiling Through Events and Stages
In Section 4 we described the mechanism to track transaction flow through events (in an event-driven program) and stages (in a SEDA-based program). We implement 7.2 Transactional Profiling Through Shared Mem- this mechanism in the libevent [19] library and the SEDA ory library [25]. We augment libevent’s struct event with a field to store the transaction context. event loop and In Section 3 we presented an algorithm to detect transacevent add are modified to track the current transaction contion flow through shared memory. Now we describe the imtext and to propagate transaction context between events. plementation of that algorithm and the mechanism to propSEDA defines its own linked list class to implement the inagate transaction context between threads during a transput and output queues of a stage. We modify this class action flow through shared memory. to associate transaction context with individual queue eleThe transaction flow detection algorithm analyzes the inments and to propagate transaction context between stages. structions in the critical sections of programs that are proSEDA’s stage event loop is modified to keep track of the tected by locks or mutexes. Use of system-visible primitives current transaction context. like pthread mutex lock and pthread mutex unlock make the critical sections visible to Whodunit. This is achieved 7.4 Transactional Profiling Across Distribution by providing wrappers for the lock acquire and release operations in Whodunit. Once the critical sections are identified, Section 5 explains transactional profiling across IPC via we “trap” the instructions that are performed from the critisockets and pipes. Now we describe the implementation of cal sections. We achieve this trapping by emulating the code that mechanism. As before, we describe the implementation within the critical section. with respect to an RPC (request and response) between two We use the QEMU processor emulator [7] for emulation of stages that send and receive messages between themselves. the critical section code. QEMU is actually more powerful On a message send operation, Whodunit computes the than what we need — it is a full system emulator capathe transaction context of the sender as the call path in the ble of emulating the processor, memory and I/O devices. program leading to the send operation. Then, it creates We extract from QEMU the CPU emulator core that emua synopsis of this transaction context and propagates it to lates machine instructions. For this extraction we turn off the receiver. A synopsis is a compact and unique repreQEMU’s emulation of the processor’s memory management sentation of a transaction context. Whodunit uses 4 bytes unit (MMU), as we emulate the critical section code from for each transaction context synopsis, and maintains transwithin the address space of the emulated process and thus action contexts and their synopses in a dictionary. Propawe do not need to perform MMU address translation in softgating a synopsis instead of a transaction context reduces ware — the hardware does that for us. To avoid any stack Whodunit’s communication overhead. corruption, the emulator always runs on a stack different If α is the transaction context at the send node of a caller from the stack of the emulated program. for an RPC, then synopsis(α) is its transaction context synAfter extracting the necessary pieces from QEMU to supopsis which becomes the transaction context at the callee. port emulation of critical section code, Whodunit executes If β is the call path at the send node of the callee for rethe algorithm described in Section 3 to identify transaction sponse to the same RPC, then αβ is its transaction context. flows through shared memory. As a performance optimizasynopsis(α)#synopsis(β) is its transaction context synoption, Whodunit stops emulating critical sections correspondsis, which is formed by concatenating synopsis(α), #, and ing to resources that do not cause transaction flow, and exesynopsis(β), where # represents a unique symbol acting as a
delimiter between the prefix and the suffix of the transaction context. This representation allows the caller’s transaction context to be identified as a prefix in the callee’s transaction context (in the response message). Whodunit computes and propagates transaction context synopses without requiring any modification to the distributed application by providing wrappers for the send and receive operations. On each stage Whodunit manages a dictionary of CCTs labeled by transaction context synopses. At the callee, the received transaction context becomes its transaction context, and Whodunit switches to the CCT labeled with the same transaction context. If such a CCT does not exist, Whodunit creates one, labels it with the transaction context and switches to it. The callee’s profile samples are collected in this CCT until the callee switches to another CCT (i.e., when it executes with a new transaction context). The caller also notes the association between its CCT and the transaction context synopsis when it sends a request to the callee. This is required because on receiving the response back from the callee, it needs to switch back to the CCT from which the request originated (since it may have changed CCTs in the meanwhile and now it needs to execute on behalf of the earlier transaction that had issued the RPC request). To summarize, the wrappers for send and receive operations do the following. send wrapper: 1. Compute the transaction context synopsis of the node in the CCT performing the send. 2. Associate the CCT with the above computed transaction context synopsis. 3. Perform the send operation and piggy-back transaction context synopsis on application data. receive wrapper: 1. Perform the receive operation and obtain the piggybacked transaction context synopsis from the sender. 2. At the callee, switch to the CCT corresponding to the sender’s transaction context synopsis. At the caller, identify the prefix of the received transaction context synopsis that originated from itself, and switch to the CCT from which that prefix originated.
7.5 Transaction Crosstalk Whodunit provides wrappers for lock acquire and release operations to record transaction crosstalk. The magnitude of wait time at lock acquire operations is measured in the wrapper for the acquire operation. Whodunit maintains a dictionary of lock objects to record transaction contexts that currently have acquired them in exclusive mode. The dictionary is updated when a transaction context acquires and when it subsequently releases a lock. When a transaction waits to acquire a lock, Whodunit looks up the dictionary to find the transaction context holding the lock (and hence causing the wait).
8.
CASE STUDIES
We demonstrate the use of Whodunit in obtaining the transactional profile of a few applications. The machines used in our experiments have a 2.4 GHz Pentium Xeon CPU, 2 Gigabytes of memory, and are connected by switched Gigabit ethernet.
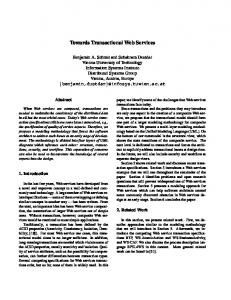
listener thread
apr_socket_accept
ap_queue_push
2.4% worker threads
ap_queue_pop
ap_process_connection
sendfile 22.7%
Figure 8: Transactional profile of Apache under the Rice web workload.
8.1 Apache and MySQL An important aspect of transactional profiling is detection of transaction flow through shared memory and propagation of transaction contexts across such transaction flow. We have described our algorithm for transaction flow detection and the mechanism for passing transaction context in Section 3. An important test of this algorithm is to demonstrate its use in real applications with concurrent threads and shared state. We choose two popular multi-threaded servers — Apache (version 2.0.54) and MySQL (version 4.0.25). We profile executions of these servers while executing traces of web and database workloads. Our algorithm detects no transaction flow in MySQL. Whodunit detects a shared counter in MySQL, but correctly deduces that it does not constitute transaction flow. For Apache, our algorithm detects transaction flows through shared memory and establishes transaction contexts across them. Figure 8 shows a portion of the transactional profile of Apache under a web workload trace obtained from our department’s web server at Rice University. Nodes represent procedure names, solid edges represent procedure calls, dashed edges represent transaction contexts established by Whodunit, and triangles show the percentage of Apache’s profile collected by a procedure and its children. Figure 8 shows flow of transaction contexts from a listener thread to multiple worker threads. The listener thread accepts incoming connections and puts them in a shared queue using the ap queue push routine, while the worker thread dequeues them via the ap queue pop routine. The shared queue is protected by a mutex. Whodunit successfully detects this transaction flow. Whodunit also detects a synchronized memory allocator in Apache, but it does not satisfy the rules of transaction flow.
8.2 Squid Web Proxy Cache Squid [2] is an event-driven, open-source proxy caching server. Squid does not use an event-library like libevent [19]. So, we modify the Squid program to support transactional profiling. The modifications are limited to Squid’s event loop (comm poll) and the procedure to register interest for events (commSetSelect). These modifications required about 120 lines of code, while Squid contains more than 125,000 lines of code. Using Whodunit on our modified version of Squid we are able to obtain its transactional profile. We use Squid version 2.5.STABLE12 for our experiments. We play a web work-
main
comm_poll 6.1%
httpAccept 1.1% clientReadRequest 28.2% commHandleWrite 38.5%
httpReadReply
commConnectHandle
14.5% commHandleWrite 11.5%
httpReadReply 0.1%
Figure 9: Transactional profile of Squid under the Rice web workload. ListenStage 1.6% HttpServer 1.75%
ReadStage HttpRecv
Figure 10 shows the transactional profile of Haboob under the above workload. Nodes represent stages (labeled with stage names) and edges represent transaction flow between stages. The ListenStage listens on the server socket, the HttpServer stage accepts client connections, the ReadStage reads packets from the client, the HttpRecv stages parses the client Request, the CacheStage implements an internal cache, the MissStage handles cache misses and schedules disk reads via the File I/O Stage, and the WriteStage sends the response back to the client. Figure 10 shows that two different transaction types occur in Haboob: a transaction may flow from the CacheStage to the WriteStage either via the cache hit path or via the cache miss path. For each transaction context, the total percentage of CPU profile spent in a stage is shown in a triangle by the node representing a stage. For example, the figure shows that 37.65% of Haboob’s total CPU use occurs in the WriteStage reached via the cache hit path and 46.58% in the same stage reached via the cache miss path. Whodunit measures the time used in WriteStage for the two different transaction paths. This information is not provided by a regular profiler.
1.89%
1.29%
8.4 TPC-W
CacheStage 1.89%
Cache Miss Cache Hit
WriteStage
MissStage
37.65%
3.56% File I/O Stage 3.8%
WriteStage 46.58%
Figure 10: Transactional profile of Haboob under the Rice web workload. load trace using a client emulator program against Squid while profiling it. This is the same workload that is used for the Apache experiments. Squid, the origin server and the client program all run on separate machines. Squid’s main event handlers are httpAccept, which accepts incoming connection requests, clientReadRequest, which reads the client request, commConnectHandle, which opens a connection with the origin server, httpReadReply, which receives content from the origin server, and commHandleWrite, which sends a reply to the client. The transactional profile of Squid for the above experiment is shown in Figure 9. In this figure, a dashed edge represents a transaction context established by a sequence of event handlers. The event handler commHandleWrite appears in two transaction contexts: once after the sequence httpAccept-clientReadRequest, and once after httpAccept-clientReadRequest-httpReadReply. Of these two sequences of event handlers, the former corresponds to when the request is found in the proxy cache (cache hit), while the latter corresponds to a cache miss when the origin server needs to be contacted. Whodunit enables us to distinguish the time spent in the commHandleWrite event-handler for cache misses and cache hits, a distinction which is not provided by a regular profiler.
8.3 Haboob Haboob is a SEDA-based web server [25]. Using Whodunit, we are able to profile the different transactions of Haboob. We subject Haboob to the same web workload that we used for Apache and Squid. We run Haboob and the client program on different machines.
TPC-W [23] models an online bookstore. It defines a set of fourteen different transactions, e.g., searching and buying of books. Our TPC-W implementation [3] is composed of Java servlets for the TPC-W transactions, and the MySQL database server (version 4.0.25) to store its persistent data. We use the Apache Tomcat servlet container (version 4.1.31) as the web server/application server executing the servlets. The fourteen different TPC-W transactions are implemented as fourteen different Java servlets. TPC-W serves dynamic as well as static content, e.g., thumbnail and full images of books. In our setup Squid [2] executes in front of Tomcat to cache TPC-W’s static content. All TPC-W requests flow through Squid to Tomcat and MySQL. In our setup Squid, Tomcat and MySQL run on separate machines. We subject the TPC-W implementation to a browsing mix workload [23] from multiple, concurrent clients and profile it using Whodunit. For each TPC-W transaction page, that is dynamically generated by a servlet, Squid sends a request to Tomcat via the same call path, and hence, transfers the same transaction context to Tomcat. Since each TPC-W interaction is implemented as a separate Java servlet, Whodunit extends a separate transaction context from Tomcat to MySQL for each interaction. Thus, for each TPC-W interaction, a separate transaction context is established in MySQL. For each transaction, Whodunit maintains its resource usage separately at both Tomcat and MySQL. Such separation of resource utilization at MySQL would not have been possible by using a conventional profiler, e.g., gprof [13]. This separation is made possible by Whodunit’s use of call path profiling at Tomcat (each TPC-W transaction is executed by a separate servlet and hence has a distinct call path), and by tracking transaction flow across RPCs between stages (Tomcat makes database RPC calls into MySQL). Whodunit shows that the average resource usage at Tomcat by the different TPC-W transactions is roughly the same. Table 1 shows the summary of MySQL’s profile information as measured by Whodunit while executing the workload from 100 concurrent clients. This table shows the percentage of MySQL CPU profile (%) per transaction, and the mean crosstalk waiting time (in milliseconds) per transaction. Ad-
AdminConfirm AdminRequest BestSellers BuyConfirm BuyRequest CustomerRegistration Home NewProducts OrderDisplay ProductDetail SearchRequest SearchResult ShoppingCart
MySQL CPU profile (%) 0.82 0.00 51.50 0.04 0.03 0.00 0.57 3.29 0.01 0.22 0.16 43.28 0.07
Mean crosstalk wait time (ms) 93.76 6.68 22.16 68.55 0.11 0.01 1.51 1.59 0.09 0.66 1.15 5.52 0.86
Avg. response time of AdminConfirm, BestSellers & SearchResult transactions 45000 AdminConfirm - Original (MyISAM) BestSellers - Original (no caching) SearchResult - Original (no caching) AdminConfirm - Optimized (InnoDB) BestSellers - Optimized (caching) SearchResult - Optimized (caching)
40000 35000 Avg. response time (milliseconds)
Transaction
30000 25000 20000 15000 10000 5000
Table 1: MySQL CPU profile (%) and mean crosstalk waiting times for the different TPC-W transactions for browsing mix workload with 100 concurrent clients.
50
100
150
200
250
300
350
400
450
500
Concurrent clients
Figure 11: Average response time for AdminConfirm, BestSellers & SearchResult transactions under the original and the optimized cases. Throughput under browsing mix workload 3500 Caching Original (no caching) 3000
Throughput (transactions/min)
minConfirm’s crosstalk waiting time caused by waiting for locks held by other transactions is about 94 milliseconds on average, the maximum among all transactions. Table 1 further shows that about 51% and 43% of MySQL’s total CPU time is spent in response to queries for the BestSellers and the SearchResult interactions, respectively. Thus, the profile output of Whodunit suggests that the interface between the servlets for the AdminConfirm, BestSellers, and SearchResult interactions and the database server, i.e., the database queries, are the candidates for possible optimizations. AdminConfirm issues a heavy-weight database query involving sorting of table records, creation of a temporary table, and updating a single row in the item table. The item table is also accessed by read-only SQL queries from most of the other transactions. Since AdminConfirm requires an exclusive lock on item table, its crosstalk wait time is high. However, AdminConfirm need not acquire an exclusive (write) lock on the entire table, but rather an exclusive lock on the row being updated. The item table type in our database is a MyISAM table. The MyISAM table type supports only table-wide locking. The InnoDB table type supports locking on rows. We convert the item table to an InnoDB type. With this optimization we execute a browsing mix workload on TPC-W with varying number of concurrent clients. We measure the average response time of the AdminConfirm transaction and compare it with the same for the original TPC-W system that uses a MyISAM type item table. Figure 11 shows the results. Using the above optimization, we achieve between 9% and 72% reduction in AdminConfirm’s average response time. For example, under the browsing mix workload of 100 concurrent clients, AdminConfirm’s response time decreases from 640 milliseconds to 550 milliseconds. The servlets for the BestSellers and the SearchResult interactions both issue heavy-weight read-only SQL queries performing sorting on database records. Clause 6.3.3.1 of the TPC-W specification [23] states that the results of the BestSellers and the SearchResult transactions (involving search by subject) may be cached for a duration of 30 seconds. Further, the results for SearchResult interactions involving search by title or author may be cached forever. These optimizations have not been performed in the implementation of TPC-W that we are using. We add caching of the BestSellers and the SearchResult interaction results in the Java servlets. Caching substan-
0
2500
2000
1500
1000
500
0 50
100
150
200
250 300 Concurrent clients
350
400
450
500
Figure 12: Throughput (in transactions/minute) under browsing mix workload with and without caching. tially reduces the mean response time for these two transactions as shown in Figure 11. Figure 12 shows TPC-W’s throughput with and without caching of the BestSellers and the SearchResult transactions. Without caching, the database CPU becomes the bottleneck with a fewer number of clients (about 200 as shown in Figure 12). However, with caching, throughput increases almost linearly with an increasing number of clients up to about 450 clients, at which time the database CPU becomes the bottleneck and throughput does not increase any further. The peak throughput obtained under caching is 3376 interactions/minute — close to three times the peak throughput of 1184 interactions/minute obtained under the original (no caching) case.
9. WHODUNIT’S OVERHEAD First, we compare the overhead of csprof, Whodunit, and gprof on TPC-W. Then, we measure the overhead associated with the component of Whodunit that performs emulation of critical sections. Finally, we measure the overhead of Whodunit on Squid and Haboob.
9.1 Overhead for TPC-W We measure the peak throughput of TPC-W under four
No profile 1184
Profile with csprof 1151
Profile with Whodunit 1150
Profile with gprof 898
Table 2: Peak throughput (transactions/minute) of TPCW under various profiling tools.
scenarios: no profiling, profiling using csprof, profiling using Whodunit, and profiling using gprof. We used the same sampling frequency for csprof, Whodunit and gprof — equal to gprof’s default sampling frequency (666 times per second) on our platform. Table 2 shows the result of the above experiment. For TPC-W, csprof’s overhead (less than 3%) is much less than gprof’s overhead (about 24%), although both sample at the same frequency. gprof inserts instrumentation code to count procedure calls As a result, its overhead is proportional to the number of calls executed by a program and higher than csprof’s overhead, which remains relatively constant regardless of the number of calls [12]. Whodunit’s overhead on top of csprof is less than 0.1%. This additional overhead of Whodunit comes from propagating transaction contexts among stages and managing the profile data of a stage based on transaction contexts. At peak throughput, 92.52MB of data and 0.95MB of transaction context is transferred among the stages of TPC-W — a communication overhead of about 1%.
9.2 Overhead of Emulation First, we measure Whodunit’s performance overhead on Apache (version 2.0.54) due to emulation of its critical section. Then we measure the absolute cost of emulating Apache’s critical sections as shown in Figure 1. A transaction flows through shared memory in Apache only when a new connection is accepted by the listener thread and put in a shared queue to be later picked up (and processed) by a worker thread. Obviously, if all connections are persistent and no new connections are established, Whodunit does not need to emulate any code, and as such the application can proceed in “direct execution” mode without any overhead. In our experiment, we model a more realistic scenario, in which we execute a real web workload trace (collected at the web server of the Computer Science Department, Rice University) against Apache while profiling it using Whodunit 1 . The workload simulates concurrent clients that open new connections, send a few HTTP requests over them, close the connections, and then again send more HTTP requests over new connections. Thus, Whodunit has to repeatedly emulate the critical sections. For the above workload, we compare the throughput of Apache for two different cases: while not being profiled (“normal execution”) and while being profiled with Whodunit. For the normal execution mode, Apache’s peak throughput for the above workload is 393.64 Mb/s. While being profiled with Whodunit, Apache’s peak throughput is 384.58 Mb/s, an overhead of only 2.3%. Whodunit’s overhead is small because it uses QEMU [7], an efficient CPU emulator. QEMU caches the translated machine instructions of the emulated program, thereby obviating the need for repeated 1 This is the same workload trace that we use for the Apache case study in Section 8.
translations of Apache’s critical sections. Finally, we construct a micro-benchmark to measure the absolute cost of emulation in machine cycles. We measure the cost of executing the critical sections of Apache under direct execution mode and under emulation using Whodunit. Table 3 shows the results of this experiment. ap queue push and ap queue pop are the two critical sections of Apache. They take about 132 and 110 machines cycles to execute in direct execution mode, respectively. They take more than 62K and 40K cycles, respectively, when they are translated to intermediate code and then the intermediate code is executed. Due to QEMU’s caching, translation is performed only once, and subsequently when the critical sections are emulated, the translated code from the cache is executed. The cost of emulation for the two critical sections then drops to about 11K and 12K cycles, respectively. Critical Section ap queue push ap queue pop
Direct Execution 131.64 109.72
Translation and and Emulation 62508 40852
Emulation only 11606.8 12118
Table 3: Execution time of Apache’s critical sections (in machine cycles) for the different modes of execution.
9.3 Overhead for Squid and Haboob We measure the peak throughput delivered by Squid under two conditions: while being profiled by Whodunit, and while running with profiling disabled. For the web trace workload (from the CS department at Rice University) Squid’s peak throughput with profiling disabled is 262.27 Mb/s which drops to 247.85 Mb/s while being profiled — an overhead of about 5.5%. For Haboob, Whodunit reduces peak throughput by about 4.2%. Peak throughput drops from 31.16 Mb/s with profiling disabled to 29.84 Mb/s while being profiled.
10. RELATED WORK Project 5 [4, 21] infers causal paths from message traces in a distributed application to identify bottleneck components. Magpie [6] measures per-request resource consumption in a distributed application. Transactional profiling not only measures per-transaction resource usage, but relates the cost back to its source in the program. Transactional profiling is also the first to provide a mechanism to track transactions through shared memory, events and stages, and generic IPC, and to measure interference among transactions. The eel tool [10] facilitates control flow analysis and debugging of event-driven programs. It employs static analysis to construct a call graph connecting event-handlers, and as such callback registrations are not allowed to be persistent or use function pointers. Transactional profiling executes at run-time and does not impose these restrictions. Finally, eel distinguishes between each client-server connection (for debugging purposes), while transactional profiling groups all transactions of the same type and their profile data together. Several profiling tools for parallel programs collect call path data, e.g., CATCH [11], mpiP [24], Paradyn [8], and Tau [17]. These tools collect call paths within each process of a parallel program primarily to associate costs incurred by communication library routines to the program contexts in which the routines are called. Unlike transactional profiling, they do not consider interprocess call-path relationships.
11. CONCLUSIONS Tracking transactions and profiling them is important to characterize and optimize the performance of multi-tier applications. Existing tools and profiling techniques for this purpose are not general enough. We propose transactional profiling to perform end-to-end profiling of multi-tier applications tracking their transactions and profiling them. Transactional profiling is complicated by many factors, viz., distribution of execution, communication via shared memory, execution by events or stages, and interference among concurrent transactions. We provide novel algorithms and techniques as a general solution to this problem that may be applied to any multi-tier application. We achieve this without any additional support from the operating system or detailed knowledge about application behavior. We have implemented Whodunit, a prototype transactional profiler. We demonstrate the use of Whodunit in obtaining the transactional profile of applications such as Apache, Squid, Haboob and TPC-W. Using Apache and MySQL we validate our algorithm for detecting transaction flow through shared memory. Whodunit-inspired optimizations increased the peak throughput of TPC-W by close to 3x. We measured Whodunit’s overhead on the performance of TPC-W and found it to be less than 3%.
12. REFERENCES [1] ONLamp.com. At http://www.onlamp.com. [2] Squid Web Proxy Cache. At http://www.squid-cache.org. [3] TPC-W Code Release. At http: //www.cs.rice.edu/CS/Systems/DynaServer/TPC-W/. [4] Aguilera, M. K., Mogul, J. C., Wiener, J. L., Reynolds, P., and Muthitacharoen, A. Performance Debugging for Distributed Systems of Black Boxes. In Proceedings of the 19th ACM Symposium on Operating Systems Principles (SOSP ’03) (Oct. 2003), pp. 74–89. [5] Ammons, G., Ball, T., and Larus, J. R. Exploiting Hardware Performance Counters with Flow and Context Sensitive Profiling. In SIGPLAN Conference on Programming Language Design and Implementation (1997), pp. 85–96. [6] Barham, P., Donnelly, A., Isaacs, R., and Mortier, R. Using Magpie for Request Extraction and Workload Modelling. In The Proceedings of the 6th. Symposium on Operating Systems Design and Implementation (OSDI ’04) (Dec. 2004), pp. 259–272. [7] Bellard, F. QEMU open source processor emulator. http://fabrice.bellard.free.fr/qemu/. [8] Bernat, A. R., and Miller, B. P. Incremental call-path profiling. Tech. rep., University of Wisconsin, February 2004. [9] Corporation, B. S. ServerTrace. http://www. borland.com/us/products/servertrace/index.html. [10] Cunningham, R., and Kohler, E. Making Events Less Slippery With eel. In HotOS X: The 10th Workshop on Hot Topics in Operating Systems (June 2005). [11] DeRose, L., and Wolf, F. CATCH - a call-graph based automatic tool for capture of hardware performance metrics for mpi and openmp
[12]
[13]
[14]
[15]
[16]
[17]
[18] [19]
[20]
[21]
[22] [23]
[24]
[25]
[26]
applications. In Proceedings of the 2002 Euro-Par Conference (2002), Springer-Verlag, pp. 167–176. Froyd, N., Mellor-Crummey, J., and Fowler, R. Low-overhead call path sampling of unmodified, optimized code. In Proceedings of the 19th ACM International Conference on Supercomputing (June 2005). Graham, S. L., Kessler, P. B., and McKusick, M. K. gprof: a call graph execution profiler. In SIGPLAN Symposium on Compiler Construction (1982), pp. 120–126. Hall, R. J. Call path profiling. In Proceedings of the 14th International Conference on Software Engineering (1992), pp. 296–306. Hall, R. J., and Goldberg, A. J. Call path profiling of monotonic program resources in UNIX. In Proceedings of the USENIX Summer Technical Conference (1993). Ji, M., Felten, E. W., and Li, K. Performance Measurements for Multithreaded Programs. In Proceedings of ACM SIGMETRICS 1998 (1998), pp. 161–170. Malony, A. D., Shende, S., Bell, R., Li, K., Li, L., and Trebon, N. Advances in the TAU performance system. Kluwer Academic Publishers, Norwell, MA, USA, 2004, pp. 129–144. Performant, I. Optibench. http://www.performant.com. Provos, N. Libevent - an event notification library. Version 1.1 is available from the author’s web site, http://www.monkey.org/~provos/libevent/, Oct. 2003. Libevent is also included in recent releases of the NetBSD and OpenBSD operating systems. Quest Software, I. PerformaSure J2EE Application Performance Diagnostics. http://www.quest.com/performasure. Reynolds, P., Weiner, J. L., Mogul, J. C., Aguilera, M. K., and Vahdat, A. WAP5: Black-box Performance Debugging for Wide Area Systems. In Proceedings of the 15th International World Wide Web Conference (WWW2006) (May 2006). Sun Developer Network. Java Enterprise Edition. http://java.sun.com/javaee/. (TPC), T. P. P. C. TPC BENCHMARK W (web commerce). At http://www.tpc.org/tpcw/, Feb. 2002. Vetter, J. S., and McCracken, M. O. Statistical scalability analysis of communication operations in distributed applications. In ACM SIGPLAN Symposium on Principles and Practice of Parallel Programming (PPoPP) (2001), pp. 123–132. Welsh, M., Culler, D. E., and Brewer, E. A. SEDA: An architecture for well-conditioned, scalable internet services. In Symposium on Operating Systems Principles (Oct. 2001), pp. 230–243. www.freebsd.org. sys/queue.h Man Page. http://www.freebsd.org/cgi/man.cgi?query= queue&apropos=0&sektion=3&manpath=FreeBSD+6. 1-RELEASE&format=html.